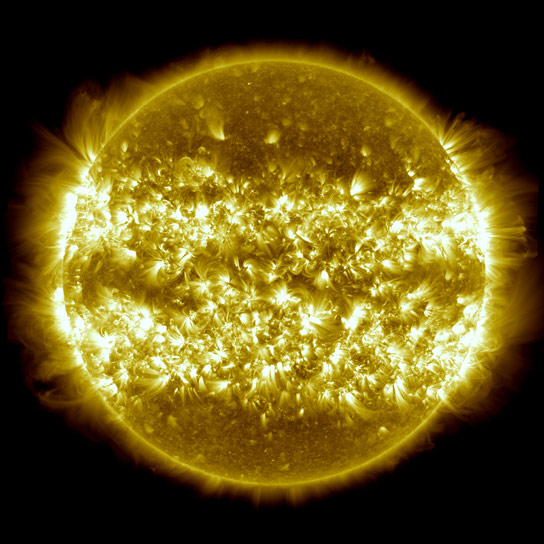
This image is a composite of 25 separate images spanning the period of April 16, 2012, to April 15, 2013. It uses the SDO AIA wavelength of 171 angstroms and reveals the zones on the sun where active regions are most common during this part of the solar cycle. Credit: NASA/SDO/AIA/S. Wiessinger
NASA’s Solar Dynamics Observatory has had consistent coverage of the sun’s rise toward solar maximum since 2010 and now that data has been compressed into a four-minute video at a pace of two images per day.
In the three years since it first provided images of the sun in the spring of 2010, NASA’s Solar Dynamics Observatory (SDO) has had virtually unbroken coverage of the sun’s rise toward solar maximum, the peak of solar activity in its regular 11-year cycle. This video shows those three years of the sun at a pace of two images per day. Each image is displayed for two frames at a 29.97 frame rate.
SDO’s Atmospheric Imaging Assembly (AIA) captures a shot of the sun every 12 seconds in 10 different wavelengths. The images shown here are based on a wavelength of 171 Angstroms, which is in the extreme ultraviolet range and shows solar material at around 600,000 Kelvin (600,000 Celsius or 1.1 million Fahrenheit). In this wavelength it is easy to see the sun’s 25-day rotation as well as how solar activity has increased over three years.
During the course of the video, the sun subtly increases and decreases in apparent size. This is because the distance between the SDO spacecraft and the sun varies over time. The image is, however, remarkably consistent and stable despite the fact that SDO orbits the Earth at 6,876 miles (11,065 kilometers) per hour and the Earth orbits the sun at 67,062 miles (107,926 kilometers) per hour.
Such stability is crucial for scientists, who use SDO to learn more about our closest star. These images have regularly caught solar flares and coronal mass ejections in the act, types of space weather that can send radiation and solar material toward Earth and interfere with satellites in space. SDO’s glimpses into the violent dance on the sun help scientists understand what causes these giant explosions – with the hopes of someday improving our ability to predict this space weather.
The four-wavelength view at the end of the video shows light at 4500 Angstroms, which is basically the visible light view of the sun, and reveals sunspots; light at 193 Angstroms which highlights material at 1 million Kelvin and reveals more of the sun’s corona; light at 304 Angstroms which highlights material at around 50,000 Kelvin (90,000 Fahrenheit) and shows features in the transition region and chromosphere of the sun; and light at 171 Angstroms.
Noteworthy events that appear briefly in the main sequence of this video:
- 00:30;24 Partial eclipse by the moon
- 00:31;16 Roll maneuver
- 01:11;02 August 9, 2011, X6.9 Flare, currently the largest of this solar cycle
- 01:28;07 Comet Lovejoy, December 15, 2011
- 01:42;29 Roll Maneuver
- 01:51;07 Transit of Venus, June 5, 2012
- 02:28;13 Partial eclipse by the moon


There is also a giraffe that appears in the 193 angstroms segment!