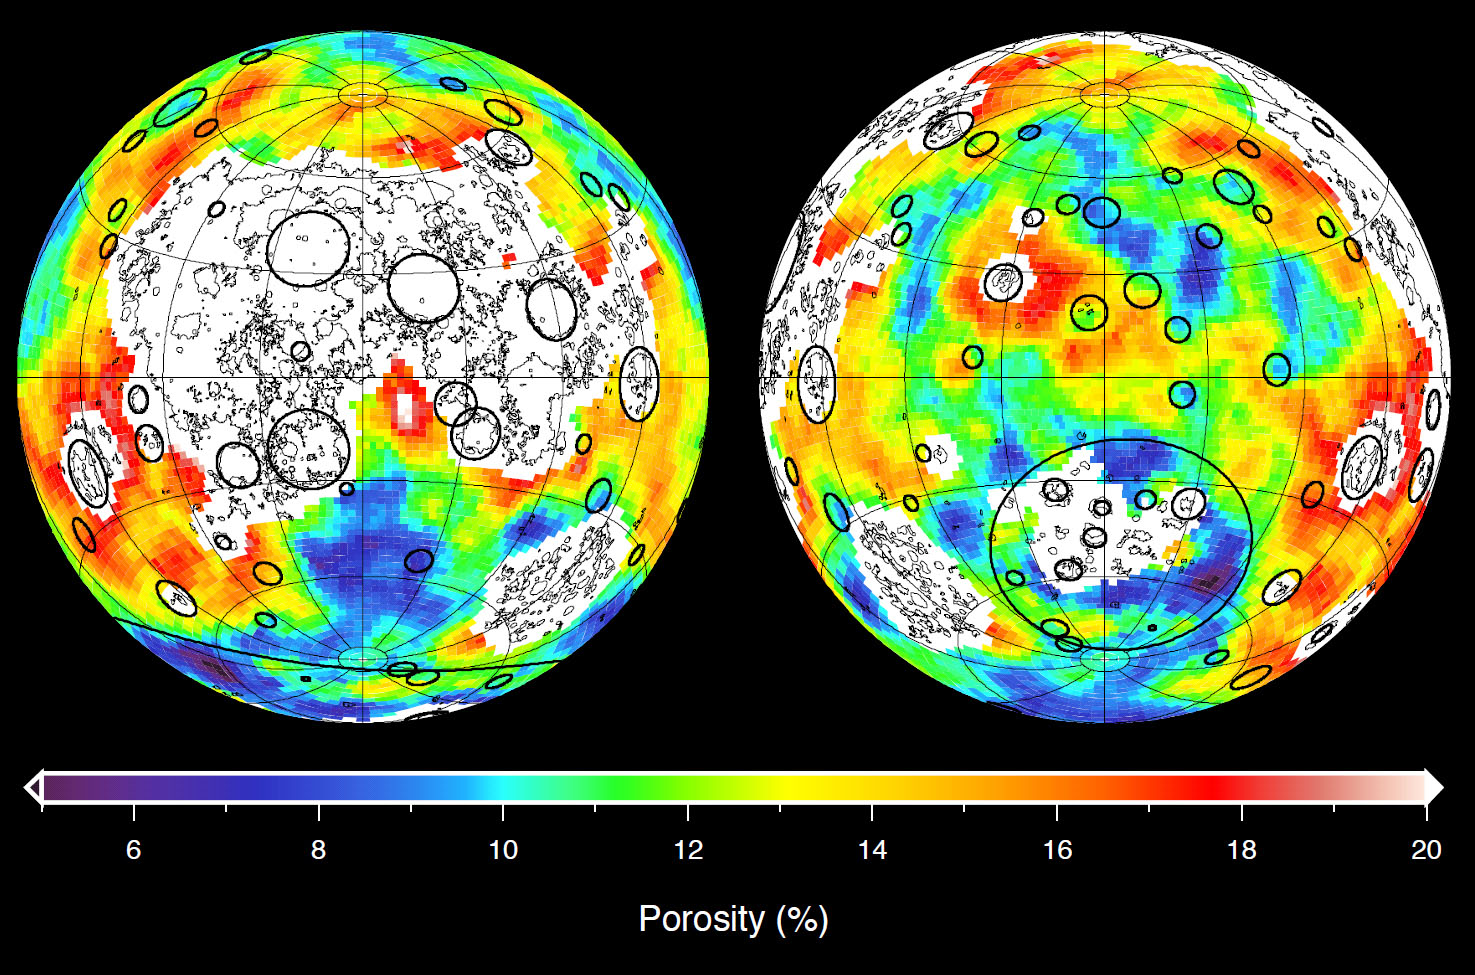
This image depicting the porosity of the lunar highland crust was derived using bulk density data from NASA’s GRAIL mission and independent grain density measurements from NASA’s Apollo moon mission samples as well as orbital remote-sensing data. Red corresponds to higher-than-average porosities and blue corresponds to lower-than-average porosities. White denotes regions that contain mare basalts (thin lines) and that were not analyzed.
The 12 percent average porosity of the highland crust is a consequence of fractures generated by billions of years of impact cratering. The crustal porosities in the interiors of many impact basins are lower than their surroundings, a result of high temperatures experienced at the time of crater formation. In contrast, the porosities immediately exterior to many impact basins are higher than average as a result of fracturing by impact-generated shock waves and the deposition of impact ejecta. Credit: NASA/JPL-Caltech/ IPGP
New data from NASA’s Ebb and Flow probes was used to generate a high-resolution gravity field map of the moon, showing that the moon’s gravity field is unlike that of any terrestrial planet in our solar system and revealing an abundance of features never before seen in detail.
Twin NASA probes orbiting Earth’s moon have generated the highest-resolution gravity field map of any celestial body.
The new map, created by the Gravity Recovery and Interior Laboratory (GRAIL) mission, is allowing scientists to learn about the moon’s internal structure and composition in unprecedented detail. Data from the two washing machine-sized spacecraft also will provide a better understanding of how Earth and other rocky planets in the solar system formed and evolved.
The gravity field map reveals an abundance of features never before seen in detail, such as tectonic structures, volcanic landforms, basin rings, crater central peaks and numerous simple, bowl-shaped craters. Data also show the moon’s gravity field is unlike that of any terrestrial planet in our solar system.
This movie shows the variations in the lunar gravity field as measured by NASA’s Gravity Recovery and Interior Laboratory (GRAIL) during the primary mapping mission from March to May 2012. Very precise microwave measurements between two spacecraft, named Ebb and Flow, were used to map gravity with high precision and high spatial resolution. The field shown resolves blocks on the surface of about 12 miles (20 kilometers) and measurements are three to five times improved over previous data. Red corresponds to mass excesses and blue corresponds to mass deficiencies. The map shows more small-scale detail on the far side of the moon compared to the nearside because the far side has many more small craters. Credit: NASA/JPL-Caltech/MIT/GSFC
These are the first scientific results from the prime phase of the mission, and they are published in three papers in the journal Science (“The Crust of the Moon as Seen by GRAIL”, “Gravity Field of the Moon from the Gravity Recovery and Interior Laboratory (GRAIL) Mission”, “Ancient Igneous Intrusions and Early Expansion of the Moon Revealed by GRAIL Gravity Gradiometry”).
“What this map tells us is that more than any other celestial body we know of, the moon wears its gravity field on its sleeve,” said GRAIL Principal Investigator Maria Zuber of the Massachusetts Institute of Technology in Cambridge. “When we see a notable change in the gravity field, we can sync up this change with surface topography features such as craters, rilles, or mountains.”
According to Zuber, the moon’s gravity field preserves the record of impact bombardment that characterized all terrestrial planetary bodies and reveals evidence of fracturing of the interior extending to the deep crust and possibly the mantle. This impact record is preserved, and now precisely measured, on the moon.
The probes revealed the bulk density of the moon’s highland crust is substantially lower than generally assumed. This low-bulk crustal density agrees well with data obtained during the final Apollo lunar missions in the early 1970s, indicating that local samples returned by astronauts are indicative of global processes.
“With our new crustal bulk density determination, we find that the average thickness of the moon’s crust is between 21 and 27 miles (34 and 43 kilometers), which is about 6 to 12 miles (10 to 20 kilometers) thinner than previously thought,” said Mark Wieczorek, GRAIL co-investigator at the Institut de Physique du Globe de Paris. “With this crustal thickness, the bulk composition of the moon is similar to that of Earth. This supports models where the moon is derived from Earth materials that were ejected during a giant impact event early in solar system history.”
The map was created by the spacecraft transmitting radio signals to define precisely the distance between them as they orbit the moon in formation. As they fly over areas of greater and lesser gravity caused by visible features, such as mountains and craters, and masses hidden beneath the lunar surface, the distance between the two spacecraft will change slightly.
“We used gradients of the gravity field in order to highlight smaller and narrower structures than could be seen in previous datasets,” said Jeff Andrews-Hanna, a GRAIL guest scientist with the Colorado School of Mines in Golden. “This data revealed a population of long, linear gravity anomalies, with lengths of hundreds of kilometers, crisscrossing the surface. These linear gravity anomalies indicate the presence of dikes, or long, thin, vertical bodies of solidified magma in the subsurface. The dikes are among the oldest features on the moon, and understanding them will tell us about its early history.”

This map shows the gravity field of the moon as measured by NASA’s GRAIL mission. The viewing perspective, known as a Mercator projection, shows the far side of the moon in the center and the nearside (as viewed from Earth) at either side.
Units are milliGalileos where 1 Galileo is 1 centimeter per second squared. Reds correspond to mass excesses which create areas of higher local gravity, and blues correspond to mass deficits which create areas of lower local gravity. Credit: NASA/ARC/MIT
While results from the primary science mission are just beginning to be released, the collection of gravity science by the lunar twins continues. GRAIL’s extended mission science phase began on August 30 and will conclude on December 17. As the end of the mission nears, the spacecraft will operate at lower orbital altitudes above the moon.
When launched in September 2011, the probes were named GRAIL A and B. They were renamed Ebb and Flow in January by elementary students in Bozeman, Mont., in a nationwide contest. Ebb and Flow were placed in a near-polar, near-circular orbit at an altitude of approximately 34 miles (55 kilometers) on December 31, 2011, and January 1, 2012, respectively.
References:
“The Crust of the Moon as Seen by GRAIL” by Mark A. Wieczorek, Gregory A. Neumann, Francis Nimmo, Walter S. Kiefer, G. Jeffrey Taylor, H. Jay Melosh, Roger J. Phillips, Sean C. Solomon, Jeffrey C. Andrews-Hanna, Sami W. Asmar, Alexander S. Konopliv, Frank G. Lemoine, David E. Smith, Michael M. Watkins, James G. Williams and Maria T. Zuber, 5 December 2012, Science.
DOI: 10.1126/science.1231530
“Gravity Field of the Moon from the Gravity Recovery and Interior Laboratory (GRAIL) Mission” by Maria T. Zuber, David E. Smith, Michael M. Watkins, Sami W. Asmar, Alexander S. Konopliv, Frank G. Lemoine, H. Jay Melosh, Gregory A. Neumann, Roger J. Phillips, Sean C. Solomon, Mark A. Wieczorek, James G. Williams, Sander J. Goossens, Gerhard Kruizinga, Erwan Mazarico, Ryan S. Park and Dah-Ning Yuan, 5 December 2012, Science.
DOI: 10.1126/science.1231507
“Ancient Igneous Intrusions and Early Expansion of the Moon Revealed by GRAIL Gravity Gradiometry” by Jeffrey C. Andrews-Hanna, Sami W. Asmar, James W. Head, Walter S. Kiefer, Alexander S. Konopliv, Frank G. Lemoine, Isamu Matsuyama, Erwan Mazarico, Patrick J. McGovern, H. Jay Melosh, Gregory A. Neumann, Francis Nimmo, Roger J. Phillips, David E. Smith, Sean C. Solomon, G. Jeffrey Taylor, Mark A. Wieczorek, James G. Williams and Maria T. Zuber, 5 December 2012, Science.
DOI: 10.1126/science.1231753
NASA’s Jet Propulsion Laboratory in Pasadena, California, manages the mission for NASA’s Science Mission Directorate in Washington. GRAIL is part of the Discovery Program managed at NASA’s Marshall Space Flight Center in Huntsville, Alabama. Lockheed Martin Space Systems of Denver built the spacecraft.
JPL is a division of the California Institute of Technology in Pasadena.


Be the first to comment on "GRAIL Generates High Resolution Gravity Field Map of the Moon"