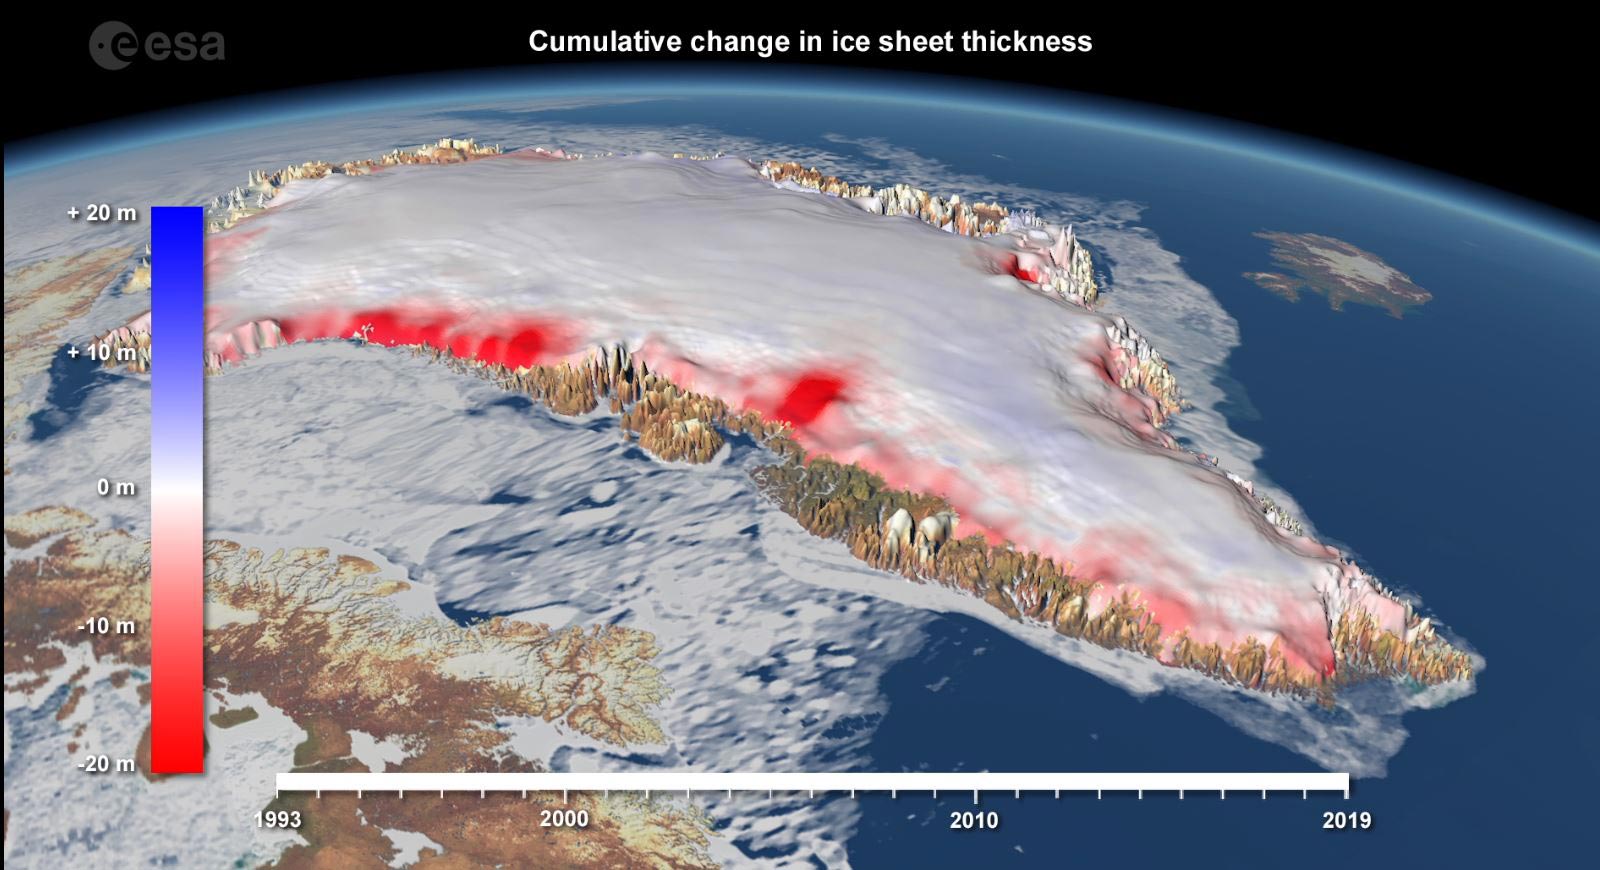
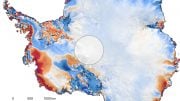
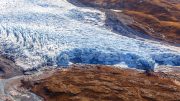
Areas in red highlight the zones of cumulative change in ice sheet thickness in Greenland, between 1993-2019. Credit: IMBIE / CPOM at Northumbria University
The past decade has seen the worst years for polar ice sheet melting, with 2019 being the record year. Ice sheet melting now accounts for 25.6% of sea level rise, a fivefold increase since the 1990s.
The seven worst years for polar ice sheet melting have occurred during the past decade, with 2019 being the worst year on record, according to a study by IMBIE. The polar ice sheets lost 7,560 billion tonnes of ice between 1992 and 2020, causing a 21 mm rise in global sea levels. Ice sheet melting now accounts for a quarter of all sea level rise, a fivefold increase since the 1990s. Continued ice sheet melting at the current pace could contribute between 148 and 272 mm to global mean-sea level by the end of the century.
The seven worst years for polar ice sheets melting and losing ice have occurred during the past decade, according to new research, with 2019 being the worst year on record.
The melting ice sheets now account for a quarter of all sea level rise – a fivefold increase since the 1990’s – according to IMBIE, an international team of researchers who have combined 50 satellite surveys of Antarctica and Greenland taken between 1992 and 2020.
Their findings are published today (April 20) in the journal Earth System Science Data.
Global heating is melting the polar ice sheets, driving up sea levels and coastal flooding around our planet. Ice losses from Greenland and Antarctica can now be reliably measured from space by tracking changes in their volume, gravitational pull, or ice flow.
NASA and the European Space Agency (ESA) awarded funding to the Ice Sheet Mass Balance Intercomparison Exercise (IMBIE) in 2011 to compile the satellite record of polar ice sheet melting. Data collected by the team is widely used by leading organisations, including by the Intergovernmental Panel on Climate Change (IPCC).
In their latest assessment, the IMBIE Team – which is led by Northumbria University’s Centre for Polar Observations and Modelling – have combined 50 satellite surveys of Antarctica and Greenland to determine their rate of ice melting.
They have found that Earth’s polar ice sheets lost 7,560 billion tonnes of ice between 1992 and 2020 – equivalent to an ice cube that would be 20 kilometres in height.
The polar ice sheets have together lost ice in every year of the satellite record, and the seven highest melting years have occurred in the past decade.
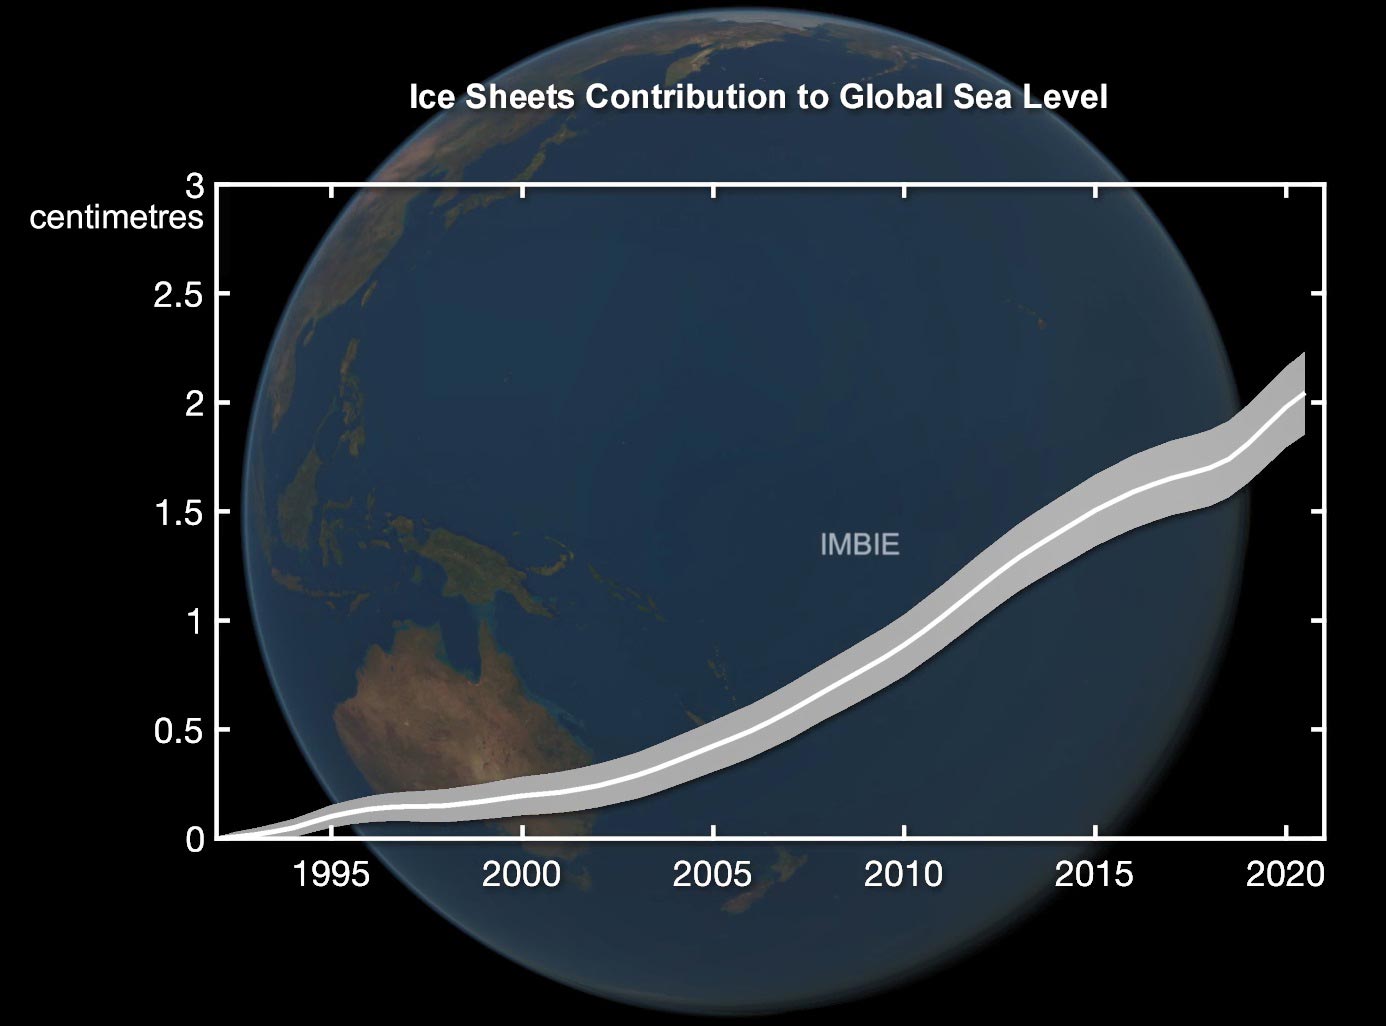
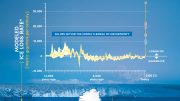
Graph from IMBIE satellite data research showing the increasing contribution of ice sheets to global sea level from 1992 to 2020. Credit:IMBIE / CPOM at Northumbria University
The satellite records show that 2019 was the record melting year when the ice sheets lost a staggering 612 billion tonnes of ice.
This loss was driven by an Arctic summer heatwave, which led to record melting from Greenland peaking at 444 billion tonnes that year. Antarctica lost 168 billion tonnes of ice – the sixth highest on record – due to the continued speedup of glaciers in West Antarctica and record melting from the Antarctic Peninsula. The East Antarctic Ice Sheet remained close to a state of balance, as it has throughout the satellite era.
Melting of the polar ice sheets has caused a 21 mm rise in global sea level since 1992, almost two-thirds (13.5 mm) of which has originated from Greenland and one-third (7.4 mm) from Antarctica.
In the early 1990s, ice sheet melting accounted for only a small fraction (5.6 %) of sea level rise. However, there has been a fivefold increase in melting since then, and they are now responsible for more than a quarter (25.6 %) of all sea level rise. If the ice sheets continue to lose mass at this pace, the IPCC predicts that they will contribute between 148 and 272 mm to global mean-sea level by the end of the century.
The latest Ice Sheet Mass Balance Intercomparison Exercise (IMBIE) reports that ice loss from Greenland and Antarctica has increased fivefold since the 1990s, and now accounts for a quarter of sea-level rise. The assessment states that between 1992 and 2020, the polar ice sheets lost 7560 billion tonnes of ice – equivalent to an ice cube measuring 20 km each side. Melting of the polar ice sheets has caused a 21 mm rise in global sea level since 1992. Ice loss from Greenland is responsible for almost two-thirds (13.5 mm) of this rise, and ice loss from Antarctica is responsible for the other third (7.4 mm). The polar ice sheets have together lost ice in every year of the satellite record, and the seven highest melting years have occurred in the last decade. Credit: ESA/Planetary Visions
Professor Andrew Shepherd, Head of the Department of Geography and Environmental Sciences at Northumbria University and founder of IMBIE, said: “After a decade of work we are finally at the stage where we can continuously update our assessments of ice sheet mass balance as there are enough satellites in space monitoring them, which means that people can make use of our findings immediately.”
Dr. Inès Otosaka from the University of Leeds, who led the study, said: “Ice losses from Greenland and Antarctica have rapidly increased over the satellite record and are now a major contributor to sea level rise. Continuously monitoring the ice sheets is critical to predict their future behaviour in a warming world and adapt for the associated risks that coastal communities around the world will face.”
This is now the third assessment of ice loss produced by the IMBIE team, due to continued cooperation between the space agencies and the scientific community. The first and second assessments were published in 2012 and 2018/19.
Over the past few years, ESA and NASA have made a dedicated effort to launch new satellite missions capable of monitoring the polar regions. The IMBIE project has taken advantage of these to produce more regular updates, and, for the first time, it is now possible to chart polar ice sheet losses every year.
This third assessment from the IMBIE Team, funded by the ESA and NASA, involved a team of 68 polar scientists from 41 international organisations using measurements from 17 satellite missions, including for the first time from the GRACE-FO gravity mission. Importantly, it brings the records of ice loss from Antarctica and Greenland in line, using the same methods and covering the same period in time. The assessment will now be updated annually to make sure that the scientific community has the very latest estimates of polar ice losses.
Dr Diego Fernandez, Head of Research and Development at ESA, said: “This is another milestone in the IMBIE initiative and represent an example of how scientists can coordinate efforts to assess the evolution of ice sheets from space offering unique and timely information on the magnitude and onset of changes.
“The new annual assessments represent a step forward in the way IMBIE will help to monitor these critical regions, where variations have reached a scale where abrupt changes can no longer be excluded.”
Reference: “Antarctic and Greenland Ice Sheet mass balance 1992-2020 for IPCC AR6” 20 April 2023, Earth System Science Data.
DOI: 10.5285/77B64C55-7166-4A06-9DEF-2E400398E452
The study, Antarctic and Greenland Ice Sheet mass balance 1992-2020 for IPCC AR6, is published in the journal Earth System Science Data, and the new dataset is publicly available on the British Antarctic Survey website.
Sadly, the study of our planets climate has become so politicized, and academia so biased to one side of those politics, I can have no confidence in this report. Even mechanisms other than CO2 are third rail territory.
Again, and again academics have been caught misrepresenting science regarding this subject.
It is to be expected that ice will be melting more rapidly along the perimeter of Greenland because the ice is thinner there, it is at lower elevations than the interior and closer to the ‘warm’ oceans, and subject to calving.
However, what is somewhat surprising are the localized, anomalously high rates of melting on the western coast, in the northern half. An inquiring mind might ask, “Why?” It generally gets colder as one moves north, and the duration and intensity of sunlight decreases towards the pole. Has anyone made any measurements of the geothermal gradient at these high melting-rate locations? Has anyone made an attempt to explain the localized anomalies?