
1980 – 2099
New climate research shows where to expect hot and humid heat waves in the United States in the coming decades.
In the summer of 2022, record-breaking heat waves in California and elsewhere have triggered a flurry of health alerts and warnings, strained power grids, and left millions of the most vulnerable Americans sweltering through uncomfortable and sometimes deadly conditions.
Oppressively hot and humid summers like this one are going to become much more common if current trends continue. That is the key finding from a set of new climate projections conducted by a team of scientists from NASA’s Jet Propulsion Laboratory (JPL) and several universities. Colin Raymond, a researcher at JPL, and colleagues used projections from 20 climate models to estimate how much heat stress people across the United States might face between 2075-2099 on the hottest summer days as compared to observed norms between 1980 and 2005.
“If we assume a high-end emissions scenario and we end up with a 3°C to 5°C increase in global temperatures by 2075, what has been the top 1 percent of summer days for heat stress will be happening for a quarter to half of the summer. That’s a huge difference,” said Raymond. “That one oppressively hot day you remember as summer’s worst could well be happening on 30 or even 50 days each summer by 2075.”
Using downscaled output from the Coupled Model Intercomparison Project 5 (CMIP5), the scientists went beyond simple modeling of future air temperatures. They combined heat, humidity, and exposure to sunlight to project future heat stress by calculating a metric known as an environmental stress index (ESI). Their full results, published in the journal Environmental Research Letters, indicate serious changes ahead.
The incorporation of humidity changes into the analysis is critical, according to Raymond. Because humid conditions make sweating and evaporation less efficient, the human body has more difficulty cooling itself in humid heat compared to dry heat. That’s why humid conditions are not only less comfortable, but perhaps also more likely to contribute to heat-related illnesses and deaths. Heat waves are the deadliest type of natural disaster in the United States. They lead to an average of at least 100 deaths per year and likely contribute to many more, according to data from the Centers for Disease Control and Prevention (CDC).
1980 – 2099
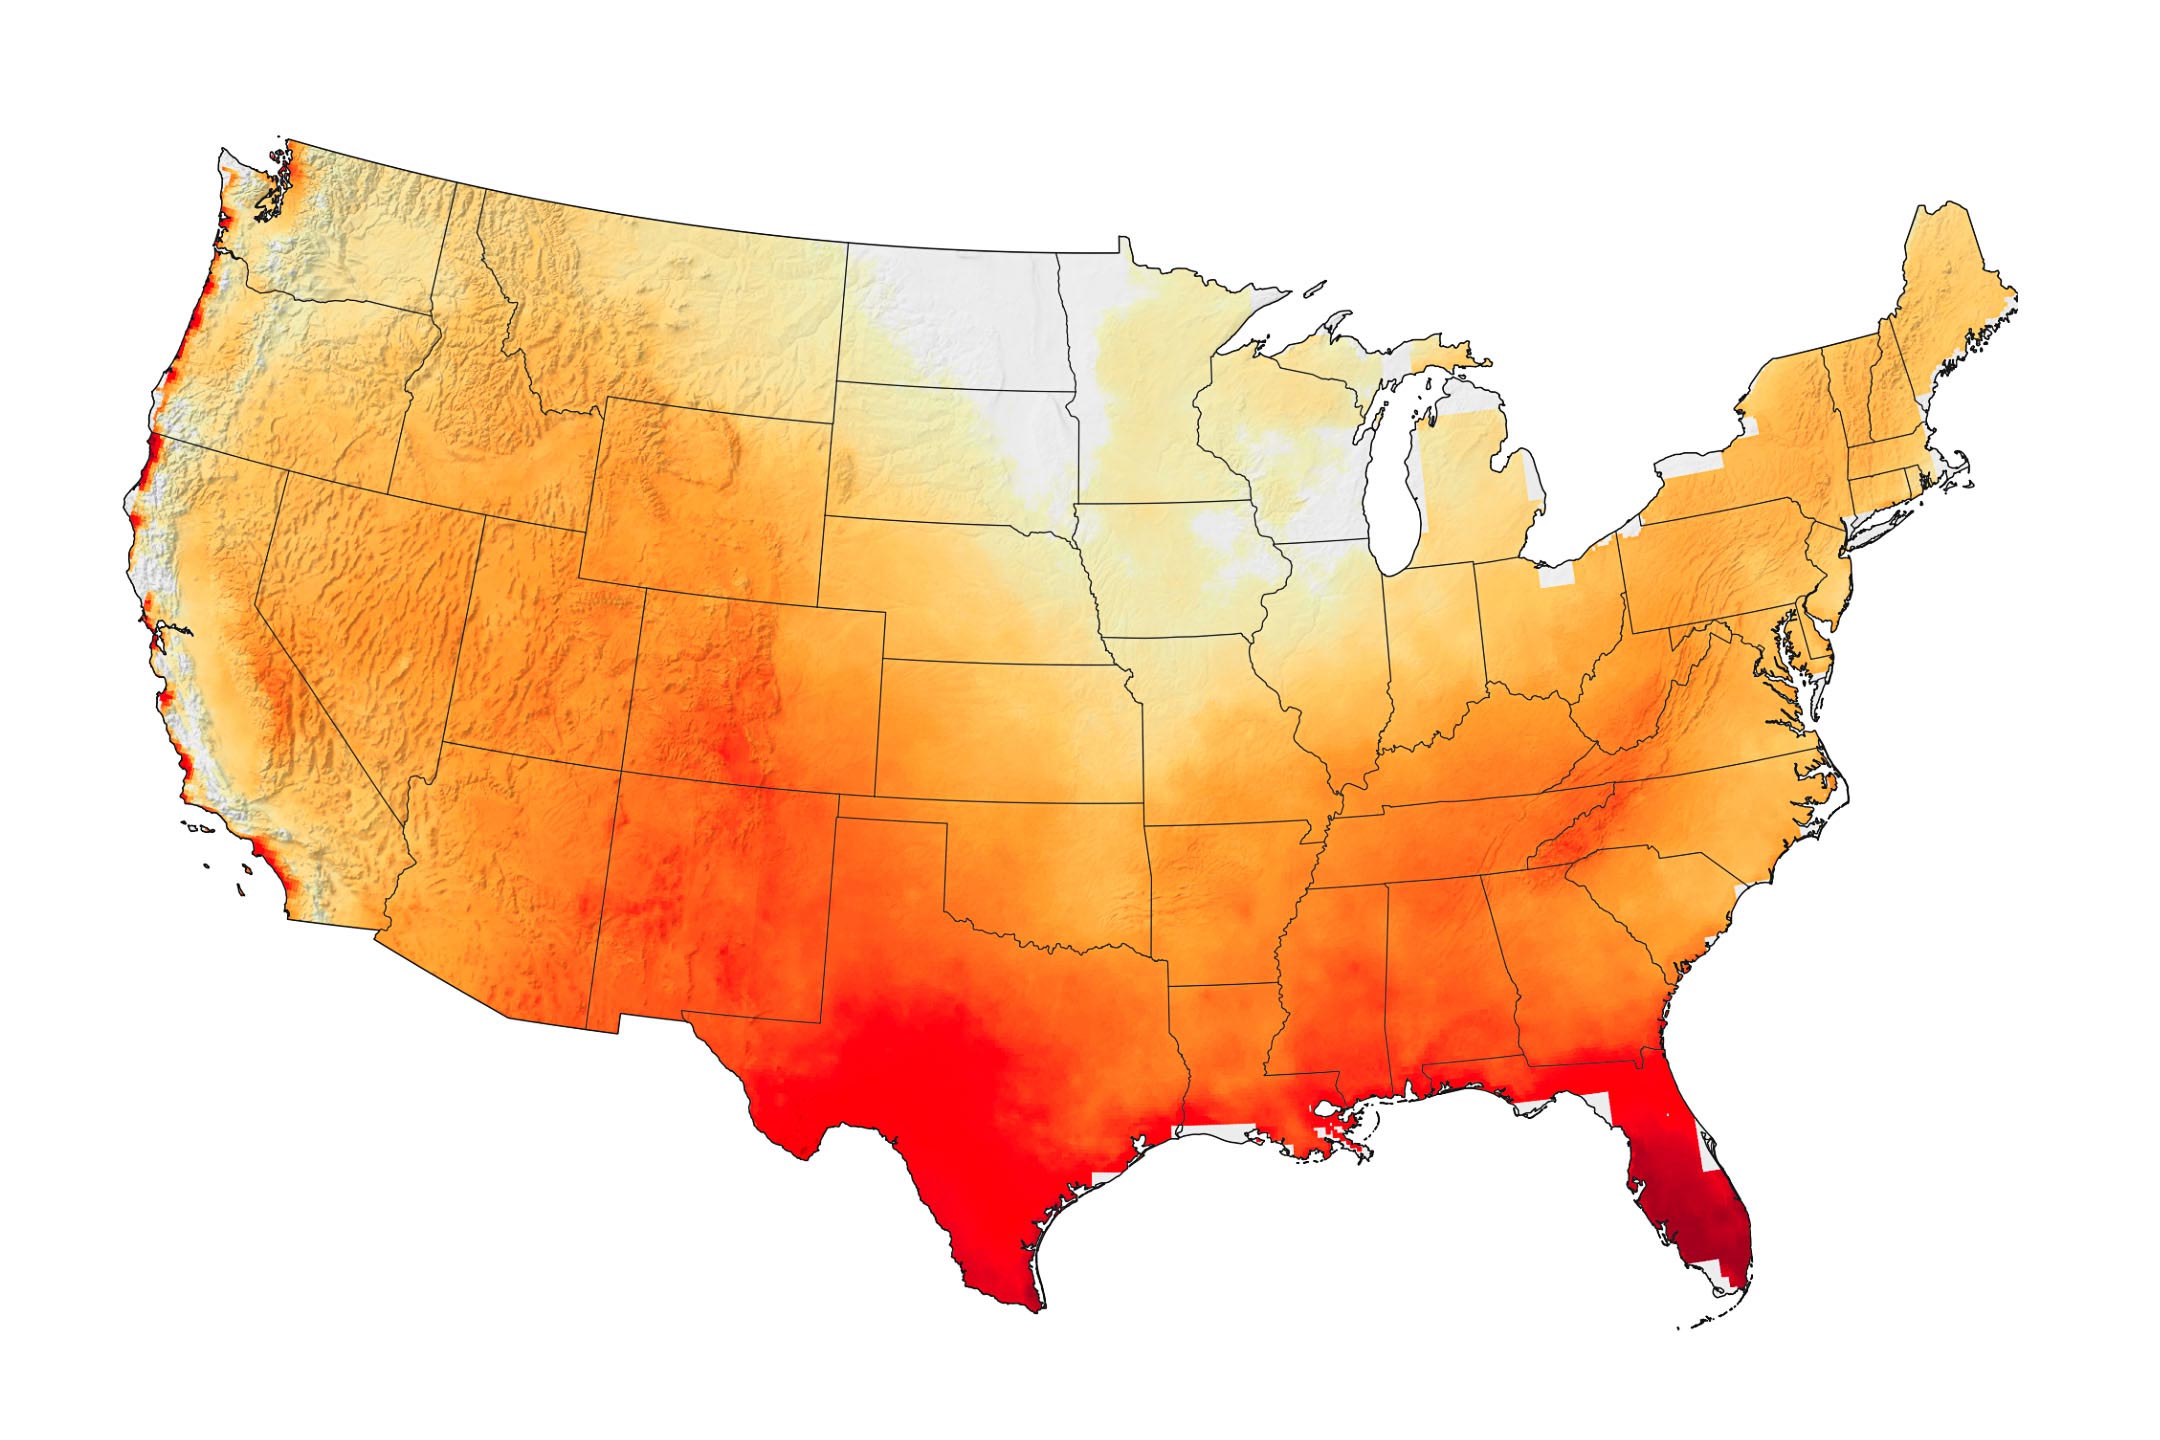
First, the scientists calculated the top 1 percent of days on the ESI, a proxy for extreme heat stress, averaged for May-September 1980-2005 as a baseline. They then calculated the same for 2074-2099, assuming higher levels of greenhouse gases in the atmosphere and changes to air temperatures, humidity, and sunlight reaching the surface due to changes in cloudiness. As seen in the map above, some of the largest changes in extreme heat stress will likely occur in the high latitudes, inland, and in mountainous areas—particularly in the Upper Midwest, Northeast, and the Pacific Northwest. In these areas, the top 1 percent of days for heat stress could have temperatures that are roughly 5°C (9°F) higher than during the 1980-2005 baseline.
Increases in extreme heat stress in coastal areas, especially in California, would be more moderate than in other areas because climate change is causing the land to warm up more quickly than oceans, and upwelling ocean water fuels sea breezes that help disperse stagnant heat and air. In contrast, higher elevation areas show amplified heat stress because they are expected to warm up more quickly than lower elevation areas due to a shift toward drier air, drier soil, and less cloud cover.
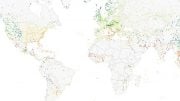
The Gulf Coast states will likely experience less pronounced changes on the hottest days. But since they have less variability between highs and lows to begin with compared to more northerly states, they will see the greatest relative increases in the frequency of extreme heat stress days (as seen in the second map). Southern Florida and Texas could see extreme heat stress days up to 50 times more often compared to the historical (1980-2005) norms. The increase in the frequency of extreme heat stress days in the Pacific Northwest or Upper Midwest would be closer to 20 times. Rising temperatures were the primary driver of the changes in heat stress throughout the United States, but humidity increases were nearly as important in the southern and eastern U.S. Elevation was also an important factor in which areas will see increases in heat stress.
Dangerous heat wasn’t only a problem in the United States in the summer of 2022. Parts of Europe, Asia, and the Middle East faced searing heat along with the United States. At times in the United Kingdom, runways melted and train tracks buckled. In Shanghai, China, authorities started dimming lights in the Bund and factories due to power shortages.
None of this was a coincidence. “We’re seeing more heat waves, and they’re becoming more intense—and that’s because of climate change,” explained Gavin Schmidt, the director of NASA’s Goddard Institute for Space Studies. “We have warmed up the planet by about two degrees Fahrenheit in the last century or so. That is juicing the extremes, so the number of times places are exceeding 90 or 100 degrees Fahrenheit (32 or 37 degrees Celsius) is going up—and not just by a little bit. It’s gone up four, five, seven times more than before.”
Reference: “Regional and elevational patterns of extreme heat stress change in the US” by Colin Raymond, Duane Waliser, Bin Guan, Huikyo Lee, Paul Loikith, Elias Massoud, Agniv Sengupta, Deepti Singh and Adrienne Wootten, 7 June 2022, Environmental Research Letters.
DOI: 10.1088/1748-9326/ac7343
NASA Earth Observatory images by Joshua Stevens, using data courtesy of Raymond, C., et al. (2022).


Interestingly, CMIP5 predicts future extreme ESI locations on the west coast to coincide with the known Urban Heat Islands of major metropolitan areas. That is, land use changes appear to be the driver rather than CO2 increases.
Historical evidence does not support the model predictions for increased frequency or intensity of heat waves for the continental United States:
https://wattsupwiththat.com/2019/09/06/the-gestalt-of-heat-waves/