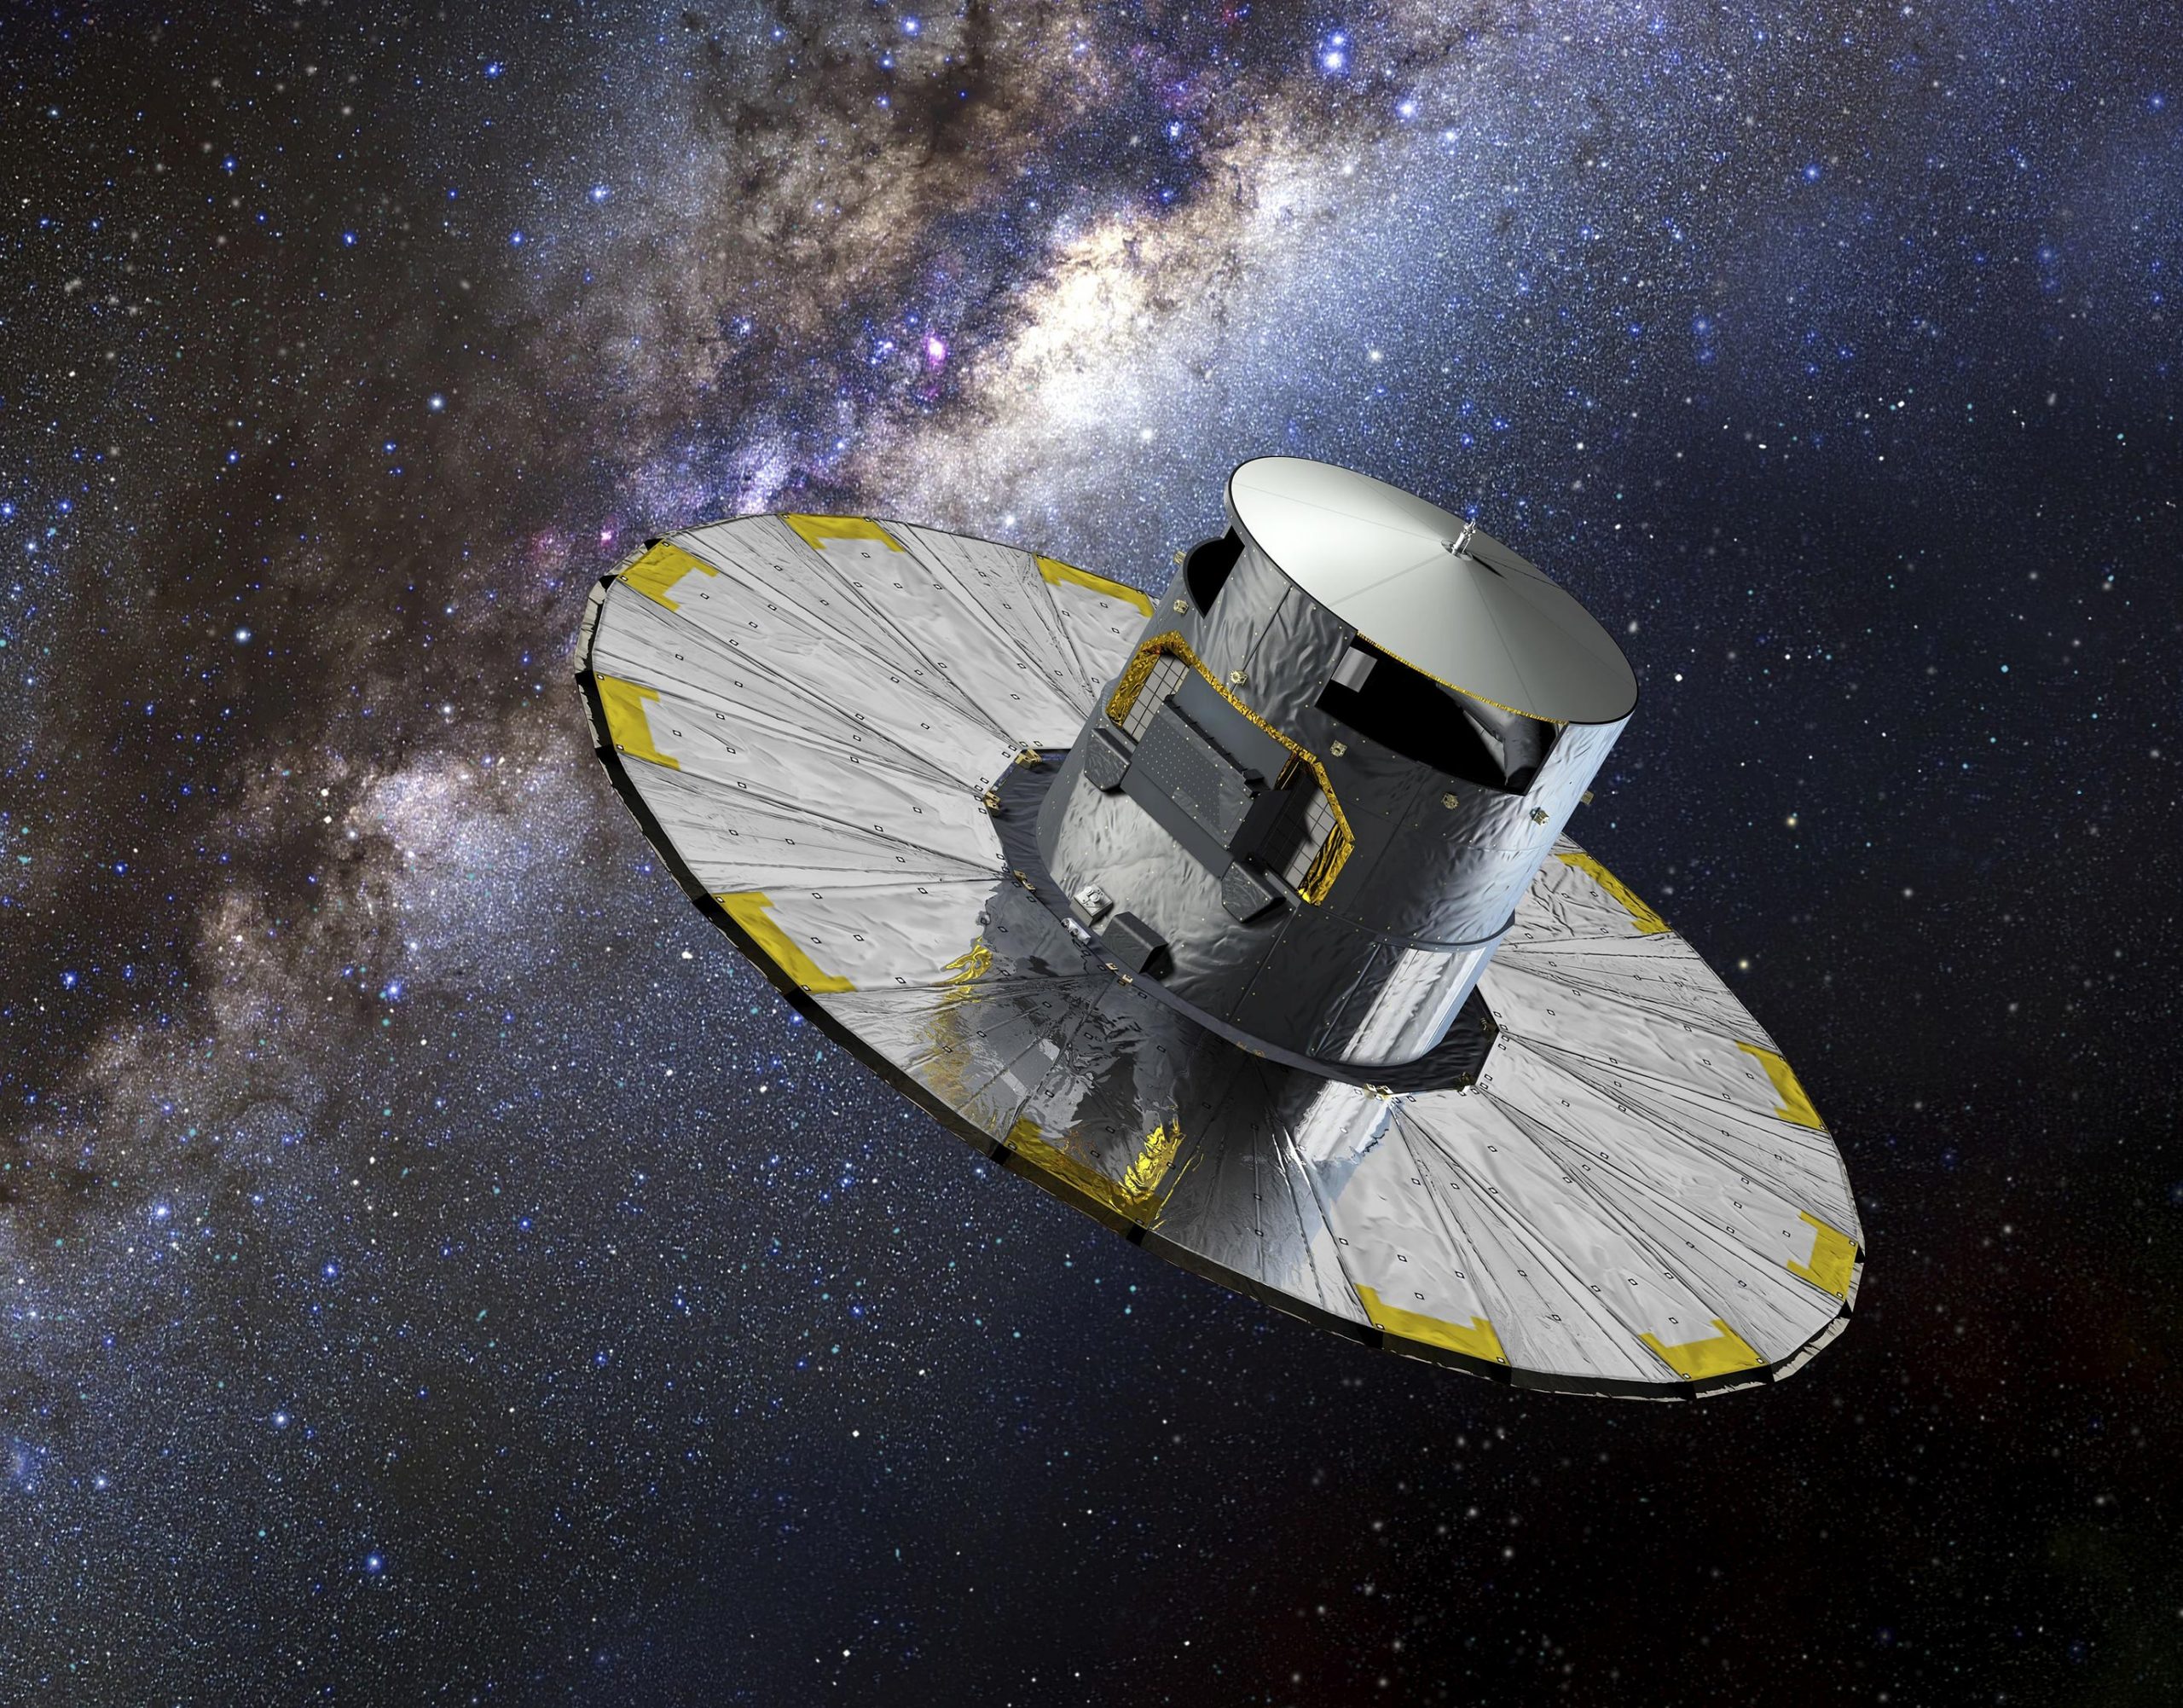
Gaia is an ambitious mission to chart a three-dimensional map of our Galaxy, the Milky Way, in the process revealing the composition, formation, and evolution of the Galaxy. Gaia provides unprecedented positional and radial velocity measurements with the accuracies needed to produce a stereoscopic and kinematic census of about one billion stars in our Galaxy and throughout the Local Group. Credit: ESA–D. Ducros, 2013
Launched in 2013, the Gaia satellite has been scanning the sky to measure the positions, distances and motions of more than one billion stars in our galaxy, the Milky Way. The goal of the mission is to create the most detailed galactic map ever made, in order to investigate the Milky Way’s past and future history like never before.
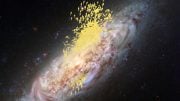
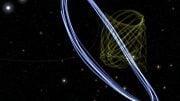
The animation below shows the satellite as it scans great circles around the sky. Eventually, the sky is unfolded to reveal the view of the Milky Way and neighboring galaxies, based on measurements of nearly 1.7 billion stars from the second Gaia data release. The map shows the total brightness and color of stars observed by Gaia in each portion of the sky between July 2014 and May 2016. Brighter regions indicate denser concentrations of especially bright stars, while darker regions correspond to patches of the sky where fewer bright stars are observed. In the middle of the image, the Galactic center appears vivid and teeming with stars.
Animation of data from ESA’s Gaia second release, which was made public on April 25, 2018.
Sprinkled across the image are also many globular and open clusters – groupings of stars held together by their mutual gravity, as well as entire galaxies beyond our own. The two bright objects in the lower right of the image are the Large and Small Magellanic Clouds, two dwarf galaxies orbiting the Milky Way.
The animation ends with a pan over the Galactic plane, the bright horizontal structure that hosts most of the stars in our home Galaxy. Darker regions across the Galactic plane correspond to foreground clouds of interstellar gas and dust, which absorb the light of stars located further away, behind the clouds. Many of these conceal stellar nurseries where new generations of stars are being born.
The two Gaia data releases, published in 2016 and 2018, have revolutionized the study of the Milky Way, enabling thousands of studies about the structure and motions of our galaxy. More releases are planned in coming years.
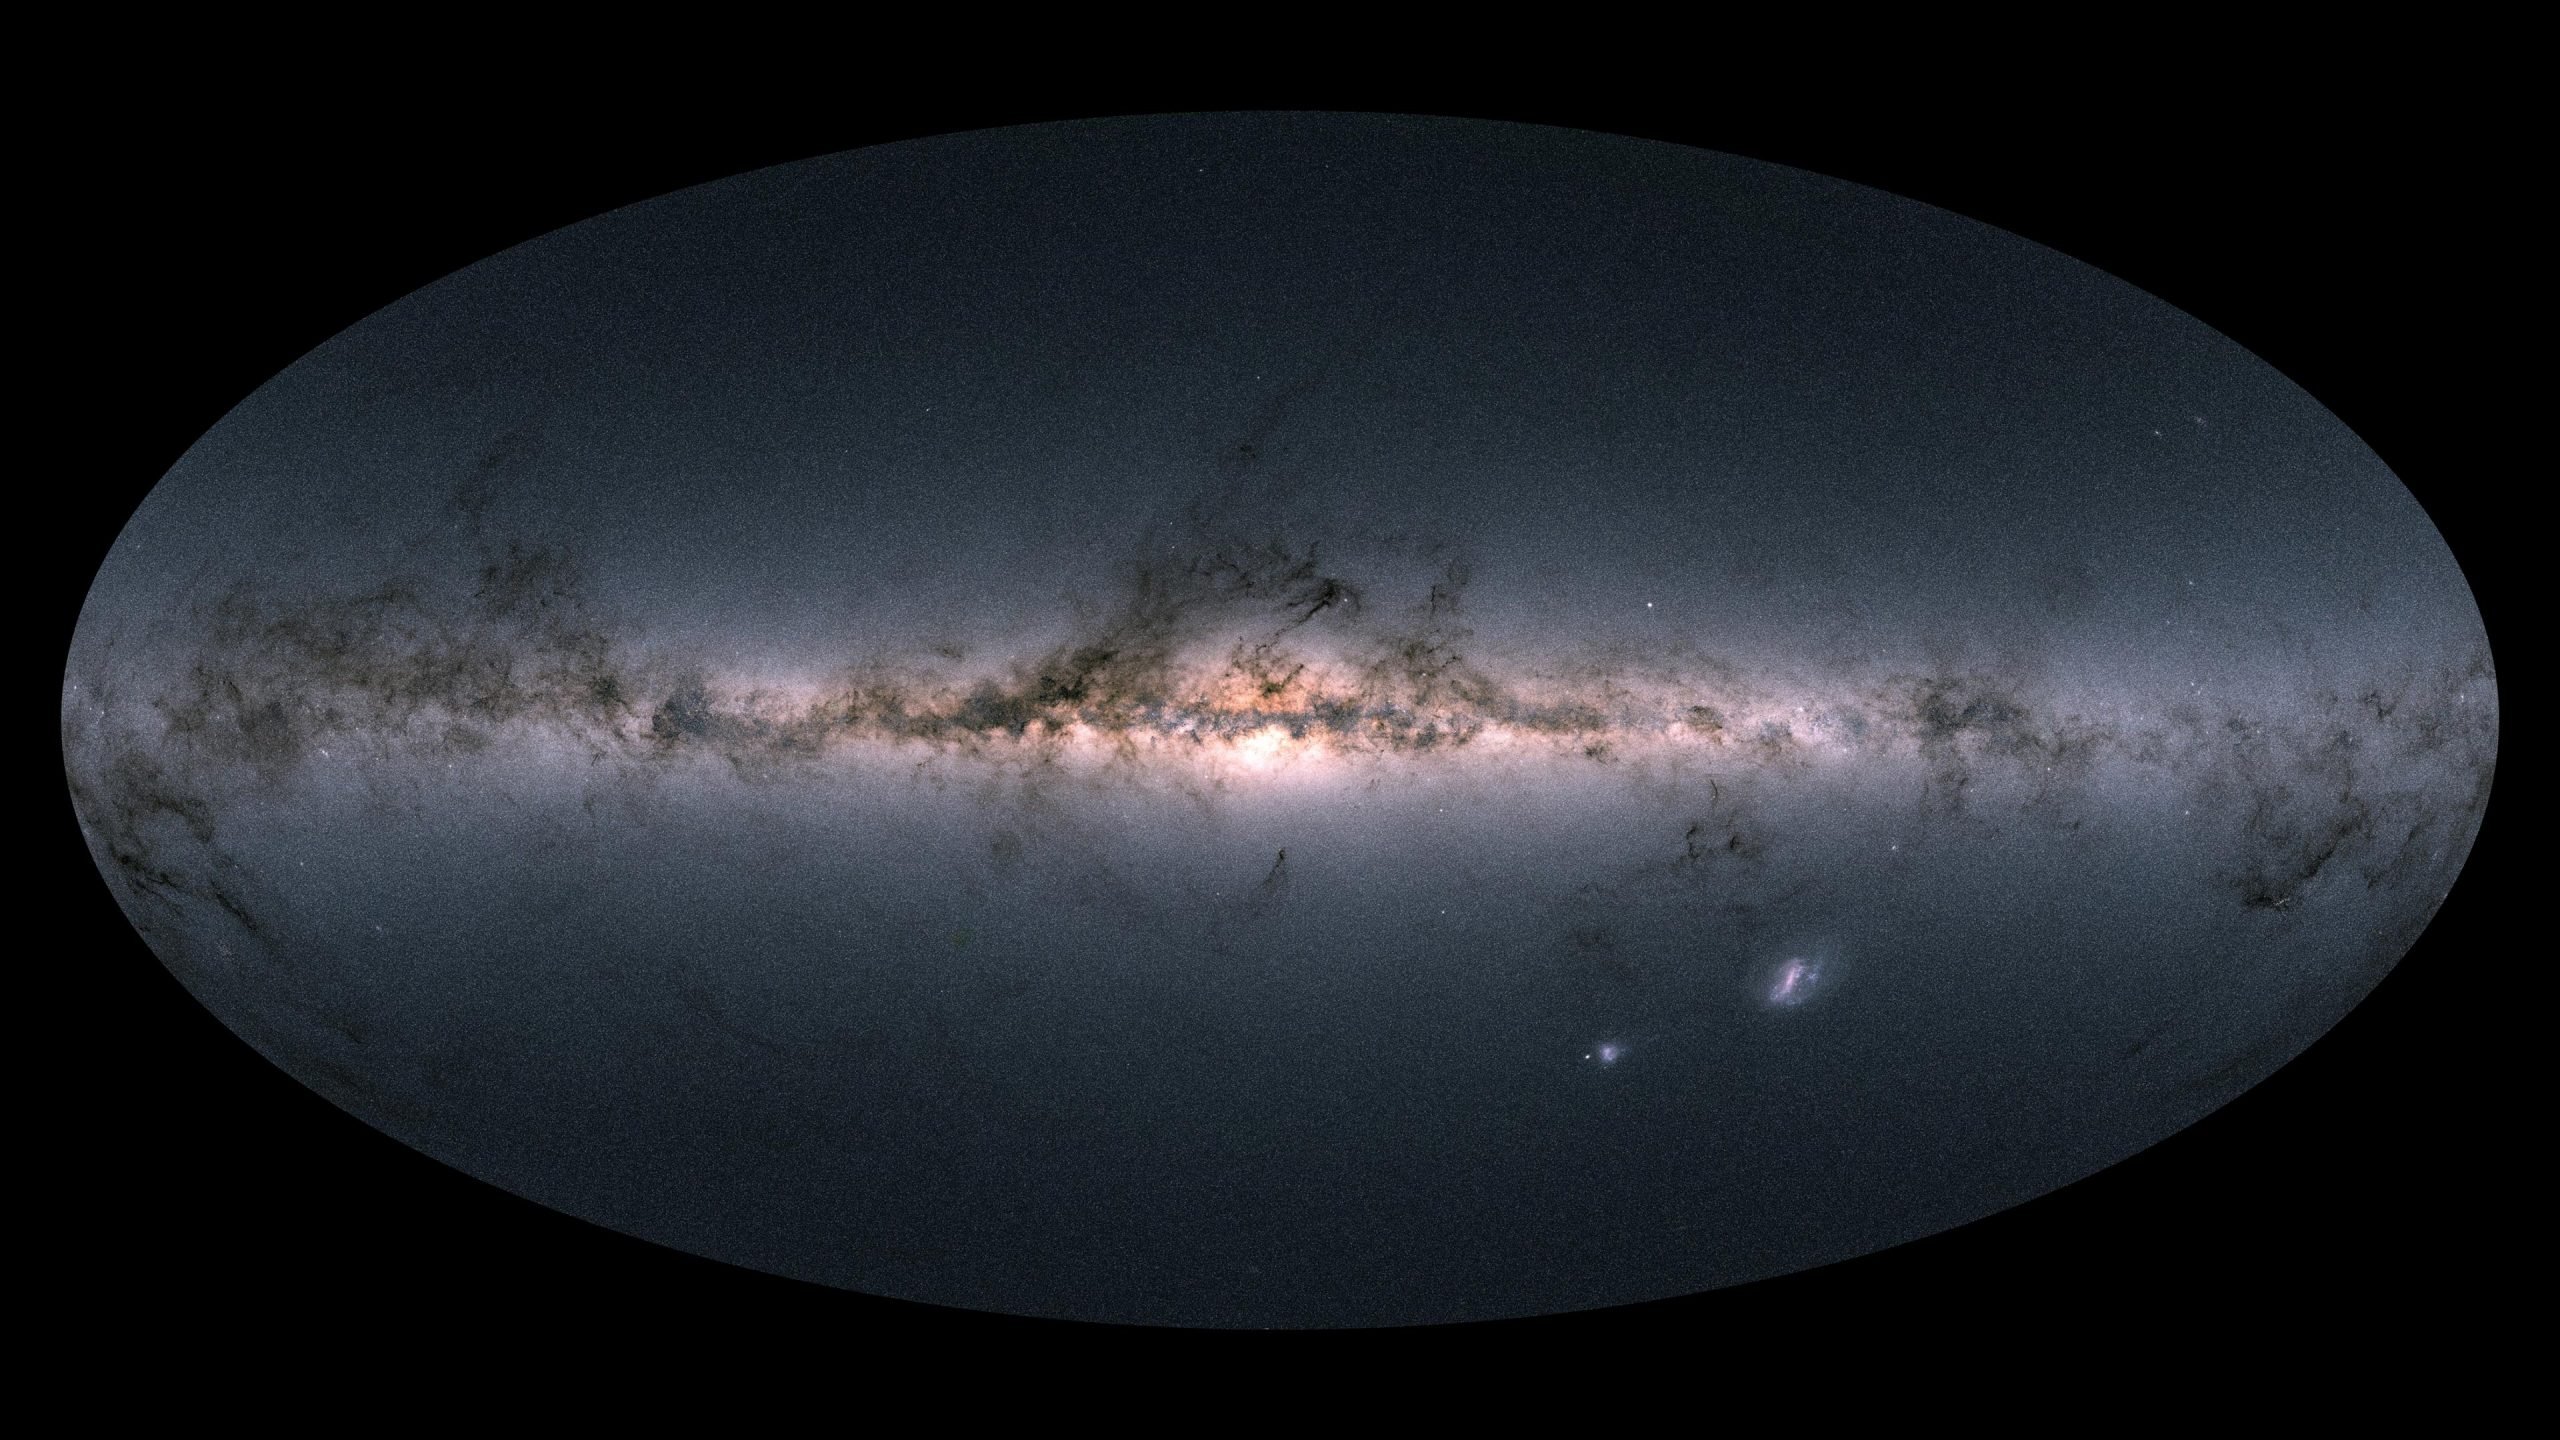
Gaia’s all-sky view of our Milky Way Galaxy and neighboring galaxies, based on measurements of nearly 1.7 billion stars. The map shows the total brightness and color of stars observed by the ESA satellite in each portion of the sky between July 2014 and May 2016. Credit: ESA/Gaia/DPAC, CC BY-SA 3.0 IGO
Data: ESA/Gaia/DPAC; Animation: ESA/ATG medialab, CC BY-SA 3.0 IGO


Be the first to comment on "Gaia Satellite Scans the Sky to Measure Positions and Motions of 1.7 Billion Stars [Video]"