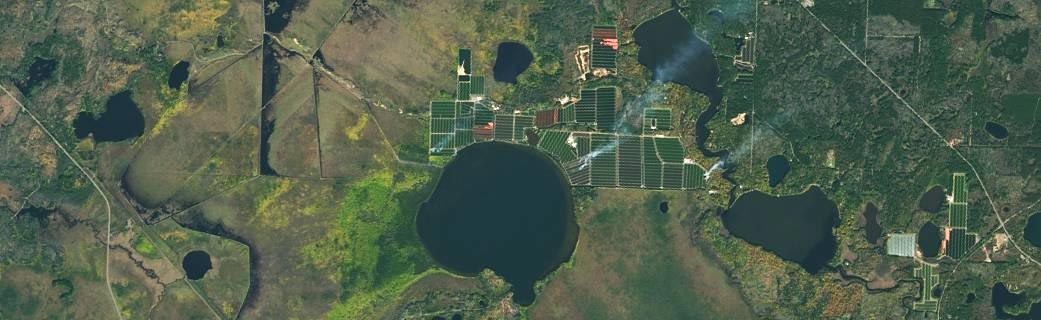
View of cranberry bogs above Little Trout Lake in northern Wisconsin on October 18, 2018, from NASA-USGS Landsat 8 data. Some of the cranberries have turned bright red and are ready for harvesting. Credit: NASA
Farmers across the Midwest are in a race to finish harvesting their corn, soybean, and other staples of the Thanksgiving dinner table before the first crop-killing freeze sets in. September rains made a late harvest even later. Heavy spring rains flooded millions of acres of cropland around the Mississippi, Wisconsin, and Missouri rivers. Some farmers never seeded; others started three weeks behind schedule.
These changes and delays in farmers’ plans this year made the United States Department of Agriculture’s job of tracking and estimating crop production with farmer surveys and ground observations a challenge. To meet it, they turned to the joint NASA — U.S. Geological Survey’s Landsat 8 satellite to fill in the missing pieces.
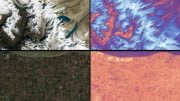
Since 2008, the USDA’s National Agricultural Statistics Service, or NASS, has drawn on Landsat data to monitor dozens of crops in the lower 48 states as part of NASS’s Cropland Data Layer program. Credit: NASA/ Matthew R. Radcliff
“During abnormal growing seasons or natural disasters, satellites shine,” said Rick Mueller, Head of USDA’s National Agricultural Statistics Service, or NASS Spatial Analysis Research Section, and manager of the Cropland Data Layer Program in Washington. “Landsat is a robust and independent way to validate what our statistics are telling us.”
Since 2009, NASS has drawn on Landsat data to monitor dozens of crops, including corn, wheat, soy, and cotton in the lower 48 states as part of NASS’s Cropland Data Layer program.
The Cropland Data layer uses Landsat and similar sensors to identify what is growing where. Separately, NASS uses NASA’s Moderate Resolution Imaging Spectroradiometer (MODIS) instruments aboard the Aqua and Terra satellites to monitor daily vegetation health and growth stage, all indicators of crop yield.
“Landsat has been one of the only ways we can directly measure the global food supply,” said Brad Doorn, program manager for NASA’s Applied Sciences Water Resources and Agriculture Research at NASA Headquarters in Washington.
However, “It’s not all satellites,” Mueller said.
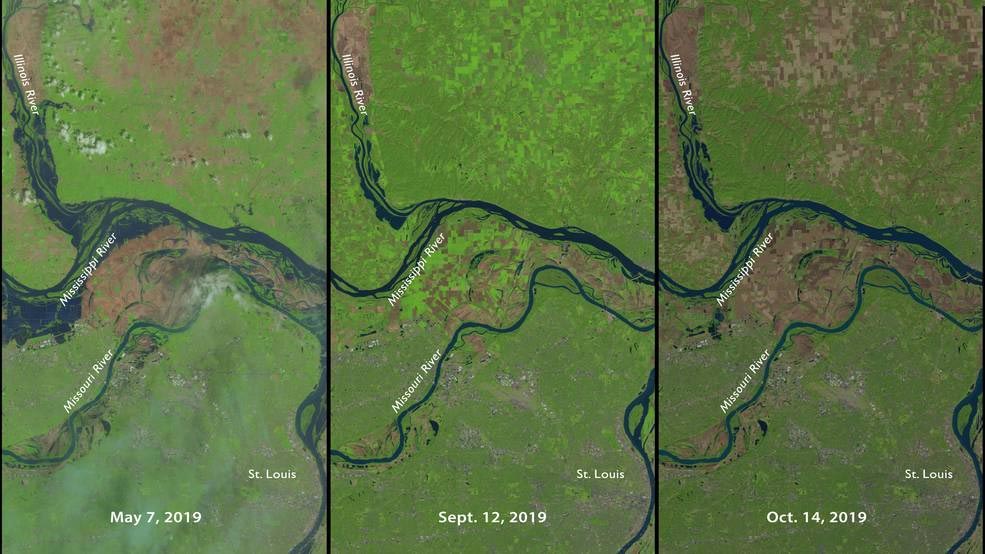
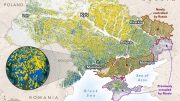
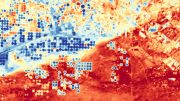
Three moments in a tumultuous year for farming north of St. Louis, MO, as seen in NASA-USGS Landsat 8 data. On the left is May 7, 2019, as heavy rains delayed planting for many farms. Sept 12, 2019, in the middle, shows bright green signifying growing vegetation, although with a fair amount of brown, bare fields. On the right, October 14, 2019, the light brown indicates harvested fields while darker brown are fields that have not been seeded or fallow all summer. Credit: NASA
During a typical farming year, NASS relies heavily on their ground observations and survey data. Across the country, NASS field officials visit farms, and measure acreage and condition of planted fields throughout the growing season. NASS also receives crop acreage data from the Farm Service Agency (FSA). Farmers are required to self-report crop acreage and land use information to FSA annually. FSA uses the data to determine payment for federal programs such as crop loss due to natural disasters or financial loss from changes in market prices.
This year was not a typical year. Farmers usually start planting corn, soybean, and other crops in May. In Missouri, with 10 percent of the state’s cropland underwater, satellite imagery helped NASS state officials see what fields and areas were most impacted by the floods. They also could see which fields had crops.
“Satellites helped us fill in the gaps and show what is going on in every region of the state,” said Robert Garino, Missouri State Statistician with the USDA. “The surveys work well at providing estimates for the state as a whole but are not designed to capture what is happening in specific regions within the state.”
In June, several farmers could not report the number of acres seeded to Garino’s office. They were waiting for their fields to dry. In July, the USDA used satellite data to help them revise June production estimates.
The following month, news stories reported that farmers had doubts about USDA August yield reports. “There was a lot of concern over their accuracy,” said Garino. “The general feeling was that the rain and flooding would cause both a reduction of harvested acreage and a fairly sharp reduction in yield. While harvested acres, especially for soybeans, were significantly reduced, August yield estimates have held up well.”
NASS will publish the final Cropland Data layer in January 2020 and makes the data available to everyone through the CropScape website. Disaster managers use the site’s historic data to evaluate crop damage from this year’s floods and other natural disasters. Resource managers use historic data to direct crop rotation, study land-use change, and monitor water use.
New satellites and new data partnerships are helping NASS improve its real-time crop monitoring capability. Currently, computer models use the Cropland Data Layer to calculate monthly yield estimates for corn and soybeans.
In addition to Landsat 8, launched in 2013, partnerships between the USGS and the European Copernicus constellation provide even more Landsat-like imagery for free.
“The more satellites, the better we feel,” said Rick Mueller, head of NASS’ Spatial Analysis Research Section and manager of the Cropland Data Layer Program in Washington.

Be the first to comment on "How Satellites Track Status of Nation’s Food Supply and Help Farmers"