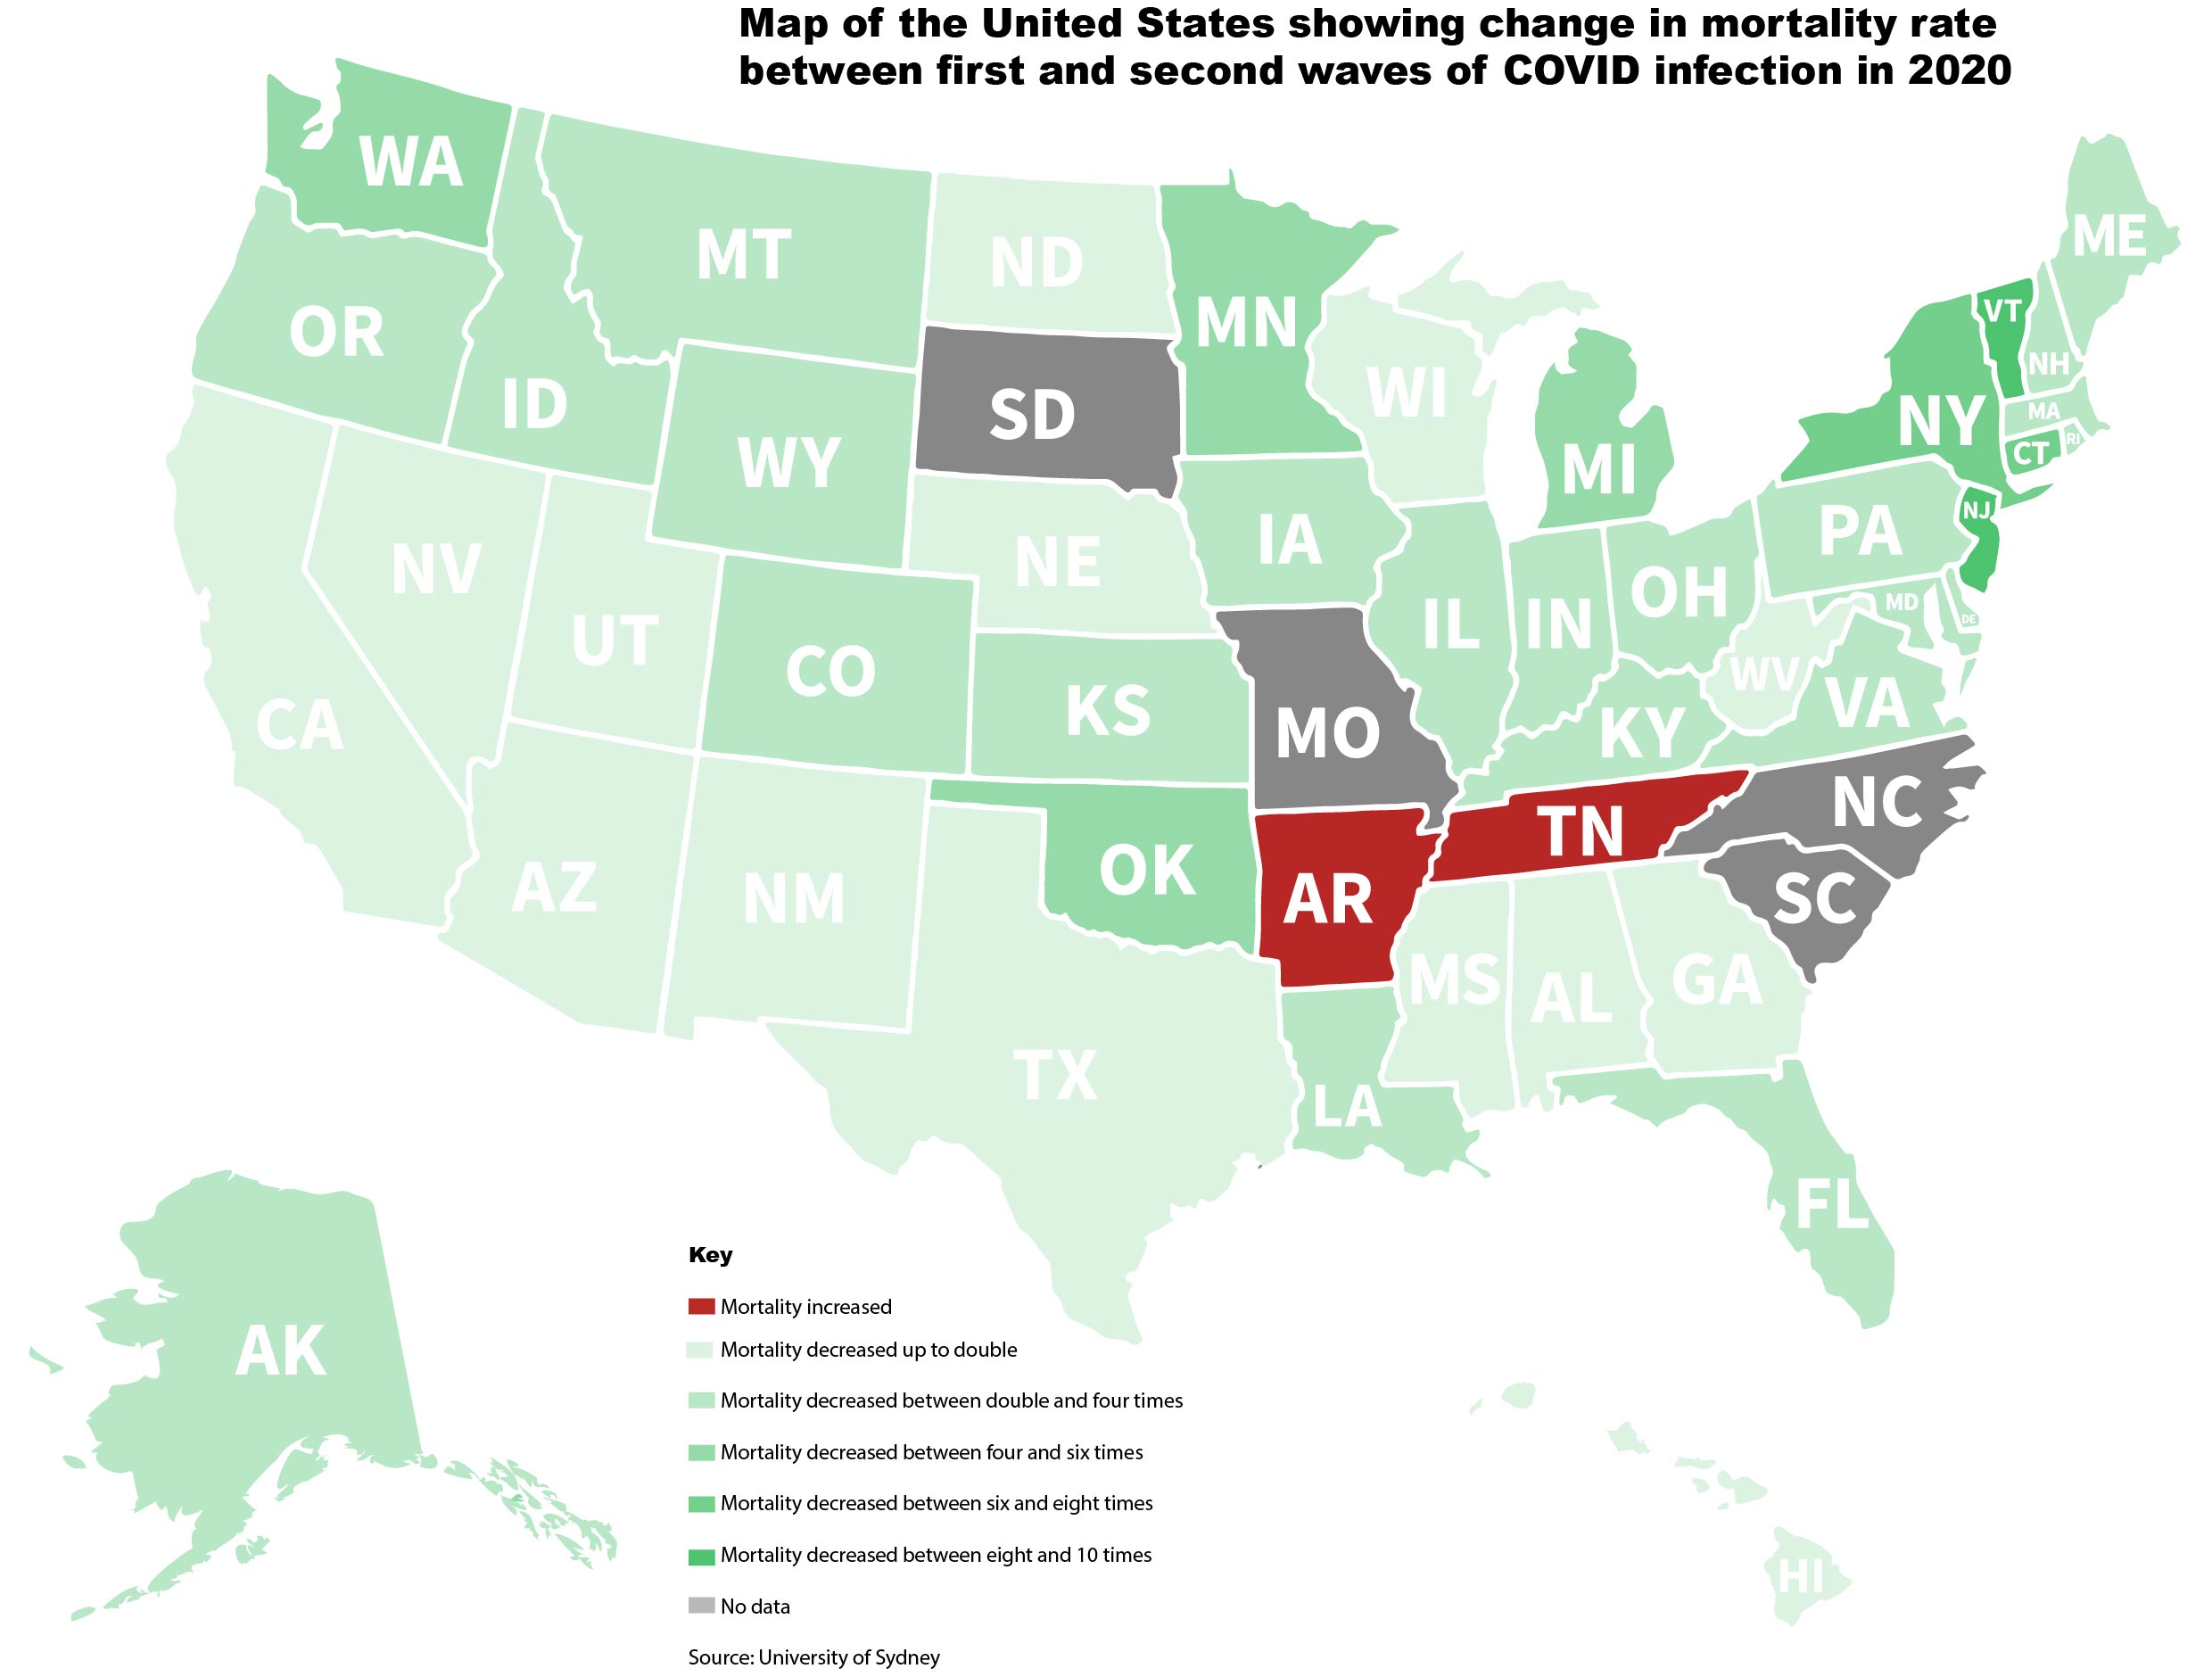
A map representation of research data showing how mortality rates changed by state in the USA from first wave to second wave COVID-19 infection periods. Credit: The University of Sydney
Mathematical analysis of Europe and US deaths shows change from first wave.
Wealthier northeastern US states and Western European countries tended to have significantly lower mortality rates during second-wave COVID-19 infections, new research from the University of Sydney and Tsinghua University has shown. However, the pattern was not as general as expected, with notable exceptions to this trend in Sweden and Germany.
Researchers say mortality change could have several explanations:
- European first-wave case counts were underestimated;
- First-wave deaths disproportionately affected the elderly;
- Second-wave infections tended to affect younger people;
- With some exceptions, lower mortality rates occurred in countries with more socialized and equitable health systems.
The researchers, Nick James, Max Menzies, and Peter Radchenko, believe their new methodology could assist epidemiologists to analyze data consistently to assess the impact of COVID-19 mortality across populations.
“We have been able to look at the mortality rates in a more dynamic way,” said Mr. James from the University of Sydney.
They have published their results today (March 16, 2021) in the mathematical journal Chaos.
“We take a time series of infection rates by country, apply an algorithmic approach to chop it up into first and later waves and then do some relatively simple optimization and calculations to determine two different mortality numbers,” said Nick James, a PhD student in the School of Mathematics & Statistics at the University of Sydney.
The mortality rate of the massive European second wave turned out to be less severe than expected: at least with respect to reported cases and deaths. The researchers wanted to know how big that drop in mortality was and how it differed between countries.

Map depiction of data showing change in mortality from COVID-19 in European countries between the first-wave and second-wave of COVID infection in 2020. Credit: The University of Sydney
“We think answering these questions is important and we wanted to answer this for all of Europe, not just the wealthier Western countries,” said Dr. Max Menzies from Tsinghua University. “In Belarus, for example, the mortality rate actually increased during its second wave, while Ukraine and Moldova were still in their first wave as of the end of November 2020.”
The researchers discovered this was very different from the Netherlands, Belgium, France, and other countries that drastically reduced their mortality rates — at least with respect to reported numbers — between their first and second waves.
The differences tended to be less marked in the United States, with a flatter outcome. However, states such as New York, New Jersey, and Connecticut, which were particularly hard hit in the first wave saw second-wave mortality rates decline in line with many western European countries.
Using a sophisticated mathematical model, each country in Europe and each state in the US was given a mortality data point for the first and second waves. Comparing these figures gives each country or state a data point, or mortality ratio.
In Europe, only Belarus — with a data point of 0.72 — saw a ratio below 1.0, which means that its mortality increased. In the US two states — Arkansas (0.69) and Tennessee (0.88) — had ratios below 1.0 indicating an increase in mortality.
Countries that experience a more than tenfold decrease in mortality in Europe were: Belgium (11.25), Denmark (14.28), France (13.67), the Netherlands (16.17).
“Our work shows sharp drops in mortality with respect to reported cases and deaths,” Dr. Menzies said. “However, the problem will always be what is the true number of cases in the early first wave? We may never know, but we imagine future research and analysis will try to determine it.”
When the researchers reran their analysis on estimated true cases and estimated deaths, Associate Professor Peter Radchenko, from the University of Sydney Business School, pointed out that those measures show serious limitations.
“Excess mortality can be negative relative to previous years due to fluctuations from other causes, so it’s unsuitable for measuring the true numbers of COVID-19 deaths,” Associate Professor Radchenko said. “We hope others will more closely analyze the true numbers, perhaps using more specialized data such as out of particular hospitals or regions where testing was more reliable.”
Broad similarity was also observed between Europe and the US, where northeastern states behaved similarly to wealthy Western European countries in their sharp reductions of mortality during the second wave.
Reference: “COVID-19 second wave mortality in Europe and the United States” by Nick James, Max Menzies and Peter Radchenko, 16 March 2021, Chaos.
DOI: 10.1063/5.0041569


Be the first to comment on "Huge Decrease in Second-Wave COVID Mortality in Wealthier Areas"