The scientists believe that greenhouse gases are primarily responsible for the increased temperatures.
Researchers find that human activities increase the chance of more intense heat waves.
The 19th of July was the hottest day ever recorded in the United Kingdom, with temperatures exceeding 40 degrees Celsius (about 104 degrees Fahrenheit). The heat wave is a preview of the typical summer weather that British citizens can expect in 2050, according to climate forecasters. The heat continues in Europe and the United States today, with more than a third of the nation subject to extreme temperatures.
The temperatures are reminiscent of a heat wave that killed about 1,500 people in late June of last year and more than doubled average temperatures in the US and Canada.
Will temperatures continue to climb and will intense heat events occur more frequently?
Yes, according to the most recent analysis of the atmospheric circulation patterns and emissions brought on by human activity that caused the North American heat wave in 2021. The findings, recently published in the journal Advances in Atmospheric Sciences, could also explain the U.K.’s current heat wave.
The study team discovered that greenhouse gases have been the major cause of rising temperatures in the past and will likely continue to be the key contributing factor in the future, with models indicating that severe heat wave events will rise by more than 30 percentage points in the coming years. According to their findings, greenhouse gases are primarily to blame for this increased likelihood.
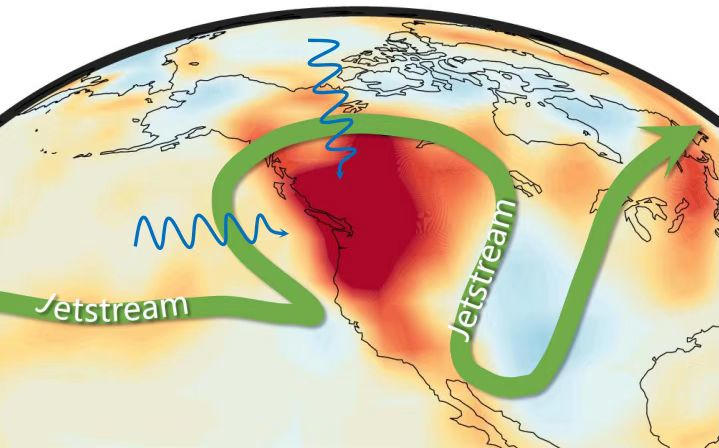
Shading represents surface air temperature anomalies, and the green vector denotes jetstream (a narrow band of very strong westerly air currents near the altitude of the tropopause). Two blue vectors indicate that the heatwave is related to anomalous circulations in the North Pacific and the Arctic. Credit: Jiayu Zheng
“An extraordinary and unprecedented heat wave swept western North America in late June of 2021, resulting in hundreds of deaths and a massive die-off of sea creatures off the coast as well as horrific wildfires,” said lead author Chunzai Wang, a researcher in the Southern Marine Science and Engineering Guangdong Laboratory and head of the State Key Laboratory of Tropical Oceanography at the South China Sea Institute of Oceanology, Chinese Academy of Sciences (CAS).
“In this paper, we studied the physical processes of internal variabilities, such as atmospheric circulation patterns, and external forcing, such as anthropogenic greenhouse gases.”
Atmospheric circulation patterns describe how air flows and impacts surface air temperatures across the world, both of which may fluctuate due to natural warming from the Sun, atmospheric internal variability, and the rotation of the Earth. These configurations are responsible for both everyday weather and the long-term trends that comprise climate. The researchers used observational data to identify three atmospheric circulation patterns that co-occurred during the 2021 heat wave: the North Pacific pattern, the Arctic-Pacific Canada pattern, and the North America pattern.
“The North Pacific pattern and the Arctic-Pacific Canada pattern co-occurred with the development and mature phases of the heat wave, whereas the North America pattern coincided with the decaying and eastward movements of the heat wave,” Wang said. “This suggests the heat wave originated from the North Pacific and the Arctic, while the North America pattern ushered the heat wave out.”
However, atmospheric circulation patterns could co-occur – and have in the past – without causing an extreme heat wave, so how much of the 2021 event was influenced by human activity? Wang and his colleagues employed the World Climate Research Programme’s internationally curated, tested, and assessed models, particularly the Detection Attribution Model Comparison models of the Coupled Model Intercomparison Project Phase 6 (CMIP6).
“From the CMIP6 models, we found that it is likely that global warming associated with greenhouse gases influences these three atmospheric circulation pattern variabilities, which, in turn, led to a more extreme heat wave event,” Wang said. “If appropriate measures are not taken, the occurrence probability of extreme heat waves will increase and further impact the ecological balance, as well as sustainable social and economic development.”
Reference: “Unprecedented Heatwave in Western North America during Late June of 2021: Roles of Atmospheric Circulation and Global Warming” by Chunzai Wang, Jiayu Zheng, Wei Lin and Yuqing Wang, 22 July 2022, Advances in Atmospheric Sciences.
DOI: 10.1007/s00376-022-2078-2


… is it going to be like a Danna Paola hot in XT4S1S ???
“… and more than doubled average temperatures in the US and Canada.”
This claim makes no sense in any temperature scale.
CMIP6 is running hotter than previous models, which were known to run warm. Any predictions based on CMIP6 is suspect if they can’t get the temperatures right and predict a tropical, stratospheric hot-spot that can’t be verified.
THE FEYNMAN LECTURES ON PHYSICS available online at caltech.edu , volume 1, chapter 7, “gravitation”, clearly show that we lose 1/20th of an inch per second in our mean orbital distance from the sun. That is , three inches every minute, night and day from here on out. It will only get hotter and hotter here on earth. Nothing man can do has caused or will change this. It is the real truth behind global warming.
I’m afraid that you misunderstood, or are purposely misrepresenting what Feynman said. He was talking about the rate of fall of the MOON, not Earth, and was NOT talking about the length of the major axis of the elliptical orbit.
“We can calculate from the radius of the moon’s orbit (which is about 240,000 miles) and how long it takes to go around the earth (approximately 29 days), how far the moon moves in its orbit in 1 second, and can then calculate how far it falls in one second. [That is, how far the circle of the moon’s orbit falls below the straight line tangent to it at the point where the moon was one second before.] This distance turns out to be roughly 1/20 of an inch in a second.”
Your claim is false, based on the reference you provided.
The earth is not moving 100 miles closer to the sun every four years.