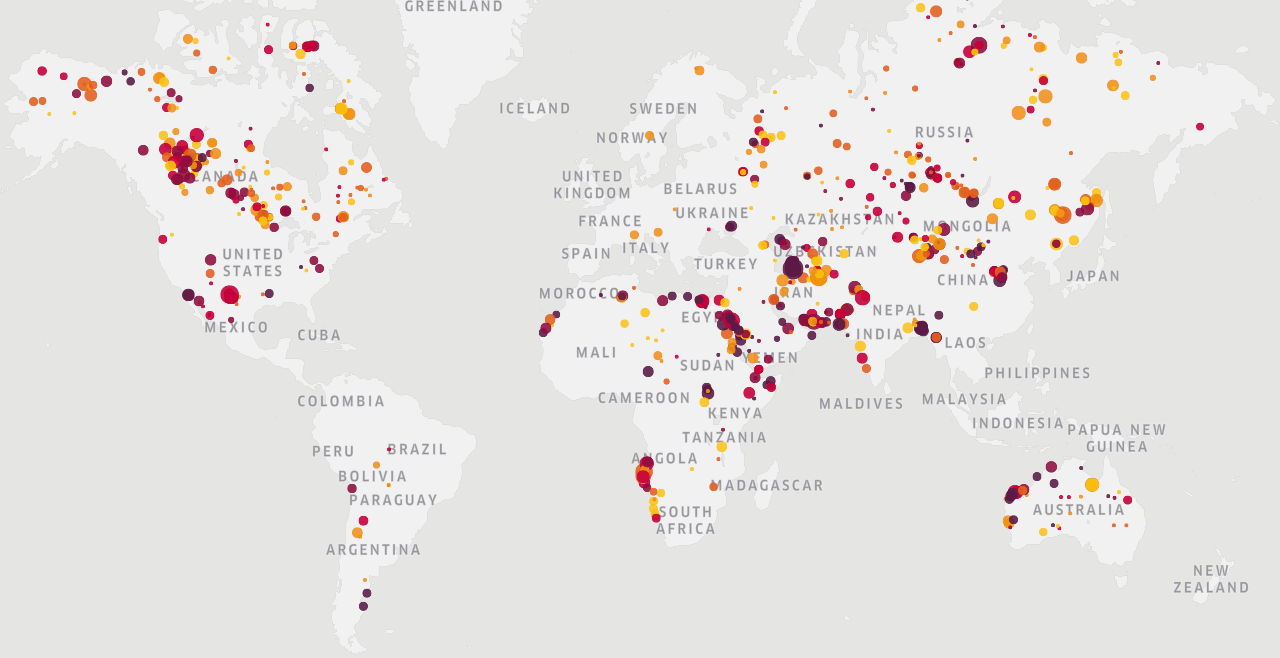
This image shows a sample of abnormal methane concentrations over 2019. The size and color of the circles indicate the size and intensity of the plume detected. The redder the color, the higher the concentration of the methane plume. Credit: Contains modified Copernicus Sentinel data (2019), processed by Kayrros
An important new tool to combat climate change is now available. Using data from the Copernicus Sentinel-5P satellite, this new technology makes it possible to track and attribute methane emissions around the world.
Methane is the second most important greenhouse gas and its concentration in the atmosphere is currently increasing at a rate of around 1% per year. It effectively absorbs heat from the sun, more so than carbon dioxide, and contributes significantly to the warming of the atmosphere. As a result, there is a growing demand to track and regulate methane emissions.
Scientists from Kayrros, a European technology start-up, have recently developed a platform to monitor methane emissions on a global scale. Their findings come from a technology that leverages Copernicus Sentinel-5P data along with additional information from a range of other sources – such as ground sensor data, position tracking, and social media data.

The Permian Basin: wind direction. Credit: Kayrros
In addition to these, supplementary data from the Copernicus Sentinel-1 and Sentinel-2 missions were also used, resulting in the ability to pinpoint the location, potency, and size of methane leaks around the world.
Their studies show that there are around 100 high-volume-emitting methane leaks at any one time around the world. Around 50% of these emissions come from regions with activities in oil and gas, coal mining, and other heavy industries.
The sequence of four images featured here show the detection of a methane plume over the Permian Basin in the US.
Jean Bastin, Product Manager at Kayrros, explains, “Over one year, those 100 leaks are releasing 20 megatonnes of methane, with around half of those attributable to the oil and gas sector and other heavy industries. This means that this sector emits an amount of methane that is equivalent to the yearly carbon dioxide emissions of both Germany and France combined.”

The Permian Basin: oil and gas wells. Credit: Kayrros
The International Energy Agency’s recent Methane Tracker underlined the importance of satellite data for precise detection data. Prior to this technology, engineering estimates remained the basis of most benchmarks on methane levels. This new ability to provide real-time detection of methane will profoundly change the direction of climate policy, and the benefits of the new technology are multiple.
ESA’s Director of Earth Observation Programmes, Josef Aschbacher, says “In the public sector, the use of observed data on methane emissions instead of untested assumptions on methane intensity, will improve the accuracy of annual inventories of greenhouse emissions.
“For governments and regulators, this technology will enable better decisions on energy policy if they can establish a baseline for methane emissions and monitor changes in carbon intensity as they happen.”
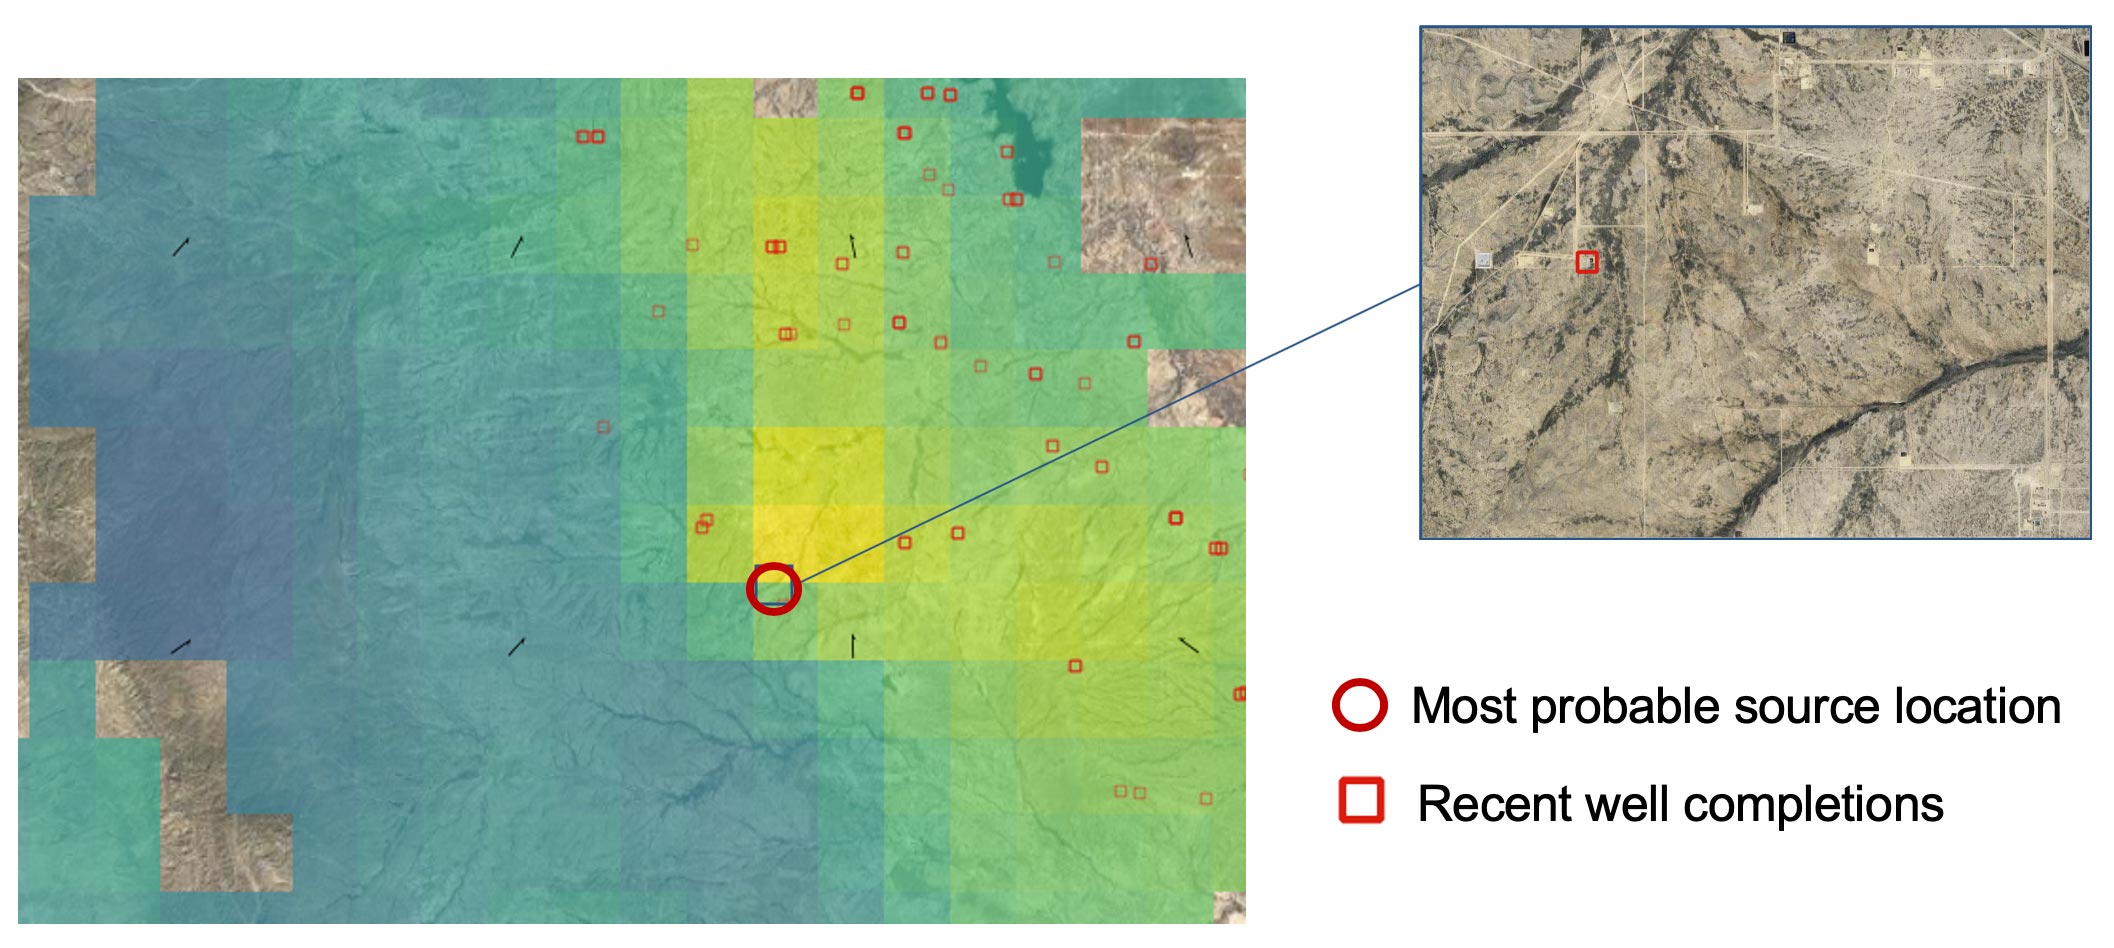
The Permian Basin: recent well completions. Credit: Kayrros
In the oil and gas industry, companies that are proactive in the measurement of methane emissions, and tackling their causes, are likely to be rewarded by the market with a deeper investor base, a lower cost of capital, higher revenue and a higher share price.
The technology also provides investors with independent verification of a company’s footprint and facilitates engagement on a mitigation strategy in collaboration with the management team. Investors will also now be able to measure the methane intensity of energy producers and consumers for screening purposes.
Claus Zehner, ESA’s Copernicus Sentinel-5P mission manager, says, “As with carbon dioxide, human activities are increasing the methane concentration in the atmosphere faster than it can be offset by natural sinks. Effective global monitoring of methane emissions is therefore essential and Kayrros has developed a new tool for this based on the unique Copernicus Sentinel-5P methane measurements.”
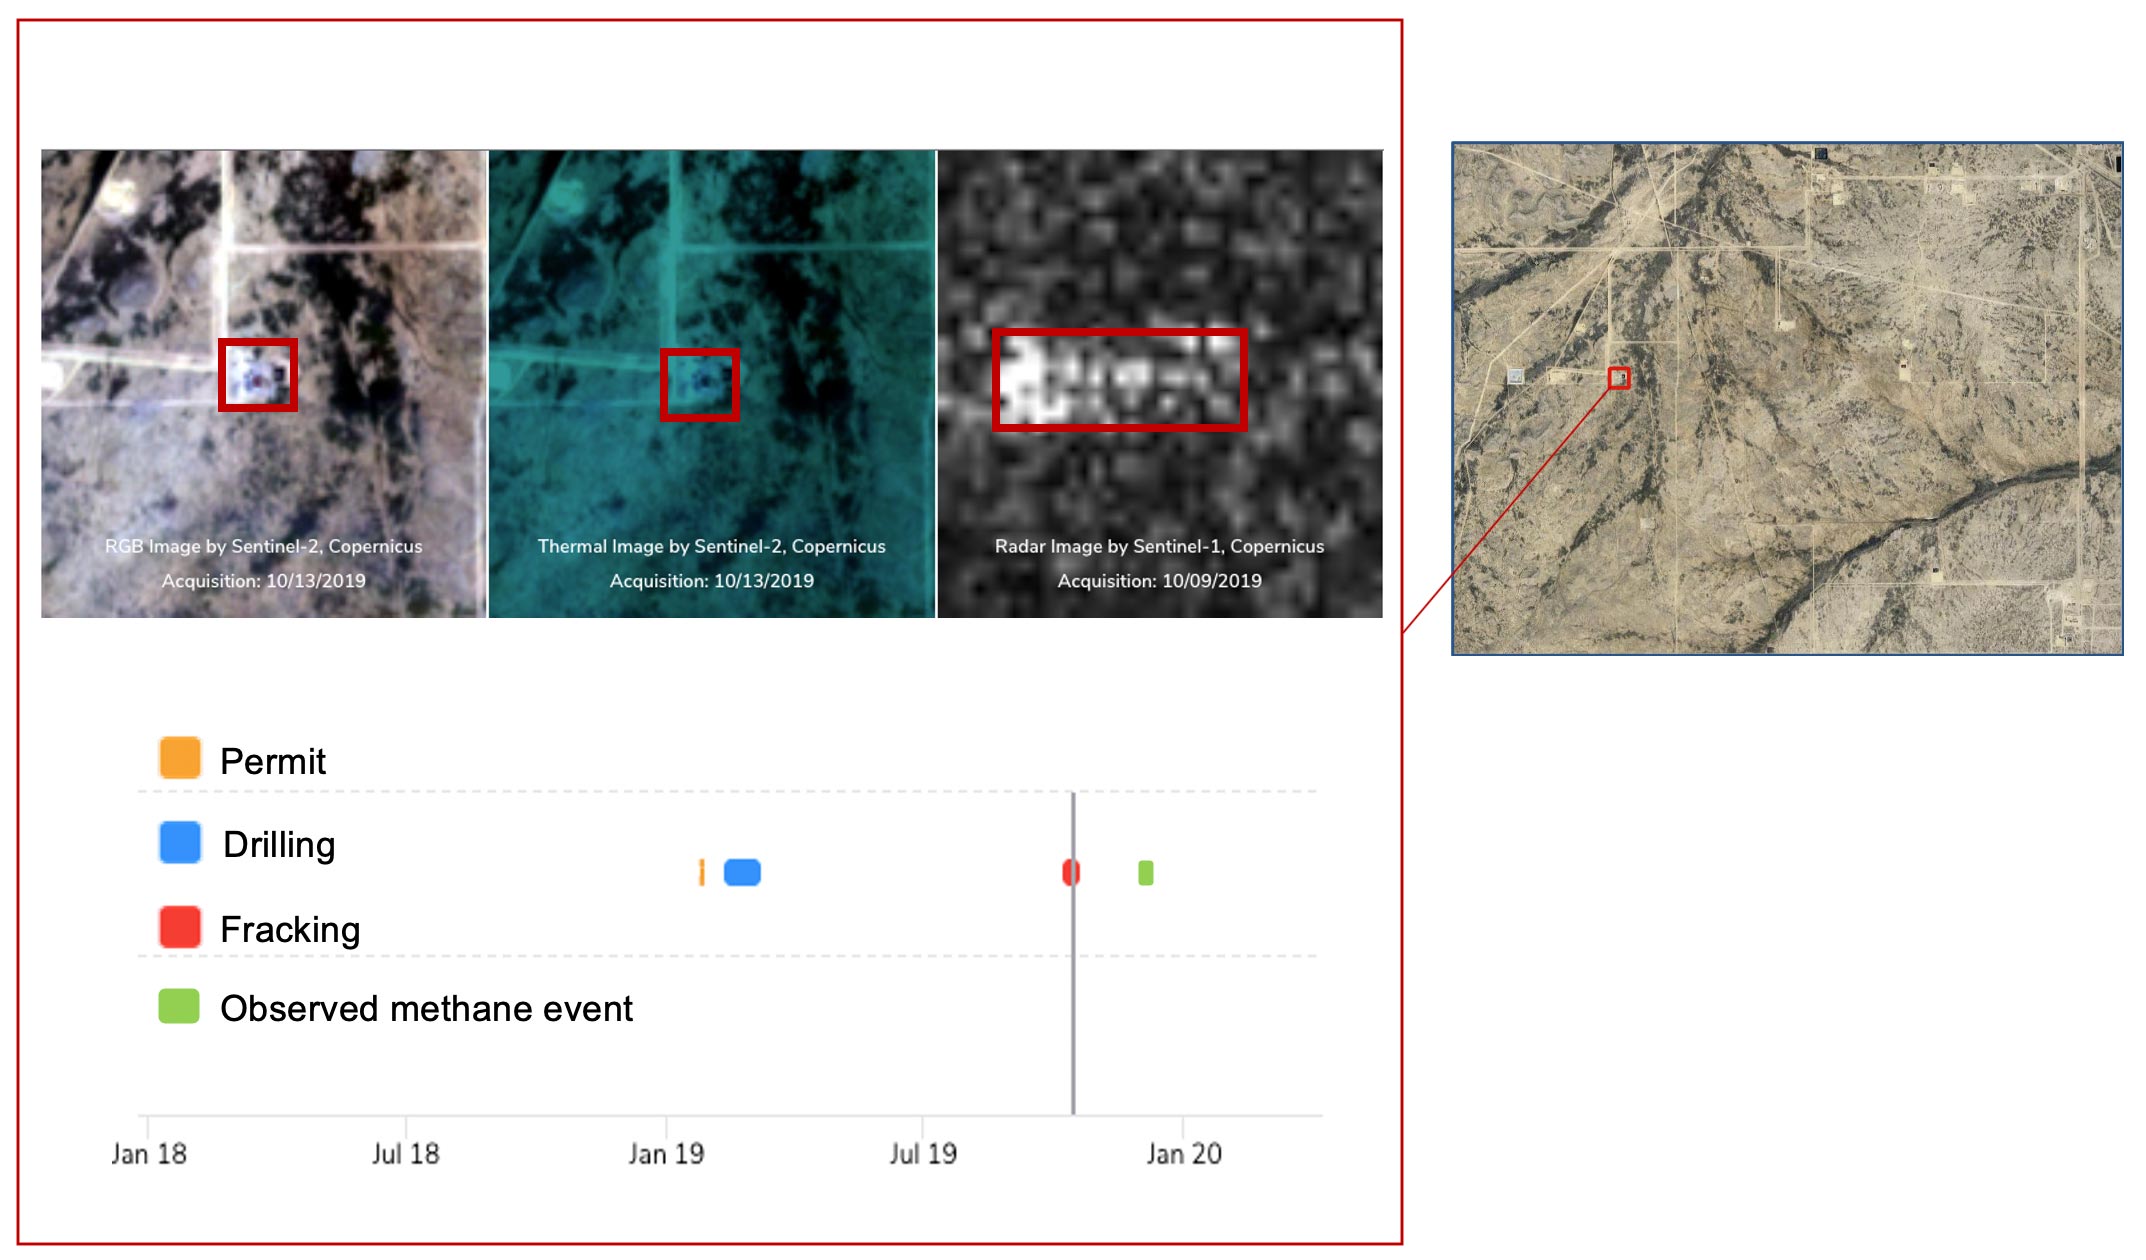
The Permian Basin: observed methane leak. Credit: Kayrros
Other European space agencies are equally engaged in supporting the development of these measurement tools. Gilles Rabin, Director of Innovation at CNES, France’s space agency, says, “It is particularly gratifying to see Kayrros, a company founded in France, to be the first to produce such detailed data on methane emissions using satellite technology.
“Even more so, it is a testament to ESA’s strategy and investment into Europe’s space observation technology. We are incredibly proud to be associated with both organizations.”
Antoine Rostand, CEO of Kayrros, says, “The combination of Copernicus Sentinel-5P satellite imagery and Kayrros technology has produced a first in the ability to attribute and track individual methane leaks. Together we are showing that Europe and ESA are pioneering new techniques in the global fight against climate change.”


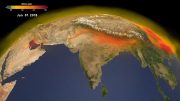


This image shows a sample of abnormal methane concentrations over 2019
Exactly what was the standard used to determine the “Normal” concentration of Methane?
Methane is the second most important greenhouse gas and its concentration in the atmosphere is currently increasing at a rate of around 1% per year.
Water vapor is #1 CO2 is #2 and Methane is a distant third.
Methane is in the atmosphere at about 1800 parts per billion (ppb), and since 1984 has been increasing at an annual rate of between 6 or 7 ppb. that comes to about 0.4% not 1%. (See NOAA’s Global Monitoring Laboratory – Methane)
It effectively absorbs heat from the sun, more so than carbon dioxide,
The Global Warming Potential (GWP) numbers that can be found in the IPCC assessment reports tell us that methane is 86 times more powerful by mass than CO2. The IPCC omits the fact that methane is in the atmosphere a little less than 2 parts per 400 compared to CO2 and even if its absorption spectrum were equal to CO2 it would only absorb 0.4% what CO2 does. In reality its absorption spectrum is a good deal less than CO2 and methane’s contribution to greenhouse gas warming of the atmosphere is essentially nothing.
Steve Case – Milwaukee, WI