For the first time, researchers have spotted short-term, regional fluctuations in atmospheric carbon dioxide (CO2) across the globe due to emissions from human activities.
Using a combination of NASA satellites and atmospheric modeling, the scientists performed a first-of-its-kind detection of human CO2 emissions changes. The new study uses data from NASA’s Orbiting Carbon Observatory-2 (OCO-2) to measure drops in CO2 emissions during the COVID-19 pandemic from space. With daily and monthly data products now available to the public, this opens new possibilities for tracking the collective effects of human activities on CO2 concentrations in near real-time.
Previous studies investigated the effects of lockdowns early in the pandemic and found that global CO2 levels dropped slightly in 2020. However, by combining OCO-2’s high-resolution data with modeling and data analysis tools from NASA’s Goddard Earth Observing System (GEOS), the team was able to narrow down which monthly changes were due to human activity and which were due to natural causes at a regional scale. This confirms previous estimates based on economic and human activity data.
The team’s measurements showed that in the Northern Hemisphere, human-generated growth in CO2 concentrations dropped from February through May 2020 and rebounded during the summer, consistent with a global emissions decrease of 3% to 13% for the year.
The results represent a leap forward for researchers studying regional effects of climate change and tracking results of mitigation strategies, the team said. The method allows detection of changes in atmospheric CO2 just a month or two after they happen, providing fast, actionable information about how human and natural emissions are evolving.
Discerning subtle changes in Earth’s atmosphere
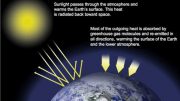
Carbon dioxide (CO2) is a greenhouse gas present in the atmosphere and its concentration changes due to natural processes like respiration from plants, exchange with the world’s oceans, and human activities like fossil fuel combustion and deforestation. Since the Industrial Revolution, the concentration of CO2 in the atmosphere has increased nearly 49%, passing 400 parts per million for the first time in human history in 2013.
When governments asked citizens to stay home early in the COVID-19 pandemic, fewer cars on the road meant steep drops in the amount of greenhouse gases and pollutants released into the atmosphere. But with CO2, a “steep drop” needs to be put in context, said Lesley Ott, a research meteorologist at NASA’s Global Modeling and Assimilation Office at Goddard Space Flight Center in Greenbelt, Maryland. This gas can last in the atmosphere for up to a century after it is released, which is why short-term changes could get lost in the overall global carbon cycle – a sequence of absorption and release that involves natural processes as well as human ones. The lockdowns of early 2020 are one small part of the total CO2 picture for the year.
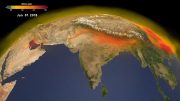
“Early in 2020, we saw fires in Australia that released CO2, we saw more uptake from plants over India, and we saw all these different influences mixed up,” Ott said. “The challenge is to try to disentangle that and understand what all the different components were.”
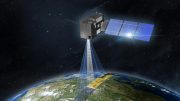
Up until recently, measuring these kinds of changes wasn’t possible with satellite technology. NASA’s OCO-2 satellite has high-precision spectrometers designed to pick up even smaller fluctuations in CO2, and combined with the comprehensive GEOS Earth system model, were a perfect fit to spot the pandemic-related changes.
“OCO-2 wasn’t designed for monitoring emissions, but it is designed to see even smaller signals than what we saw with COVID,” said lead author Brad Weir, a research scientist at Goddard and Morgan State University. Weir explained that one of the OCO-2 mission research goals was to track how human emissions shifted in response to climate policies, which are expected to produce small, gradual changes in CO2. “We hoped that this measurement system would be able to detect a huge disruption like COVID.”
The team compared the measured changes in atmospheric CO2 with independent estimates of emissions changes due to lockdowns. In addition to confirming those other estimates, the agreement between emissions models and atmospheric CO2 measurements provides strong evidence that the reductions were due to human activities.
GEOS contributed important information on wind patterns and other natural weather fluctuations affecting CO2 emission and transport. “This study really is bringing everything together to attack an enormously difficult problem,” Ott said.
Taking a closer look at greenhouse gases
The team’s results showed that growth in CO2 concentrations dropped in the Northern Hemisphere from February through May 2020 (corresponding to a global emissions decrease of 3% and 13%), which agreed with computer simulations of how activity restrictions and natural influences should affect the atmosphere.
The signal wasn’t as clear in the Southern Hemisphere, thanks to another record-breaking climate anomaly: The Indian Ocean Dipole, or IOD. The IOD is a cyclical pattern of cooler-than-normal oceans in Southeast Asia and warmer-than-normal oceans in the eastern Indian Ocean (“positive” phase) or the reverse (“negative” phase). In late 2019 and early 2020, the IOD experienced an intense positive phase, yielding a plentiful harvest season in sub-Saharan Africa and contributing to the record-setting Australian fire season. Both events strongly affected the carbon cycle and made detecting the signal of COVID lockdowns difficult, the team said – but also demonstrated GEOS/OCO-2’s potential for tracking natural CO2 fluctuations in the future.
GEOS/OCO-2 data power one of the indicators in the COVID-19 Earth Observing Dashboard, a partnership between NASA, the European Space Agency, and the Japan Aerospace Exploration Agency. The dashboard compiles global data and indicators to track how lockdowns, dramatic reductions in transportation, and other COVID-related actions are affecting Earth’s ecosystems.
The GEOS-OCO-2 assimilated product is available for free download, making it accessible to researchers and students who want to investigate further.
“Scientists can go to this dashboard and say, ‘I see something interesting in the CO2 signal; what could that be?’” said Ott. “There’s all kinds of things we haven’t gotten into in these data sets, and I think it helps people explore in a new way.”
In the future, the new assimilation and analysis method could also be used to help monitor results of climate mitigation programs and policies, especially at the community or regional level, the team said.
“Having the capability to monitor how our climate is changing, knowing this technology is ready to go, is something we’re really proud of,” Ott said.
Reference: “Regional impacts of COVID-19 on carbon dioxide detected worldwide from space” by Brad Weir, David Crisp, Christopher W. O’Dell, Sourish Basu, Abhishek Chatterjee, Jana Kolassa, Tomohiro Oda, Steven Pawson, Benjamin Poulter, Zhen Zhang, Philippe Ciais, Steven J. Davis, Zhu Liu and Lesley E. Ott, 3 November 2021, Science Advances.
DOI: 10.1126/sciadv.abf9415

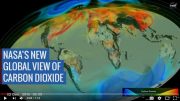

While the video clip is purported to be about evidence for a decrease in the growth rate of CO2, the first three animations are actually for ozone, which other studies have shown to have decreased.
The next animation, for the distribution of CO2, starts in December 2020 and does not speak to what happened during the year 2020. The animation following shows the change for CO2 in 2020 (@1:57). However, I don’t find it compelling for the claims.
I have manually stepped through the 2020 CO2 animation, paying particular attention to the April time frame when anthropogenic emissions supposedly saw the greatest decline. I’m unconvinced that there is evidence of an obvious correlation between CO2 declines and industrial or metropolitan areas. Instead what seems to stand out for declines is Alaska and what is probably the Ural Mountains in Russia.
The dialog claims a CO2 decline in in the Winter, and an increase in the Summer, in the northern hemisphere. This is the opposite of what is observed from Mauna Loa and other monitoring sites on the ground.
The graphs I have prepared of monthly data shows that the 2020 CO2 concentrations from Mauna Loa Observatory are indistinguishable from 2019.
https://wattsupwiththat.com/2021/06/11/contribution-of-anthropogenic-co2-emissions-to-changes-in-atmospheric-concentrations/
“Early in 2020, we saw fires in Australia that released CO2, …”
The animation does show a spike of CO2 in Australia, but there is no evidence shown that it found its way into the northern hemisphere to increase CO2 levels. The statement is really a non sequitur.
The press release is unconvincing to me as science. The modeling seems to be taking artistic license with sparse data.
I think that the CO2 spike in Australia does not coincide with the location of the fires. Perhaps someone from Oz can comment on that.
I have additionally attempted to correlate monthly anthropogenic emission fluxes in 2020 with total atmospheric CO2 fluxes. There is no support for the claim that reduced anthropogenic emissions will result in a decline in atmospheric CO2.
https://wattsupwiththat.com/2022/03/22/anthropogenic-co2-and-the-expected-results-from-eliminating-it/
what a total crock of crap.
@ Clyde Spencer
They also left out the real science of how our sun works in all of this, and how long period solar minimum cycles (200/400yrs) will make their C02 claims redundant/false.
I say climate change is nothing new at all and us humans are not all responsible for it. This New World Order plan of the elites is going to backfire hard and will be there undoing. Sickening
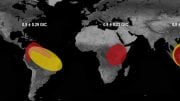
… So! Why is top more red, than the bottom which is more blue?… where is more people?…
The most people live in the middle. The ‘top’ of the image is Arctic tundra and boreal forests. While caribou are abundant locally, humans are very scarce. There is some mining done at high latitudes, but very little industry using fossil fuels. Certainly very few cars!
The blue areas are dominated by oceans and ice-covered land. There is only sparse vegetation and very little exposed soil.
“… the team was able to narrow down which monthly changes were due to human activity and which were due to natural causes at a regional scale.”
So what is the actual human component of global CO2 emissions? I have not seen a “consensus” value, only estimates that range from about 15% up to 60%. Without actually knowing this value, how can this study’s results be accepted as valid?
From the actual article, “Mixed throughout the atmosphere, a 7% reduction in annual fossil fuel emissions represents just a 0.33–part per million (ppm) change … against the global marine boundary layer background concentration of 412.22 ppm in January 2020 …, assuming that all other fluxes remain the same.”
However, The Winter-Spring ramp-up phase has a typical range of about 6-8 PPM; there is little influence from dormant photosynthesis. The anthropogenic decline for the month of April is variously estimated to as much as 18%. The monthly Mauna Loa Observatory measurements are plotted with a precision of +/- 5/1,000 PPM. The 2020 plot, with the unprecedented anthropogenic decline, shows no influence of the decline. It is indistinguishable from the 2019 plot.
I think that there is a lot of wishful thinking shown in the research article.
I take all your studies as propaganda for the democratic green party, in other words straight up Bull S***!!
I used to believe these opinions, but now l see your studies for what they are, a guess at best and lies at worst.
I’ve been around long enough to see you scientists say one thing as “fact” and then change your BS completely 100%!!
For example, you have stated that the earth had a solid core! Just recently after decades and decades you now say the earth doesn’t have a solid core!!
By playing politics with these pseudo facts of yours, you’ve lost all integrity.
Our universities have become cesspools of left wing democratic globalist party PROPAGANDA…..
CO2 is not a pollutant, why can’t people understand this.
Clyde thank you for your comments. Since I don’t have data, and I can’t really interpret graphs charts etc very well, I can only wonder.
Sounds like it could be the author heard about regional dips and isn’t correlating data properly…or might be a difference of interpretation?
But good to hear a different perspective. As a ordinary citizen sitting on the sidelines waiting to see what actually drops out all the discussions, it would be the better outcome that “global warming” doesn’t happen. But seems like it will no matter it’s our fault or not.
There is little doubt that there is some warming going on, at least short-term.
Who or what is at ‘fault’ is very important! IF humans are responsible, then we can do something about it. Although, it will be expensive and difficult. Our standard of living will decline. However, if we are NOT responsible, then the sacrifices will be for naught.
Try reading my links in my first comment. I’m not really an expert in climatology. However, if I can find things to seriously criticize in almost everything that gets published, it should give everyone pause to consider what else is wrong with the official story.
How about showing the people how these CME’s are affecting the climate on our planet.
There are forces beyond are control that is changing the weather.
But I guess if someone can make a buck pushing mam made global warming why not!