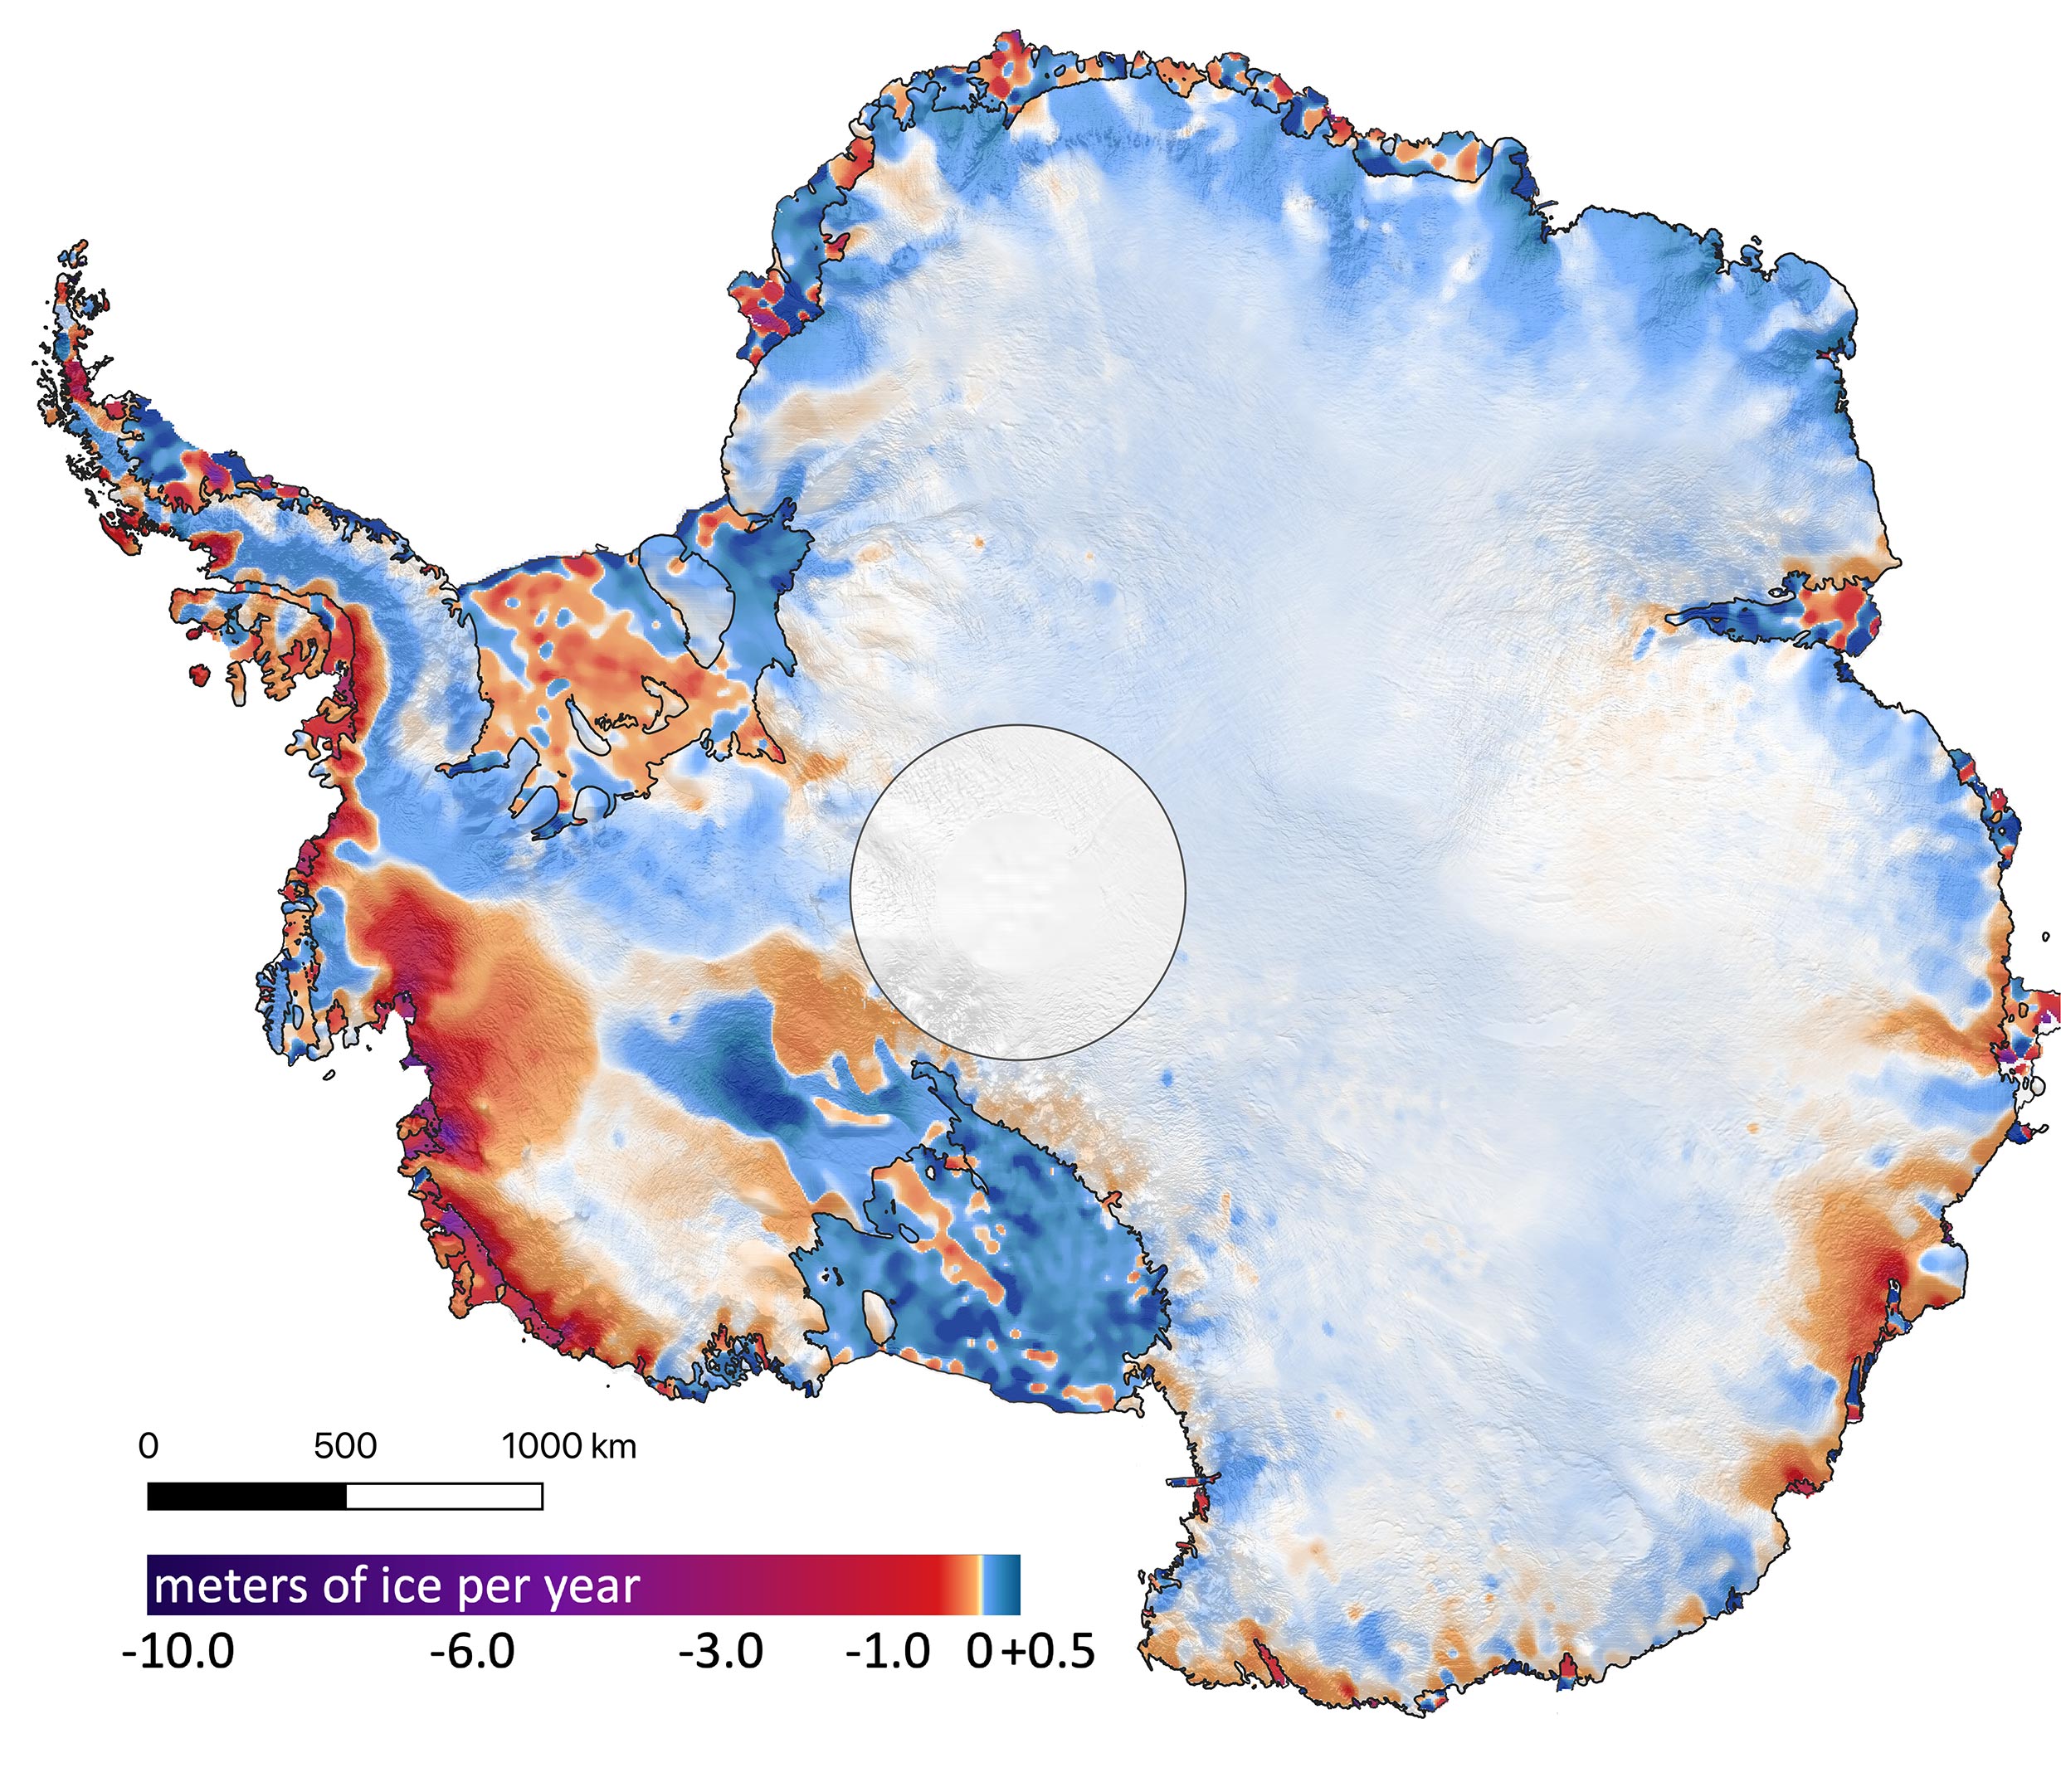
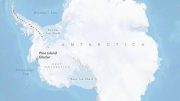
This shows the amount of ice gained or lost by Antarctica between 2003 and 2019. Dark reds and purples show large average rates of ice loss near the coasts, while blues show smaller rates of ice gain in the interior. The ice lost near the coasts, especially West Antarctica and the Antarctic Peninsula, vastly outweigh gains in the interior. Thwaites and Crosson ice shelves (seen just below the peninsula) have thinned the most. The two ice shelves have lost five meters (16 feet) and three meters (10 feet) of ice per year, respectively, between 2003 and 2019. The circle in the middle is over the South Pole where the instrument does not collect data. Credit: Smith et al./Science
Using the most advanced Earth-observing laser instrument NASA has ever flown in space, a team of scientists led by the University of Washington has made precise measurements of how the Greenland and Antarctic ice sheets have changed over 16 years.
In a new study published in the journal Science on April 30, scientists found the net loss of ice from Antarctica, along with Greenland’s shrinking ice sheet, has been responsible for 0.55 inches (14 millimeters) of sea level rise to the global ocean since 2003. In Antarctica, sea level rise is being driven by the loss of the floating ice shelves melting in a warming ocean. The ice shelves help hold back the flow of land-based ice into the ocean.
The findings come from the Ice, Cloud, and land Elevation Satellite 2 (ICESat-2), which was launched into orbit in the fall of 2018 and began taking detailed global elevation measurements, including over Earth’s frozen regions. By comparing the new data with measurements taken by the original ICESat from 2003 to 2009, researchers have generated a comprehensive portrait of the complexities of ice sheet change — and insights into the future of Greenland and Antarctica.
Climate change is reshaping ice sheets in the Arctic and Antarctic, and NASA’s ICESat and ICESat-2 satellites help researchers determine what those alterations look like.
“If you watch a glacier or ice sheet for a month, or a year, you’re not going to learn much about what the climate is doing to it,” said lead author Benjamin Smith, a glaciologist at the University of Washington. “We now have a 16-year span between ICESat and ICESat-2 and can be much more confident that the changes we’re seeing in the ice have to do with the long-term changes in the climate. And ICESat-2 is a really remarkable tool for making these measurements. We’re seeing high-quality measurements that carpet both ice sheets, which let us make a detailed and precise comparison with the ICESat data.”
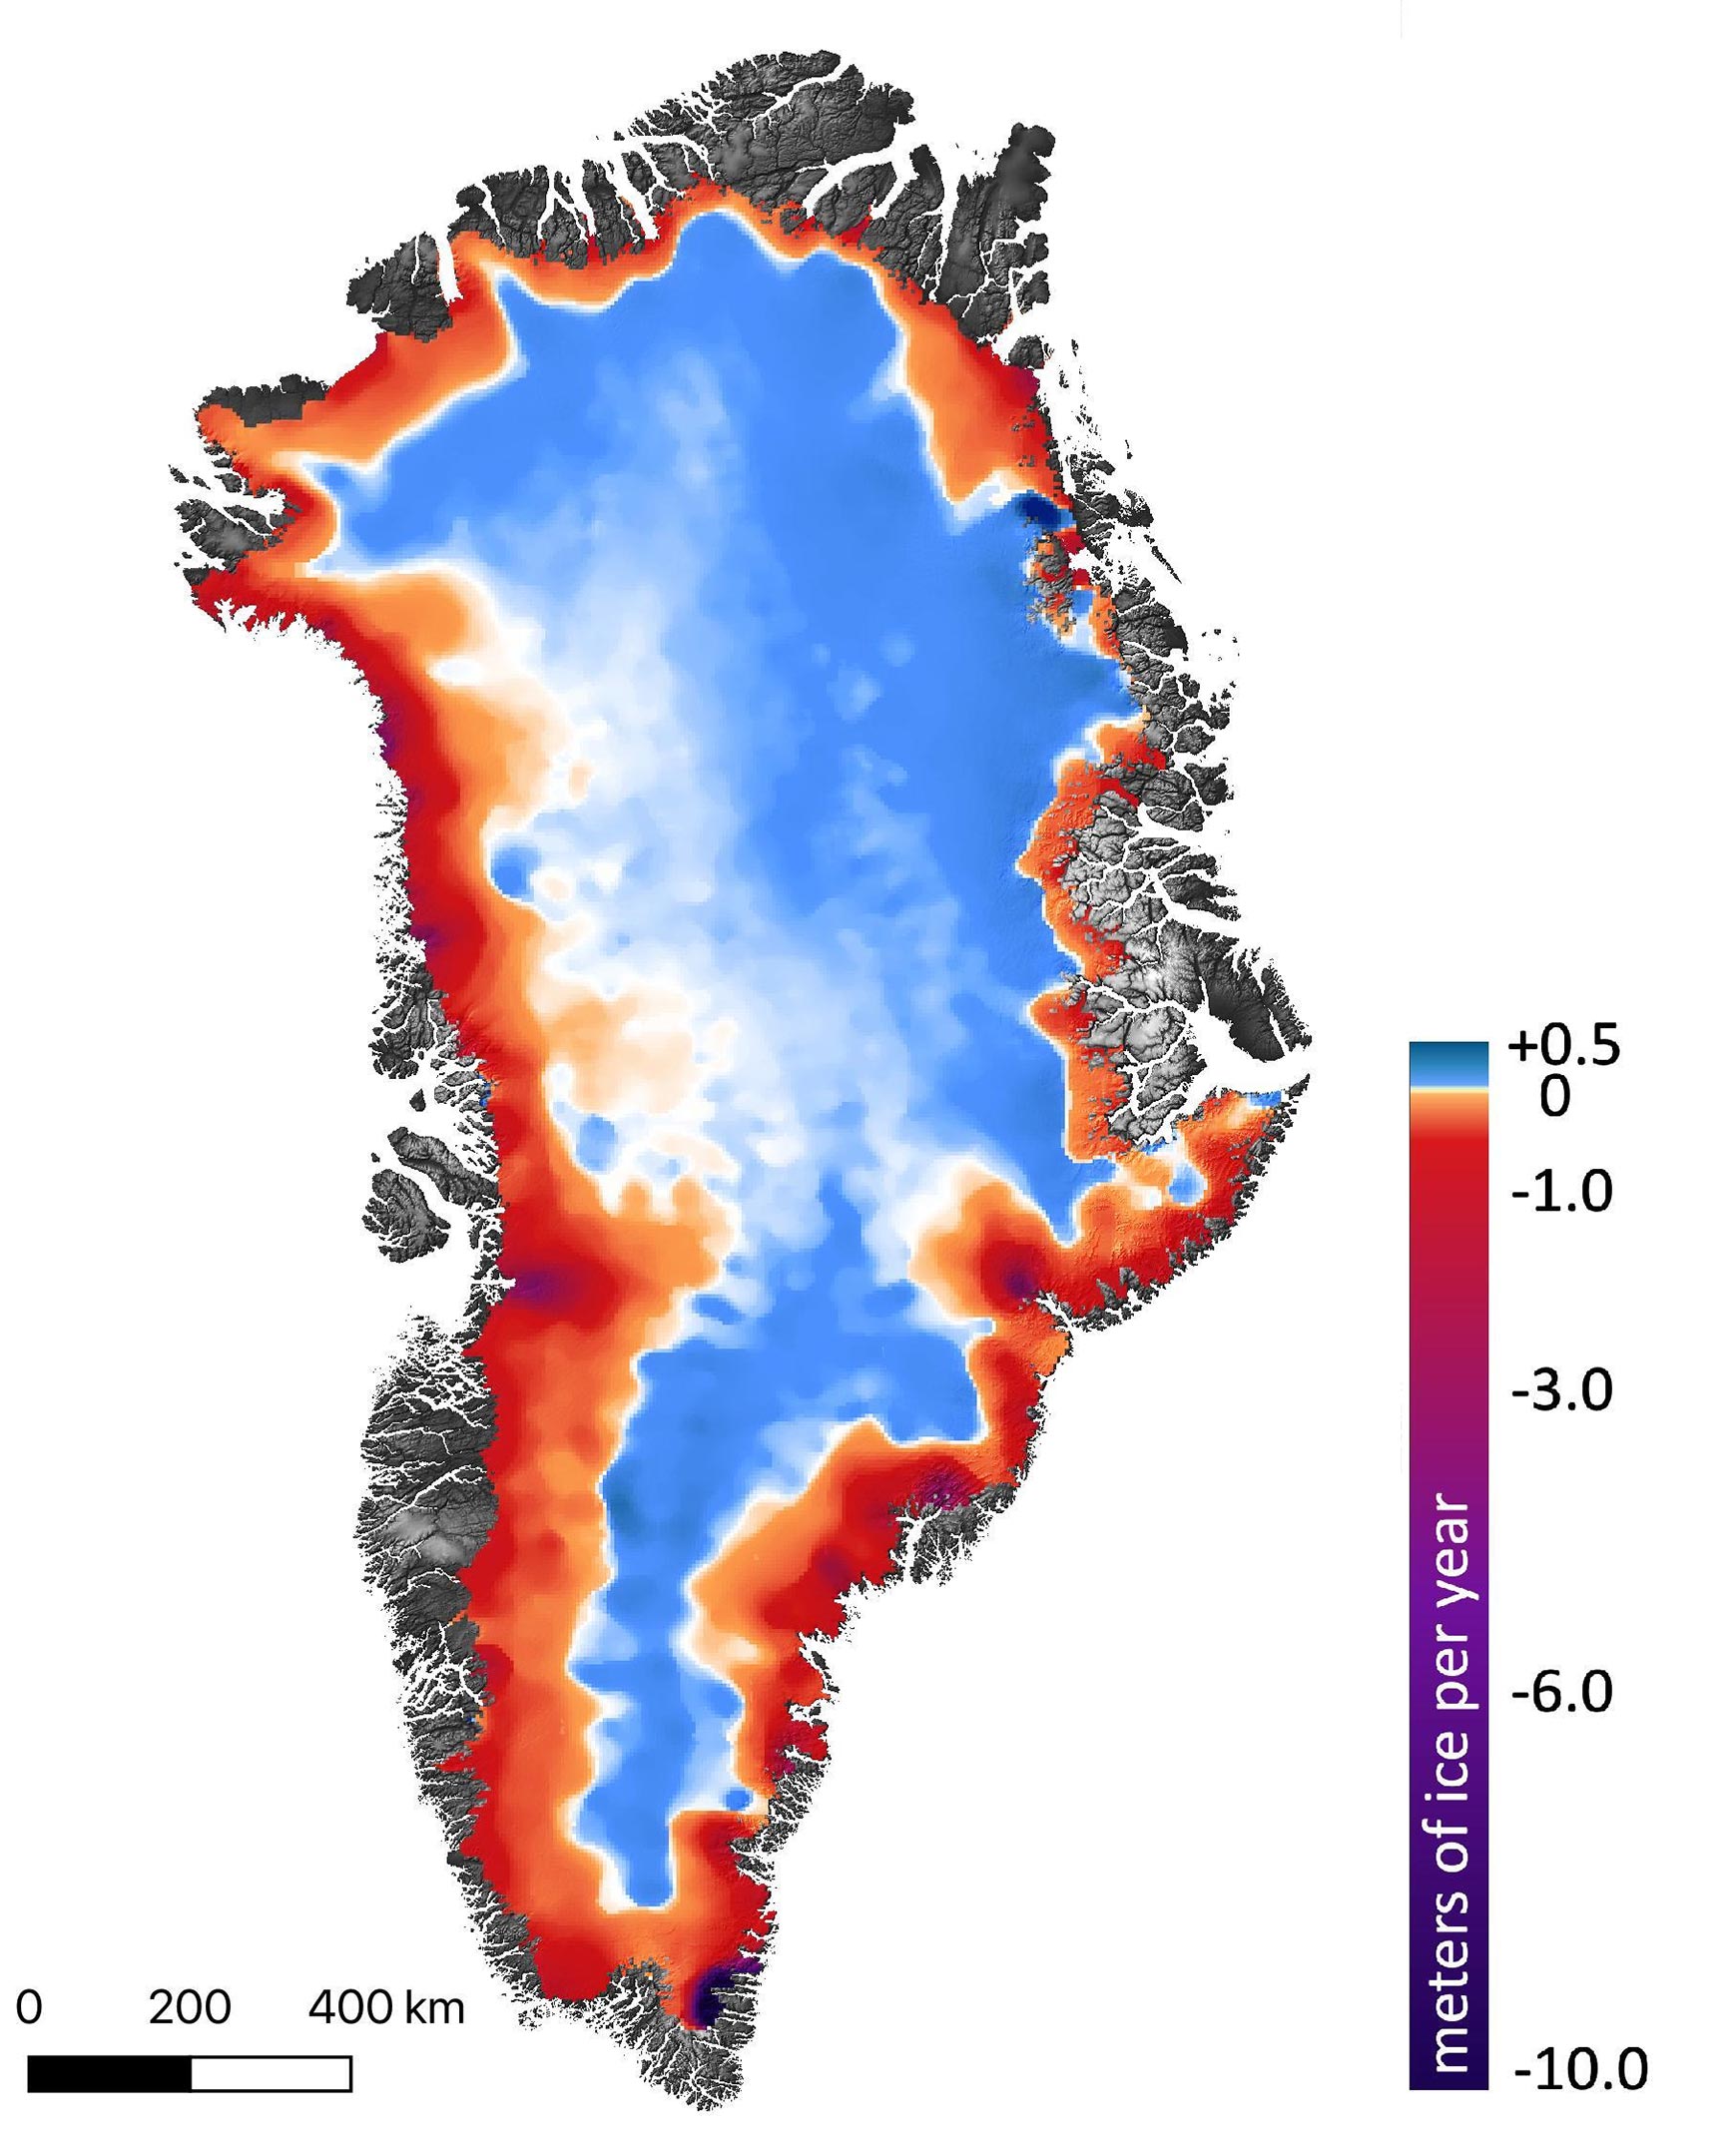
This shows the amount of ice gained or lost by Greenland between 2003 and 2019. Dark reds and purples show large rates of ice loss near the coasts. Blues show smaller rates of ice gain in the interior of the ice sheet. The ice sheets together have lost enough ice into the ocean to raise global sea level by about 14 millimeters (0.55 inches) between 2003 and 2019. Of the global sea level rise from ice sheet meltwater and calving icebergs, about two-thirds came from Greenland, and the rest from Antarctica. Credit: Smith et al./Science
Previous studies of ice loss or gain often analyze data from multiple satellites and airborne missions. The new study takes a single type of measurement — height as measured by an instrument that bounces laser pulses off the ice surface — providing the most detailed and accurate picture of ice sheet change to date.
The researchers took tracks of ICESat measurements and overlaid the denser tracks of ICESat-2 measurements from 2019. Where the two data sets intersected — tens of millions of sites — they ran the data through computer programs that accounted for the snow density and other factors, and then calculated the mass of ice lost or gained.
“The new analysis reveals the ice sheets’ response to changes in climate with unprecedented detail, revealing clues as to why and how the ice sheets are reacting the way they are”, said co-author Alex Gardner, a glaciologist at NASA’s Jet Propulsion Laboratory in Pasadena, California.
The study found that Greenland’s ice sheet lost an average of 200 gigatons of ice per year, and Antarctica’s ice sheet lost an average of 118 gigatons of ice per year. One gigaton of ice is enough to fill 400,000 Olympic-sized swimming pools.
Of the sea level rise that resulted from ice sheet meltwater and iceberg calving, about two-thirds of it came from Greenland, the other third from Antarctica, Smith and his colleagues found.
“It was amazing to see how good the ICESat-2 data looked, right out of the gate,” said co-author Tom Neumann at NASA’s Goddard Space Flight Center in Greenbelt, Maryland. “These first results looking at land ice confirm the consensus from other research groups, but they also let us look at the details of the change in individual glaciers and ice shelves at the same time.”
In Greenland, there was a significant amount of thinning of coastal glaciers, Smith said. The Kangerlussuaq and Jakobshavn glaciers, for example, have lost 14 to 20 feet (4 to 6 meters) of elevation per year. Warmer summer temperatures have melted ice from the surface of the glaciers and ice sheets, and in some places warmer ocean water erodes away the ice at their fronts.
In Antarctica, the dense tracks of ICESat-2 measurements showed that the ice sheet is getting thicker in parts of the continent’s interior, likely as a result of increased snowfall, Smith said. But the loss of ice from the continent’s margins, especially in West Antarctica and the Antarctic Peninsula, far outweighs any gains in the interior. In those places, the ocean is also likely to blame.
“In West Antarctica, we’re seeing a lot of glaciers thinning very rapidly,” Smith said. “There are ice shelves at the downstream end of those glaciers, floating on water. And those ice shelves are thinning, letting more ice flow out into the ocean as the warmer water erodes the ice.”
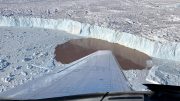
These ice shelves, which rise and fall with the tides, can be difficult to measure, said co-author Helen Amanda Fricker, a glaciologist at Scripps Institution of Oceanography at the University of California, San Diego. Some of them have rough surfaces, with crevasses and ridges, but the precision and high resolution of ICESat-2 allows researchers to measure overall changes, without worrying about these features skewing the results.
This is one of the first times that researchers have measured the loss of the floating ice shelves around Antarctica simultaneously with the loss of the continent’s ice sheet.
Ice that melts from ice shelves doesn’t raise sea levels, since it’s already floating — just like an ice cube in a full cup of water doesn’t overflow the glass. But the ice shelves do provide stability for the glaciers and ice sheets behind them.
“It’s like an architectural buttress that holds up a cathedral,” Fricker said. “The ice shelves hold the ice sheet up. If you take away the ice shelves, or even if you thin them, you’re reducing that buttressing force, so the grounded ice can flow faster.”
The researchers found ice shelves in West Antarctica, where many of the continent’s fastest-moving glaciers are located, are losing mass. Patterns of thinning show that Thwaites and Crosson ice shelves have thinned the most, an average of about five meters (16 feet) and three meters (10 feet) of ice per year, respectively.
For more on this study, see 16 Years of Ice Sheet Loss Mapped by Most Advanced Earth-Observing Laser NASA Has Ever Flown in Space.
Reference: “Pervasive ice sheet mass loss reflects competing ocean and atmosphere processes” by Ben Smith, Helen A. Fricker, Alex S. Gardner, Brooke Medley, Johan Nilsson, Fernando S. Paolo, Nicholas Holschuh, Susheel Adusumilli, Kelly Brunt, Bea Csatho, Kaitlin Harbeck, Thorsten Markus, Thomas Neumann, Matthew R. Siegfried and H. Jay Zwally, 30 April 2020, Science.
DOI: 10.1126/science.aaz5845
The study was funded by NASA. Other co-authors are Johan Nilsson and Fernando Paolo at NASA’s Jet Propulsion Laboratory; Brooke Medley, Thorsten Markus and H. Jay Zwally at NASA’s Goddard Space Flight Center; Nicholas Holschuh at Amherst College; Susheel Adusumilli at the University of California, San Diego; Kelly Brunt at the University of Maryland; Bea Csatho at the University of Buffalo; Kaitlin Harbeck at KBR; and Matthew Siegfried at the Colorado School of Mines.

“It’s like an architectural buttress that holds up a cathedral,” Fricker said. “The ice shelves hold the ice sheet up. If you take away the ice shelves, or even if you thin them, you’re reducing that buttressing force, so the grounded ice can flow faster.”
One frequently sees the above claim. However, Newton’s First Law states that an object at rest stays at rest and an object in motion stays in motion with the same speed and in the same direction unless acted upon by an unbalanced force. First off, the friction that a glacier experiences with the bedrock over which it flows is far greater of an impediment than the the inertia of any floating ice. If the ice that is melting is grounded, then the ice has inherited the momentum of the ice upstream, to which it is attached,and is not really ‘buttressing’ the glacier. Fricker’s “buttress” is like a person on ice skates trying to stop a de-railed freight train careening across a frozen pond.
If ‘global warming’ is responsible for melting along the periphery of Antarctica, then the obvious question should be, “Why isn’t it uniform around the whole continent?” The authors neglect to mention that there are known geothermal hot spots and under-ice volcanoes along the west coast.
It is Pookaseeha radiation heating theoceans.
Cowards will not admit Pookasheema did it.