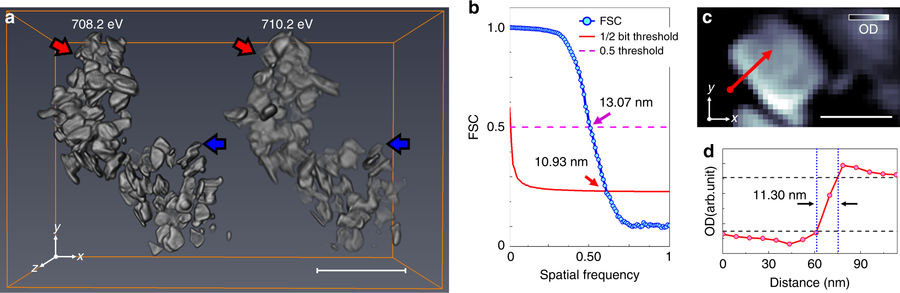
Results of tomographic reconstruction. a Reconstructed three-dimensional (3D) optical density volumes at 708.2 (left) and 710.2 eV (right). The size of reconstructed voxels is 6.7 × 6.7 × 6.7 nm3. b Resolution estimation of the 3D volume at 708.2 eV in a by Fourier shell correlation (FSC, blue solid line with scatter) with 1/2-bit (red solid line) and 0.5 (magenta dashed-line) threshold criteria. c Representative cross-section of the tomogram at 708.2 eV along the highest resolution plane (xy). The slice of the same position at 710.2 eV is shown in Supplementary Fig. 7. The positions of the slices are marked as red (cutting along xy plane) and blue (cutting along xz plane) arrows in a. The resultant cross-sections onto the lower resolution plane (xz plane) at both 708.2 and 710.2 eV are shown in Supplementary Fig. 8. d Line profile indicated by the red arrow in c. Black-dashed lines are guides for 10–90% resolution criteria. Scale bars in a and c indicate 500 and 100 nm, respectively. Young-Sang Yu, et al., Nature Communications, doi:10.1038/s41467-018-03401-x
Researchers from the University of Illinois at Chicago and Lawrence Berkeley National Laboratory have developed a new technique that lets them pinpoint the location of chemical reactions happening inside lithium-ion batteries in three dimensions at the nanoscale level. Their results are published in the journal Nature Communications.
“Knowing the precise locations of chemical reactions within individual nanoparticles that are participating in those reactions helps us to identify how a battery operates and uncover how the battery might be optimized to make it work even better,” said Jordi Cabana, associate professor of chemistry at UIC and co-corresponding author on the paper.
As a battery charges and discharges, its electrodes — the materials where the reactions that produce energy take place — are alternately oxidized and reduced. The chemical pathways by which these reactions take place help determine how quickly a battery becomes depleted.
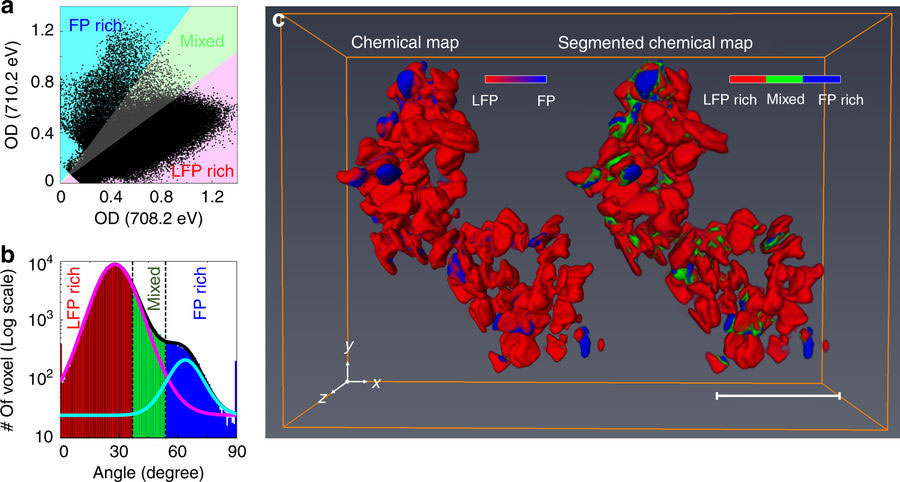
Three-dimensional (3D) chemical state mapping. a Correlative distribution plots between the optical densities (ODs) of each voxel at 708.2 and 710.2 eV. b Histogram plot of the polar angles of the data points in a. The y-axis is expressed as a logarithmic scale for better visibility. The plot can be fitted with summation (black solid line) of two Gaussian distributions which are centered on low (magenta solid line, 27.48o) and high (cyan solid line, 65.0o) polar angles correspond to Li0.93FePO4 and Li0.02FePO4, respectively. c 3D chemical map (left) and its segmentation into three chemical phase groups (right). The presence of the Li α FePO4 (majority Fe2+, LFP) and charged Li β FePO4 (majority Fe3+, FP) were assigned colors red and blue, respectively (left). The voxels were separated into three distinct groups, indicating chemical phase group of each voxel, according to the polar angle. The red, green, and blue areas indicate LFP-rich (>70% Li α FePO4), FP-rich (>70% Li βFePO4), and Mixed (30–70% Li α FePO4, the rest being Li β FePO4) domains, respectively. The shading colors in a, b indicate the criteria for chemical segmentation. Scale bar, 500 nm. Young-Sang Yu, et al., Nature Communications, doi:10.1038/s41467-018-03401-x
Tools available to study these reactions can only provide information on the average composition of electrodes at any given point in time. For example, they can let a researcher know what percentage of the electrode has become permanently oxidized. But these tools cannot provide information on the location of oxidized portions in the electrode. Because of these limitations, it is not possible to tell if reactions are confined to a certain area of the electrode, such as the surface of the material, or if reactions are taking place uniformly throughout the electrode.
“Being able to tell if there is a tendency for a reaction to take place in a specific part of the electrode, and better yet, the location of reactions within individual nanoparticles in the electrode, would be extremely useful because then you could understand how those localized reactions correlate with the behavior of the battery, such as its charging time or the number of recharge cycles it can undergo efficiently,” Cabana said.
The new technique, called X-ray ptychographic tomography, came about through a partnership between chemists at UIC and scientists at the Advanced Light Source, at Lawrence Berkeley National Laboratory in California. Advanced Light Source scientists developed the instrumentation and measurement algorithms, which were used to help answer fundamental questions about battery materials and behavior identified by the UIC team.
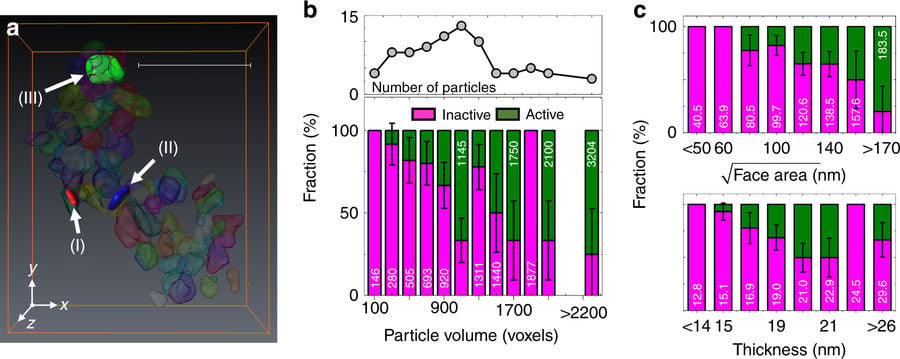
Activeness of each particle. a Voxel segmentation to define individual particles. Scale bar, 500 nm. b Volume distributions (black solid line with scatter) of individual particles shown in Fig. 2 and the fraction (bar plot) of inactive (magenta bar, <15% of Li β FePO4) and active (olive bar, 15–100% of Li β FePO4) particles as a function of particle volume with an increment of 200 voxels’ volume. Averaged particle volume in each range also shown. Each voxel has a volume of 6.7 × 6.7 × 6.7 nm3. The experimental error bars are calculated assuming a binomial distribution (active or inactive) taken at one standard deviation. c Compositional analysis based on the dimensions of each plate, comparing the facet area with thickness. The optical densities (ODs) of voxels along the particle thickness direction were averaged out across whole large facet. The thickness of the particle was calculated by the full-width-half-maxima of the averaged OD. The bar plots have the same color definition as b. Young-Sang Yu, et al., Nature Communications, doi:10.1038/s41467-018-03401-x
Together, the two teams used the tomographic technique to look at tens of nanoparticles of lithium-iron phosphate recovered from a battery electrode that had been partially charged. The researchers used a coherent, nanoscale beam of X-rays generated by the high-flux synchrotron accelerator at the Advanced Light Source to interrogate each nanoparticle. The pattern of absorption of the beam by the material gave the researchers information about the oxidation state of iron in the nanoparticles in the X-ray beam. Because they were able to move the beam just a few nanometers over and run their interrogation again, the team could reconstruct chemical maps of the nanoparticles with a resolution of about 11 nanometers. By rotating the material in space, they could create a three-dimensional tomographic reconstruction of the oxidation states of each nanoparticle. In other words, they could tell the extent to which an individual nanoparticle of lithium iron phosphate had reacted.
“Using our new technique, we could not only see that individual nanoparticles showed different extents of reaction at a given time, but also how the reaction worked its way through the interior of each nanoparticle,” Cabana said.
The UIC chemists are members of the NorthEast Center for Chemical Energy Storage, an Energy Frontier Research Center funded by the Department of Energy to investigate how Li-ion batteries work so that better, longer-lasting and lighter devices can be designed.

Representative three-dimensional (3D) chemical phase distribution of individual particle. a, d, g, Front (left) and backside (right) views of isosurface of three chemical components. Cross-sectional views along the thickness direction (b, e, h) and along the large face (c, f, i), respectively. The cross-section planes are indicated as magenta and cyan colored boxes in 3D isosurface plots. The red, green, and blue indicate LFP-rich, mixed, and FP-rich voxels, respectively. The positions of each particle are noted as (I), (II), and (III) in Fig. 3a for a, d and g, respectively. All scale bars, 50 nm. Young-Sang Yu, et al., Nature Communications, doi:10.1038/s41467-018-03401-x
David Shapiro of Lawrence Berkeley National Laboratories is the co-corresponding author on the paper. Young-Sang Yu, Maryam Farmand, Tolek Tyliszczak, Rich Celestre, Peter Denes, A. L. David Kilcoyne, Stefano Marchesini, Tony Warwick, John Joseph, Harinarayan Krishnan, Costa Leite and Howard Padmore of Lawrence Berkeley National Laboratory; Chunjoong Kim of the University of Illinois at Chicago; Yijin Liu of SLAC National Accelerator Laboratory, Menlo Park, California; Clare Grey, Fiona Strobridge of NECCES at the University of Cambridge; and Filipe Maia of Uppsala University, are co-authors on the paper.
Reference: “Three-dimensional localization of nanoscale battery reactions using soft X-ray tomography” by Young-Sang Yu, Maryam Farmand, Chunjoong Kim, Yijin Liu, Clare P. Grey, Fiona C. Strobridge, Tolek Tyliszczak, Rich Celestre, Peter Denes, John Joseph, Harinarayan Krishnan, Filipe R. N. C. Maia, A. L. David Kilcoyne, Stefano Marchesini, Talita Perciano Costa Leite, Tony Warwick, Howard Padmore, Jordi Cabana and David A. Shapiro, 2 March 2018, Nature Communications.
DOI: 10.1038/s41467-018-03401-x


Be the first to comment on "New Technique Reveals 3D Nanoscale Chemical Reactions Inside Batteries"