The origin of the SARS-CoV-2 virus, which has caused the COVID-19 pandemic, has been hotly debated.
This debate has caused substantial difficulties in the Australia-China relationship, with a call by Foreign Minister Marise Payne for another inquiry into its origin being considered by China as a hostile act.
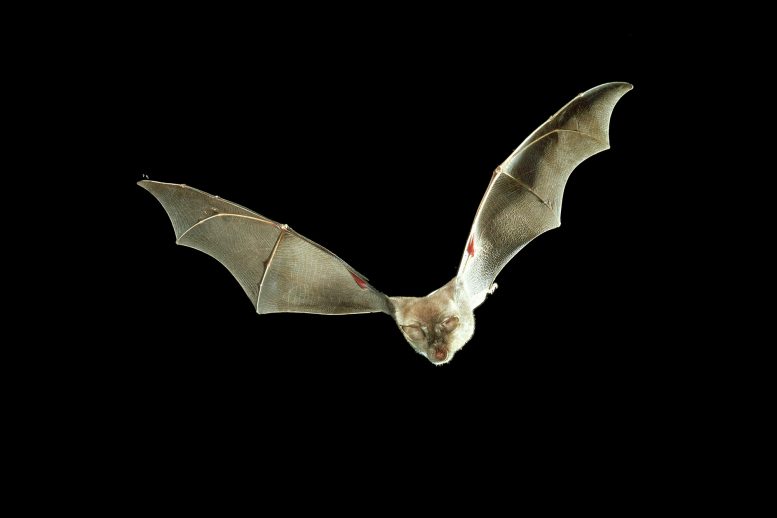
What’s not in doubt is the closest relatives of the virus are found in bats. How, where and when the virus spilled over into humans is the contentious issue.
One widely supported hypothesis is the spillover occurred in the “wet markets” of Wuhan, where many species of wildlife from across China are held in crowded conditions.
However, there’s no evidence the species of bats in which the closest relatives of SARS-CoV-2 are found were sold through the Wuhan wet markets at any time in the two years before the pandemic. This hypothesis requires the existence of a “bridge host,” another species that becomes infected via spillover from the original bat hosts, and then passes the virus onto humans.
Bridge hosts are well-known in many emerging human diseases. For example, Hendra virus, which my group studies, has flying foxes as its reservoir. Hendra spills over to horses with some frequency. Horses then amplify the virus as a bridge host and can infect humans.
Fortunately, this is extremely rare, with only seven known cases. Tragically, four of those people died. Hendra has never been known to spread directly from flying foxes to humans.
More evidence a lab leak is very unlikely
A second, much more contentious hypothesis is the origin of the pandemic was the result of a “lab leak.”
Wuhan has one of the most sophisticated virological laboratories in China, and the laboratory does work on bat viruses. The suggestion is the virus may have inadvertently been released into the general community via one of the workers. No direct evidence supports this hypothesis.
A new pre-print study, released online, provides strong evidence to support the “natural spillover” hypothesis, with results that are hard to reconcile with the “lab leak” hypothesis.
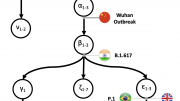
The study is yet to be peer reviewed. But it’s based on a detailed examination of the genetic sequences of two early lineages obtained from people infected in late 2019 and early 2020.
For convenience, these two lineages are called A and B. The two lineages differ by just two nucleotides (letters in the genetic code) at two different key sites in the genetic sequence.
Genetic sequencing isn’t perfect. Close examination of the 38 intermediates strongly suggested they were more likely to be sequencing errors of pure lineage A or lineage B than to be true intermediates.
The genetic evidence, therefore, suggests very strongly there have been at least two separate spillover events into human populations, one being from lineage A and another being from lineage B.
Did a human bring SARS-CoV-2 to the wet markets?
The data don’t tell us there have been only two spillover events — there may have been more. Nor do they tell us whether these spillovers happened directly from bats, or whether some or all happened via an intermediate bridge host.
A Nature news article suggests this evidence points to the spillover having happened via the wildlife trade, but I think this is taking it a step too far.
While some of the wildlife species sold through the Wuhan wet market can indeed become infected with SARS-CoV-2 (for example raccoon dogs and mink), there’s no evidence any sold through the market were infected.
Many of the earliest human viral sequences (all lineage B) were recovered from the Wuhan seafood market, but wet markets and abattoirs are well-known to be places where the SARS-CoV-2 virus spreads very well from human to human.
So, it may have been a human who brought the virus to the Wuhan seafood market, rather than a species of wildlife.
One thing we do know is this pandemic originated through a human coming in contact with another species infected with the virus.
It’s unknown whether this was a bat or a bridge host, and whether this contact occurred in a wildlife market, or in a bat cave, or somewhere else entirely different.
Nevertheless, as humans encroach more and more on the habitats of wild animals and as wild animals are brought more frequently into close contact with humans, we can expect further spillovers and pandemics to occur.
If there was a single lab escape event, the separation into lineages A and B must have happened after the lab escape. We would therefore expect to see a substantial number of intermediate lineages, with the lineage A nucleotide at one site, and the lineage B nucleotide at the other site.
However, if almost all of the genetic sequences obtained from humans are “pure” lineage A or pure lineage B, this suggests there were at least two different spillover events, either directly from bats or via bridge hosts.
And the evolution of the two lineages occurred before humans were infected.
The researchers downloaded all complete genetic sequences for SARS-CoV-2 that had been lodged in a widely used genomic database. Of these sequences, 369 were lineage A, 1,297 were lineage B and just 38 were intermediates.
Written by Hamish McCallum, Director, Centre for Planetary Health and Food Security, Griffith University.
This article was first published in The Conversation.![]()


This information is very helpful, thank you!
“Nevertheless, as humans encroach more and more on the habitats of wild animals and as wild animals are brought more frequently into close contact with humans, we can expect further spillovers and pandemics to occur.”
Modern humans have been around for about 300,000 years. Most of that time humans lived in the habitat of wild animals and ate anything they could catch. Cities are a relatively new phenomena, being about 10,000 years old. However, even until recently, most humans were still living close to the wild habitat. What is really different over the last 300,000 years is that the human population is larger than it has ever been, and most people now live in cities. The Black Death demonstrated that cities are unhealthy places to live.
They test for the flu since they’ve never isolated Covid-19. Which makes me wonder how they can tell there is a delta variant. They never isolated the virus but they use a test to show the damage of a solution does on monkey kidney cells then show the cellular debris as proof of the virus. So, they can use this method to claim an UNENDING! amount of variants. A lot of cancers and “viruses” are probably just different forms of parasites. Since the tests can’t differentiate between cold and flu and covid then doesn’t that mean ivermectin cures both the cold and the flu? Welcome to “they’ve been lying to us our entire lives about everything”.
Hammish McCallum references the article ‘Evidence Against the Veracity of SARS-CoV-2 Genomes Intermediate between Lineages A and B’, by Pekar to support the possible ‘natural spillover’ hypothesis. https://virological.org/t/evidence-against-the-veracity-of-sars-cov-2-genomes-intermediate-between-lineages-a-and-b/754
Pekar’s research group attempts to disprove the theory that there are intermediate lineages, such as C/C and T/T, between the Covid-19 A and B basic lineages. Simple A and B lineages for Covid-19, ‘natural spillover’, except for the following.
“Of the 77 mutations seen in C/C intermediate genomes, 32 (41.6%) would need to be homoplasies if these C/C intermediates actually existed. Similarly, 7 (58.3%) of the 12 mutations seen in T/T genomes would need to be homoplasies if the T/T intermediates truly existed. These apparent homoplasies can arise from issues regarding sample preparation, contamination, sequencing technology, and/or consensus calling approaches (3). …..These findings cast substantial doubt on the veracity of C/C or T/T intermediate genomes in early 2020. We suggest that these early C/C and T/T genomes are erroneous and should be excluded from phylogenetic analyses. ”
‘Natural spillover’ except for the 77 eyewitnesses ‘intermediate’ genomes, that say, explain us! 77 intermediate genomes between the A and B lineages. The authors use the word ‘homoplasy’ at least three times?
“A character state that evolved because of convergent evolution but was not acquired through common evolutionary lineage is called homoplasy”
https://www.sciencedirect.com › medicine-and-dentistry
‘A homoplasy is a shared character between two or more animals that did not arise from a common ancestor. A homoplasy is the opposite of a homology, where a common ancestor provided the genes that gave rise to the trait in two or more animals.’ https://biologydictionary.net/homoplasy/
Homoplasy, no common evolution, no common ancestor, another name for different outbreak sources? ‘Natural spillover’, except for these 77 intermediate genomes.
Figure 2 of the Pekar article above shows many of the genomes in ‘error’ to be at the same phylogenic level of the first mutation T28144C . Multiple outbreak sources? No natural spillover?
Pekar and his co-authors may have more difficult hurdles to leap, regarding a new lineage C for Covid-19. A lineage at the same levels of the A and B lineages. This new lineage pertains to D614G mutation.
“Our analyses show support for three distinct lineages of SARS-CoV-2 actively spreading around the world . These lineages are highly unlikely to have been generated under the same coalescent process….Lineage C was predominantly European with no evidence that it circulated in China . This lineage was well supported as monophyletic (node posterior support (.99, 91% bootstrap support, Fig. 1) and diverged from Lineage B in late January (95% highest posterior density late January to early February). Linked non-synonymous mutations differentiated
this lineage in the S gene (sites 23402-04 or D614G) and ORF1ab
(14407-09) regions….. We were able to identify three lineages that were not only genetically distinctive but also had unique demographic signatures, revealing insights into the underlying epidemiology of this pandemic.’
‘Emerging phylogenetic structure of the SARS-CoV-2 pandemic’,
Nicholas M. Fountain-Jones, Virus Evolution, 2020, Vol. 6, No. 1
Let’s hope that no one is introducing new base lineages of Covid-19 into this world of ‘natural spillovers’. In Christ Jesus.
On February 26, 2022, George Gao of the Beijing China National CDC published the preprint 1) ‘Surveillance of SARS-CoV-2 in the environment and animal samples of the Huanan Seafood Market’, by George Gao, William Liu, and many others, Chinese Academy of Sciences, National Institute for Viral Disease Control and Prevention, and others https://assets.researchsquare.com/files/rs-1370392/v1_covered.pdf?c=1645813311
which contains the results of 33 environment samples collected January 1 or 12, 2020, from the Huanan Seafood Market (HSM) in Table 1 of the article, and results of samples collected on later dates. On the same day Michael Worobey and Christian Andersen study group released their preprint article below, that contained 33 positive environment samples from the HSM in their Table S2.
(2) ‘The Huanan market was the epicenter of SARS-CoV-2 emergence’, by https://zenodo.org/record/6299116#.Yh_ErJhMFdh, by Michael Worobey, Joshua Levy, Pekar, and others.
Worobey and Anderson probably consulted with Dr. Gao, to get their list of environmental samples of the HSM.
Dr. Gao’s Table 1 lists the 33 Huanan Seafood Market positive environment samples for Covid-19, and he observed.
“live viruses were isolated from samples F13 (wall) , F54 (ground), and B5 (ground), which were the only three samples with Ct values <30 (cycle threshhold) ….. samples F13 (wall) and F54 (ground) were from the stalls with confirmed patients ……..The genome sequences of two environmental samples, F13 (wall) and F54 (ground), were found to be highly identical to the reference strain HCoV/Wuhan/IVDC-HB-01 (WH01, sequence identity of 99.993%) and completely identical to the human stain Wuhan-Hu-1 (GenBank: NC_045512) ……. Notably, samples F13 and F54 were from the stalls with confirmed patients. All the results of successful virus isolation and the Ct values of the original samples revealed the existence of live SARS-CoV-2 with high titers in the environment of HSM……Commercial products of swabs and virus preservation solution were used for the sampling (Disposable Virus Sampling Tube, V5-S-25, Shen Zhen Zi Jian Biotechnology Co., Ltd., Shenzhen, China). For environmental samples, sampling swabs were applied to smear the floors, walls or surfaces of objects and then preserved them in virus preservation solution.”
Dr. Gao says F13 wall and F54 ground environmental samples are highly identical (99.993%) to IVDC-HB-01 (WH01) , and completely identical to Wuhan-Hu-1, NC_045512 isolate. IVDC-HB-01 (WH01) might have been isolate EPI_ISL_402119 taken of Wuhan patient on December 31, 2019, by the National Institute for Viral Disease Control (IVDC) in Beijing, according to Table 5 in the article, ‘Nosocomial Outbreak of 2019 Novel Coronavirus Pneumonia in Wuhan, China’, by Xiaorong Wang, Qiong Zhou, and others, Wuhan Union Hospital, Beijing Capital Bio Medical, and others. https://www.ncbi.nlm.nih.gov/pmc/articles/PMC7236818/
EPI_ISL_402119 (GISAID) was 49 years old according to Table S1 in the article, ‘Supporting Information A Single and Two-Stage, Closed-Tube, Molecular Test for the 2019 Novel Coronavirus (COVID-19) at Home, Clinic, and Points of Entry’, by Mohamed El-Tholoth, and others. https://www.ncbi.nlm.nih.gov/pmc/articles/PMC8482318/bin/ac1c03016_si_001.pdf
NC_045512 housekeeping matters —-
Determining who NC_045512 is, is more important. That person’s Covid-19 sequence is ‘completely identical’ to the F13 wall sample according to Dr. Gao. The NCBI database entry for NC_045512.1 in part reads,
“NC_045512 30473 bp ss-RNA linear VRL 13-JAN-2020
TITLE A novel coronavirus associated with a respiratory disease in Wuhan
of Hubei province, China
JOURNAL Unpublished
CONSRTM NCBI Genome Project
JOURNAL Submitted (13-JAN-2020) National Center for Biotechnology
Information, NIH, Bethesda, MD 20894, USA
/isolate="Wuhan-Hu-1" ”
https://www.ncbi.nlm.nih.gov/nuccore/NC_045512.1
NC_045512.1 virological sequences (VRL) filed January 13, 2020 with NCBI. Sequence has 30473 base pairs, may have been named or sequenced in the United States by the NCBI Genome Project, using Chinese bioproject data, and was isolated in China in December 2019.
The then unpublished article was probably, ‘A new coronavirus associated with human respiratory disease in China’, by Fan Wu, Su Zhao, and others, Shanghai Public Health Center and others. Received for publication January 7, 2020, but not published online until Feb 3, 2020, bioproject number PRJNA603194. This is Shanghai Covid-19 study # 1. https://www.nature.com/articles/s41586-020-2008-3
‘NC’ stands for National Center.
NCBI Genome Project is also associated with the submission of
NC_001451.1 Avian infectious bronchitis virus
NC_003436.1 Porcine epidemic diarrhea virus
NC_002645.1 Human coronavirus 229E
On the other hand, NC_045512.2 virological sequences (VRL) were filed July 18, 2020 with NCBI. That sequence has a 29,903 base pair genome. NCBI database entry in part reads,
“LOCUS NC_045512 29903 bp ss-RNA linear VRL 18-JUL-2020 The reference sequence is identical to MN908947. On Jan 17, 2020 this sequence version replaced NC_045512.1.”
https://www.ncbi.nlm.nih.gov/nuccore/NC_045512.2
So according to NCBI database curators, NC_045512.2 reference sequence is identical to MN908947. A NCBI software BLAST comparing the two sequences shows 100% identity and 100% Query Cover. We know that MN908947 (identical to NC_045512.2 sequence) was a 41 year old who worked at the Huanan Seafood Market (HSM).
“Here we study a single patient who was a worker at the market and who was admitted to the Central Hospital of Wuhan on 26 December 2019………The patient studied was a 41-year-old man with no history of hepatitis, tuberculosis or diabetes.……. During admission, BALF (bronchoalveolar lavage fluid ) was collected and stored at −80 centigrade until further processing….the viral load in the BALF sample was estimated by qPCR to be 3.95 × 10 to the 8 th power copies per ml (395,000,000 copies per ml—my numeric interpolation)…. This virus strain was designated as WH-Human 1 coronavirus (WHCV) (and has also been referred to as ‘2019-nCoV’) and its whole genome sequence (29,903 nt) has been assigned GenBank accession number MN908947”. —- in the article, ‘A new coronavirus associated with human respiratory disease in China’, by Fan Wu, Su Zhao, Bin Yu, and others, Shanghai Public Health Center, Wuhan Central Hospital and others.
Shanghai Covid-19 study # 1.
So F13 wall sample sequence from HSM ‘completely identical’ to NC_045512.2 sequence (according to Dr. Gao), completely identical to MN908947 sequence (according to NCBI), for 41 year old admitted to Wuhan Hospital December 26, 2019, with high viral load. Verifying 41 year old co-workers Covid-19 status and hospitalization dates, is very important to understanding how F13 sample got on the Huanan Seafood Market stall wall.
The World Health Organization January 2021 study of Covid-19 origin lists four clusters of early Covid-19 cases, two directly involving HSM employees. Cluster # 2 affirms the existence of a 40 year old HSM employee. From page 157 of the WHO Annexes report.
“Cluster 1: Including two confirmed cases, living together as husband and wife. Both of them denied case contact history, as well as history of exposure to Huanan Market. Spouse one, 62 years old, fell ill on 15 December 2019, spouse two, 62 years old, fell ill on 26 December 2019.”
“Cluster 2: there were 3 confirmed cases, all of whom were traders of the same stall in Huanan Market. Stall employee one, 40 years old, fell ill on 17 December 2019; stall employee two, 32 years old, fell ill on 19 December 2019; stall employee three, 57 years old, fell ill on 25 December 2019. It was a fixed stall in Huanan Market, dealing in frozen products such as pastry and soy products. Employee two was purchasing goods from the Baishazhou market and Huanan Market back and forth. Employee three was delivering goods in Huanan Market.”
“Cluster 3: there were two confirmed cases, living together as husband and wife, and both of them denied animal contact history and history of travel. Spouse one, 61 years old, fell ill on 20 December 2019; Spouse two, 57 years old, fell ill on 25 December 2019. Spouse one had been engaged in restaurant distribution for a long time, and often stocked up in Huanan Market. Spouse two denied a history of exposure to Huanan Market or other markets.”
“Cluster 4: There were two confirmed cases, both of whom were employees of the same stall in Huanan Market, and both of them denied contact history of poultry and animals, as well as contact history of travel. Employee one, 56 years old, fell ill on 20 December 2019; employee two, 45 years old, fell ill on 26 December 2019. It was a fixed stall in the Huanan Market, dealing in aquatic products such as catfish”, in the article ‘WHO-convened Global Study of Origins of SARS-CoV-2: China Part’, Joint WHO-China Study
14 January-10 February 2021 Joint Report – ANNEXES — https://www.who.int/docs/default-source/coronaviruse/who-convened-global-study-of-origins-of-sars-cov-2-china-part-annexes.pdf?sfvrsn=3065bcd8_5
It is possible Wuhan-Hu-1 NC_045512.2/ MN908947 isolate can be found in Cluster 2 of these four World Health Organization clusters of non-HSM and HSM workers. The WHO report should be read in the context of other important accounts given in January 2020.
Second major account of early SARS-CoV-2 cases is the article, ‘A pneumonia outbreak associated with a new coronavirus of probable bat origin’, by Peng Zhou, Zhengli Shi, and many others, Wuhan Institute of Virology, and others. Extended Tables # 1 and # 2 indicate,
ICU-04 person was 32 years old admitted to hospital on December 27.
ICU-10 person was 56 years old admitted December 20.
ICU-05 person age 40 admitted to hospital on December 27.
These hospitalization cases pretty much match the World Health Organization ‘Cluster 2’ of infected HSM workers. Only one non-Huanan Seafood Market related patient. ICU-01, age 62, admitted December 27, 2019, which may match a World Health Organization ‘Cluster # 1’ person above.
Wuhan Institute of Virology isolates can be correlated in ‘Table S5 The integrated introduction of all 61 published 2019-nCoV’, in the article ‘Nosocomial Outbreak’ referenced above.
Third major account of early SARS-CoV-2 cases is the Beijing CDC table, ‘Information about samples taken from nine patients infected with 2019-nCoV’, in the article ‘Genomic characterisation and epidemiology of 2019 novel coronavirus: implications for virus origins and receptor binding’, by Roujian Lu, Xiang Zhao, and many others. Beijing CDC identify a WH01 person whose BALF was taken December 26, 2019. That person’s isolate was filed with the Chinese National Microbiological Data Center. Beijing CDC Figure 3 phylogenic tree in this article dated January 28, 2020 shows the Beijing CDC had knowledge of the full genome of Atlanta CDC bat coronavirus BtKy72, seven days before BtKy72’s sequences were filed with NCBI on February 5, 2020. Questions as to how the Beijing CDC got that pre-knowledge, are asked are at the end of this comment.
Fourth major account of early HSM cases is, ‘Table 1. Clinical symptoms and patient data’, in the article ‘Complete genome characterisation of a novel coronavirus associated with severe human respiratory disease in Wuhan, China’, by Fan Wu, Su Zhao, and others. That article lists clinical data for seven early SARS-CoV-2 cases. This is Shanghai Covid-19 report # 2.
An important aspect of the F13 wall sample is that it had ‘high titers’, ‘the Ct values of the original samples revealed the existence of live SARS-CoV-2 with high titers in the environment of HSM’. Dr. Gao does not give the possible viral load for the F13 wall sample, but he does provide the Ct value. Ct values may reflect viral load size according to some scientists. An Oxford University study group equivocated a Ct value of 24.4 or less, to a viral load of greater than or equal to 10,000 RNA copies/ml or more, in 85% of their case-contact pairs.
“SARS-CoV-2 infectivity varies by case viral load, contact event type, and age. Those with
high viral loads are the most infectious….predict the real-world likelihood of a SARS-CoV-2 infected individual infecting someone else……85.4% (197,677/231,497) of case-contact pairs with PCR-positive contacts, i.e., plausible onward transmission, had case viral loads of greater than or equal 10,000 RNA copies/ml (i.e. Ct less than or equal to 24.4)”, in the article, ‘ SARS-CoV-2 infectivity by viral load, S gene variants and demographic factors and the utility of lateral flow devices to prevent transmission’, by Lennard YW Lee, and others, University of Oxford
Riddell and van Doremalen make similar correlations between Ct values and ‘viral load’ RNA copies/ml in their articles referenced below. So F13 wall (23.85 Ct) sample and F54 (25.8 Ct) ground sample Ct’s counts similar to Wuhan-Human-1 Ct (23.967 – Extended Data Figure 4) count, ‘might’ reflect similar viral loads for each sample. On the other hand, Dr. Gao’s ‘high titers’ may refer to a samples infectivity (as determined by TCID50 or plaque forming units), and not necessarily RNA ‘viral load’ as determined by quantitative RT-PCR. A University of Edinburg study defined infectivity as follows.
“Viability refers to how stable a viral particle is outside of a host cell (e.g. in air as it travels from infector to infectee) whereas infectivity (or replicability) refers to its ability to multiply within a host cell. …..modelling study, by Lelieveld et al (2020) estimated the indoor infection risk from aerosolized viruses in four different environments. The study made assumptions on viral load and infection dose as highly infectious viral load of 5 × 10 to the 8 power RNA Copies/cm3; super infectious viral load of 5 × 10 to the 9 th power (10 to the 9 th–10 to the 10 th copies/cm3); infective dose (D50) 316 RNA copies (100–1000 RNA copies); and virus lifetime in aerosol of 1.7 days” ——in the article,
‘Review: What is the infectious dose of SARS-CoV-2?’, Date: 30th April 2021 Version: 29-01 , University of Edinburgh, Usher Institute
Highly infectious viral load, super infectious viral load, and infectious dose. Wuhan-Hu-1 with his BALF of 3.95 × 10 to the 8 th power copies per ml (395,000,000 copies per ml) would be close to highly infectious, if one disregards the unit of measure ‘cm3’. Saikat Basu expanded on the notion of infectious dose and plaque forming unit as follows,
“The infectious dose is a fundamental virological measure quantifying the number of virions that can go on to start an infection; the value of which is still not conclusively known for SARS-CoV-2 . Theoretically, according to the independent action hypothesis , even a single virion can potentially establish an infection in highly susceptible systems……the (2018 ferret) study extracted the dose in terms of the plaque-forming units (PFU)—which is a measure used in virology to describe the number of virus particles capable of forming plaques per unit volume. The quantitative estimate of the infectious dose, being of the order O (10 to the 2 nd power- 100 my interpolation), agrees with the findings presented her….how effective are these droplets at carrying virions? SARS-CoV-2 belongs to a diverse family of single-stranded RNA viruses , and as noted before, virological assessments done on the sputum of hospitalized COVID-19 patients show an averaged viral load of 7.0 × 10 to the sixth power RNA copies/mL of oral fluid (7,000,000-my interpolation), with the peak load being 2.35 × 10 to the ninth power copies/mL (2,350,000,000-my interpolation).”—in the article, ‘ Computa- tional characterization of inhaled droplet transport to the nasopharynx’, by Saikat Basu, South Dakota State University
Taken in the context of Basu’s data, Wuhan-Hu-1 with his BALF of 3.95 × 10 to the 8 th power copies per ml (395,000,000 copies per ml) was above average viral load, and heading towards peak. Just as important, Basu defined plaque forming units as “the number of virus particles capable of forming plaques per unit volume.” Plaque forming units and TCID50 are the two basic ways of determining infectious titer.
“Viral loads are commonly measured in two distinct ways: counting viral RNA genomes by qRT-PCR and measuring the number of infectious units in tissue culture (and thirdly by counting PFUs). The (this) second approach incubates susceptible mammalian cells with dilutions of a patient sample to determine the amount of sample required to kill 50% of the cells. This value is used to back-calculate the infectious titer in the sample in units of “50% tissue culture infective dose” or TCID50 [for example, by the Reed and Muench method]. The TCID50 is analogous (and often quantitatively similar) to the plaque-forming units (PFU) assay. Here, we refer to TCID50 and PFU more generally as “infectious units.” As these two measurement modalities (RNA genome copies and infectious units) differ in reported values and interpretation—one method measuring the number of RNAs, the other measuring the number of infectious units…….In case where a large fraction of the viral RNA copies are present as “naked” RNA (not encapsulated inside viral particles), using viral RNA copies as a proxy for the number of viral particles could lead to an overestimate.
——in the article ‘The total number and mass of SARS-CoV-2 virions’, Ron Sender,Yinon Bar-On, and others, Department of Molecular Genetics, Weizmann Institute of Science, Rehovot, Israel, and others.
‘Naked’ RNA, versus particle encapsulated RNA , what was the predominate case for the F13 wall coronavirus sample? More to be said later regarding using TCID50 versus plaque forming units to measure infectious units. But measuring the viral load (viral RNA genomes) itself using qRT-PCR would be the first step taken. Again, Dr. Gao was probably referring to ‘infectiousness’, when he stated F13 wall sample and F54 ground sample had ‘high titers’, but he could have been referring to the viral load size itself.
And to this date, one study has measured the ‘titers’ of the F13 wall sample, Harbin Veterinary Institute in February 2020. In their article ‘Susceptibility of ferrets, cats, dogs, and other domesticated animals to SARS–coronavirus 2’, by Jianzhong Shi, Zhiyuan Wen, and others, Harbin inoculated ferrets with the F13 wall environmental sample coronavirus provided by the Beijing CDC. Harbin’s Figure 1A shows a ‘viral load’ of about 10 to the eight power (100,000,000 my interpolation) RNA copies per gram, on day one after inoculating ferrets with F13 sample coronavirus. Harbin’s figure 1C shows about 10 to the 6 th power infectious plaque forming units per gram (1,000,000 my interpolation) in ferrets inoculated with F13 coronavirus on day one after inoculation. On day one F13 wall sample coronavirus ‘may have been’ already infectious (able to infect ferret/human cells) and environmentally transmissible. https://www.science.org/doi/10.1126/science.abb7015
Harbin then made the same calculations per milliliter, instead of per gram. Figures 1E shows the RNA copies per milliliter for F13 (about 1,000,000) inoculated ferrets, and Figure 1G shows about 1,000 infectious plaque forming units per milliliter for F13 inoculated ferrets on day one after inoculation. 10,000 pfu on day two after inoculation. Remember, Basu defined plaque forming units as “the number of virus particles capable of forming plaques per unit volume.” No one has determined the number of virons per particle, or the particle diameter for the F13 wall sample
In March 2020, a Los Alamos National laboratory (Alan Perelson) and San Diego University study reviewed Harbin Veterinary Institute data, and found similar infectivity for the F13 wall sample inoculated ferrets. See Figures 1-3, in the article, ‘Modeling Within-Host Dynamics of SARS-CoV-2 Infection: A Case Study in Ferrets’, by Naveen Vaidya, Angelica Bloomquist, and Alan Perelson, Los Alamos National laboratory and San Diego University laboratory. They concluded.
“At the peak, the viral load reached about 8 log10 RNA copies per mL (100,000,000-my numeric interpolation), among which approximately 4 log10 (10,000-my interpolation) (approximately 0.01%) per milliliter are infectious viruses. The general pattern observed in SARS-CoV-2 dynamics is similar to that for influenza virus… In general, the infection rate (b), the virus production rate (p), the proportion of infectious virus (a), and the rate of transfer from eclipse phase to infectious phase (k) positively impacted total viral-peak, infectious viral-peak, and cell loss and negatively impacted time to viral-peak. The viral clearance rate (c), the infected cell death rate (d), and the IFN-induced antiviral efficacy (s) have both positive and negative effects depending on the property being examined”.
Los Alamos National laboratory modelling Figures 1-3 clearly shows about 10,000 infectious plaque forming units day four, after inoculation of ferrets with F13 sample coronavirus. This matches Harbin’s Figure 1G day two infectivity count. This means that .01 % of the viral load (8 log10 RNA copies per mL -100,000,000) was infectious. Los Alamos merely repeated what Weizmann Institute of Science stated earlier regarding .01% infectious part of the viral load.
“Ratios on the order of 10 to the third power, to 10 to the fourth power between viral particles and PFUs were observed in animal viruses such as poliovirus and papillomavirus. Naively, such a ratio would suggest that only 0.01% of the virions produced are actually infectious. This ratio implies that SARS-CoV-2 is not very efficient in producing infectious progeny. While we do not have a clear explanation for this seeming low efficiency, there are several possible factors that will affect this ratio..”, in the article, ‘ The total number and mass of SARS-CoV-2 virions’, Ron Sender, Yinon Bar-On, and others, Weizmann Institute of Science, Rehovot, and others .
Regarding the total viral load itself in the ferrets inoculated with F13 sample coronavirus peak viral load of 100,000,000 RNA copies per milliliter, according to both Harbin Veterinary Institute and Los Alamos National laboratory. In contrast, the December 26, 2019 viral load for Wuhan-Hu-1 BALF sample was estimated by qPCR to be 3.95 × 10 to the 8 th power copies per ml (395,000,000 RNA copies-my numeric interpolation) by Shanghai Public Health. Both big numbers. Approximately .01% of that may have been infectious virions (Los Alamos National laboratory and Weizmann Institute), the ‘titers’.
But as a future baseline approach to understand the contents of one plaque forming unit,
“Comparing the early measurements of the total virus with the measurements of infectious virus, we deduced that 1 PFU (plaque forming unit) corresponds to approximately 10 to the fourth power (10,000) virions, which is in line with published estimates.”
Los Alamos National laboratory (Alan Perelson) and University of San Diego laboratory
So Harbin’s Figure 1G showing about 10,000 plaque forming units in the F13 inoculated ferrets, on day two after inoculation, should be read in the context of the above ambiguous statement. Harbin and Los Alamos National laboratory seem to on the same page regarding the ‘possible’ infectivity of F13 wall sample, but Harbin suggests the infectivity was there on day one. Possibly intimating F13 wall sample was infectious January 1, 2020. The question then becomes, was F13 presence on the wall via aerosol transmission (droplet, etc), or touch transmission?
“Moreover, rather than the conventional definition of 5 micrometer, it has recently been suggested that the size distinction between aerosols and droplets should be updated to 100 micrometers, as this distinguishes between the two on the basis of their aerodynamic behavior. Specifically, 100 micrometers represents the largest particles that remain suspended in still air for greater than 5 s (from a height of 1.5 m), travel beyond 1 m from the infectious person, and can be inhaled. Although droplets produced by an infectious individual through coughing or sneezing may convey infection…..The factors affecting airborne transmission include viral load in different sized respiratory particles, the stability of the virus in aerosols,….. Large droplets tend to reach their maximum horizontal distances quickly and fall to the ground or surfaces within a few meters,whereas aerosols can remain suspended for many seconds to hours, travel long distances, and accumulate in air in poorly ventilated spaces”, in the article, ‘Airborne transmission of respiratory viruses’, Chia Wang, Kimberly Prather, and others, Sun Tatsen University, Taiwan, and others
What was the initial velocity of the F13 sample that allowed it to overcome gravity and drag forces and adhere to the HSM wall? Neeltje van Doremalen from the NIAID in Montana used TCID50 to help determine the infectivity of SARS-CoV-2 on aerosoled fomite surfaces, as well as determined the half-life of SARS-CoV-2 on those surfaces.
“the titer of aerosolized viable virus is expressed in 50% tissue-culture infectious dose
(TCID50) per liter of air….The longest viability of both viruses was on stainless steel and plastic; the estimated median half-life of SARS-CoV-2 was approximately 5.6 hours on stainless steel and 6.8 hours on plastic….On cardboard, no viable SARS-CoV-2 was measured after 24 hours and no viable SARS-CoV-1 was measured after 8 hours…… We evaluated the stability of SARS-CoV-2 and SARS-CoV-1 in aerosols and on various surfaces and estimated their decay rates”. —–in the article, ‘Aerosol and Surface Stability of SARS-CoV-2 as Compared with SARS-CoV-1’, by Neeltje van Doremalen, and others, National Institute of Allergy and Infectious Diseases, Hamilton, Montana
van Doremalen using TCID50 techniques, and not plaque forming assays to test aerosoled Covid-19 infectivity on fomite surfaces. What does this say about the diameter size of the particles being tested on the fomite surfaces? Could plaque forming assays have been used? They also determined that the half-life (time taken to achieve a 50% reduction in titre/viral load) for Covid-19, on different types of fomite surfaces as being a matter of hours, to a matter of days.
More impressive was the study, ‘The effect of temperature on persistence
of SARS‑CoV‑2 on common surfaces’, by Shane Riddell, Sarah Goldie, and others, where they determined D values (time taken to achieve a 90% reduction in titre ) for many fomite surfaces. And how long it takes Covid-19 on fomite surfaces to reach its ‘limit of detection’. That extends to about 28 days on vinyl, stainless steel etc depending on temperature and humidity in the environment, using TCID50 assay. At least ten HSM environmental ground samples (not absorbed into the ground) tested positive for Covid-19 on January 1, 2020. Its possible they could have been there since December 1, 2019 taking into account their possible D values, limit of detection not being reached, temperature in the HSM, and half life (reduction 50% in titre) , and their then current positive Ct values. People could have been foot tracking Covid-19 throughout HSM for some time. But F54 ground sample seems rather ‘fresh’ because high viral load and possible infectivity. Not like the other ground environmental samples.
If Wuhan-Hu-1 NC-045512.2/ MN908947 got its 100% sequence identity with F13 wall coronavirus on December 26, 2019 the day his BALF was taken, or the day before. If that F13 coronavirus on December 26 is the same taken by Beijing CDC on January 1, 2020, should we not expect ‘low titers’ January 1, 2020 when Beijing CDC sampled the wall, due to viral decay on the wall, short half-life on the wall, no virus reproduction on the wall, heat, humidity, evaporation, and possible sunlight exposure while on the wall? But since that F13 sample location on January 1, 2020 was high titer, high infectivity, it must have been reproduceable in the entity that comported it, and that reproduced ‘fresh’ stuff was sampled January 1, 2020. A BLAST of NC_045512.2 shows at least forty people with 100% identity and 100% query cover to Wuhan-Hu-1. Especially OM035668.1 32 year old, and OM065385.1 a 54 year old and their coughing and sneezing settling velocity would have carried those particle to the ground. But most were hospitalized by December 30, 2019 according to the WIV report. The most parsimonious explanation is that some ‘other’ physical source comporting the F13 coronavirus was smashed or thrown against the wall around December 30. Fresh ‘stuff’, same sequence identity and Ct count on January 1, 2020 as on December 26, 2019, time of first hospitalization. TCID50 was not used to test F13 and F54 for infectivity by Harbin Veterinary Center, could it have been? And if it couldn’t have been used, does that mean that F13 wall and F54 ground samples were not created by airborne or droplet transmission (particles less than 100 μm in diameter)? Does it matter? F13 wall sample particles too large to be droplet?
Perhaps Ralph Baric should be consulted. He moved from using TCID50 techniques to determine the infectivity of mice inoculated with deadly MA15 coronavirus in 2007, to using plaque forming units to determine the infectivity of Venezuelan equinine encephalitis virus loaded with an S gene from the MERS coronavirus (a real chimera) inoculated into the humanized mice in 2016. Why this move from using TCID50 to determine infectivity in 2007, to using plaque forming units in 2016 to determine infectivity? Is it because the HSM wall sample, I mean the mice were inoculated with plaque forming unit chimera coronavirus from the beginning? —in the article, ‘A mouse model for MERS coronavirus-induced acute respiratory distress syndrome’, by Ralph Baric, Boyd Yount, and others, Nature Microbiology, (2016)
If F13 wall sample had been created from a plaque forming unit based coronavirus, would TCID50 assay have worked here for Harbin’s analysis? But does F13 wall sample and F54 ground sample because of fresh infectious ‘high titers’ from some then living entity on December 31, 2019, transmitted about in ‘possibly’ an non-aerosoled manner (many stall workers, the sneezers and coughfers, were already hospitalized), perhaps something ‘slung’ or ‘smashed’ against the F13 wall overcoming all gravitational forces attempting to bring it to the ground, in conjunction with the ‘other’ 30 positive ‘waning’ samples which may indicate a prior 30 day presence of Covid-19 HSM, represent a possible ongoing reproduceable transmission event of the zoonotic kind for lineage B Covid-19 on January 1, 2020. This does not rule out the possibility that the possible zoonotic source had not been prior inoculated with Covid-19 as we know it, or that nebulization had occurred.
For those who say laboratory spillover, then where did the Chinese laboratory get its copy of BtKy72 to integrate into the Covid-19 genome, the Atlanta CDC? The receptor binding motif (RBM) in the spike gene came from pangolin 2019, according to many scientists. Why did the highly infectious spillover person with lineage B only infect the HSM? Is BtKy72 a laboratory construct fiction created for a plandemic?
The 2020 interest in F13 Huanan Seafood Market wall sample extended beyond the Los Alamos National laboratory (Alan Perelson) study group. In the March 2020, Cornell University article, ‘Phylogenetic Analysis and Structural Modeling of SARS-CoV-2 Spike Protein Reveals an Evolutionary Distinct and Proteolytically Sensitive Activation Loop’, by Gary Whittaker, and others, Figure 4 shows their extremely high interest in the F13 environmental samples. The Beijing CDC had taken three different F13 wall samples in January 2020. Cornell University study group compared all three F13 wall sample isolates S genes, to the S genes of pangolin 2019 and RaTG13.
BetaCoV/Wuhan/IVDC-HB-envF13/2020 |EPI_ISL_408511,
BetaCoV/Wuhan/ I V D C – H B – envF13– 2 0 /2020|EPI_ISL_408514, and
BetaCoV/Wuhan/IVDC-HBe n v F 1 3 – 2 1 / 2 0 2 0 | E P I _ I S L _ 4 0 8 5 1 5.
The three F13 wall samples have the same amino acids S gene sequences as pangolin 2019 and RaTG13. But only the three F13 environmental samples above had the RRAR amino acid furin cleavage sites. Not the 2019 pangolin nor RaTG13. Examine figure 4 in that article closely, and you will note the QTQTNS amino acids before the furin cleavage sites, which are being ‘lost’ in some cell passage experiments, exist in Covid-19, RaTG13, pangolin 19, and no other isolate.
Gary Whittaker (Cornell University) has written at least ten articles trying to determine the origin of the Covid-19 furin cleavage site, and is very interested in F13 wall sample having the furin cleavage site. Both Whittaker and Los Alamos National laboratory (Alan Perelson) express supreme interest in F13 wall sample.
Dr. Gao references all three F13 wall sample isolates in Figure 2B phylogenic tree of his February 2022 article. The last two of the F13 wall samples were taken by the Beijing CDC in the 3rd or 4th weeks in January 2020.
Jonathan Pekar would not rule out the possibility of different sources for lineages A and B Covid-19.
“the pandemic most likely began with at least two separate zoonotic transmissions starting no earlier than November 2019, with a lineage A virus jumping into humans after the introduction of a lineage B virus.”—in the article, ‘SARS-CoV-2 emergence very likely resulted from at least two zoonotic events’, by Jonathan Pekar, Andrew Magee, Michael Worobey, and many others
Sudhir Kumar sees one progenitor coronavirus for lineages A and B, but lineage B lacked lineage A variants as ancestors.
“These facts support the inference that coronaviruses lacking ‘A’ variants were the
ancestors of Wuhan-1 and other genomes sampled in December 2019 in China. Therefore, we conclude that Wuhan-1 was not the direct ancestor of all the early coronavirus infections globally.”—–in the article, ‘An Evolutionary Portrait of the Progenitor SARS-CoV-2 and Its Dominant Offshoots in COVID-19 Pandemic’, Sudhir Kumar , Qiqing Tao, and others
Kumar would say one progenitor source coronavirus for lineages A and B is likely, but lineage A coronaviruses were not ancestors to Wuhan-person-1 (lineage B). Why not just do a molecular analysis of the F13 wall sample, and make public the photographs taken of it, and the origin of the B lineage of Covid-19 may get solved. And standardize the need to determine the size (the diameter in micrometers) of the particles that contain the virons for any future outbreaks, and publish photos of the samples in their environmental as soon as possible.
William Gallaher retired microbiologist at LSU created a PDF breakpoint map for NC_045512 genome which may be downloaded at, https://virological.org/t/tackling-rumors-of-a-suspicious-origin-of-ncov2019/384/19 at the bottom of that page. Shows all breakpoints for that NC_045512 genome that facilitate recombination events. .
“the two most unique peptide sequences of SARS-CoV-2 related to its ability to infect human beings and spread rapaciously, the RBD and furin cleavage site, are unified by being preceded by the CAGAC/CAGAT motif (breakpoints)……CAGAC disrupts the processivity of the viral RNA polymerase complex down its template, and facilitates, albeit rarely, copy-choice errors capable of creating potentially dangerous recombinants to humankind….This breakpoint, 23577CAGAC in MERS and 23300CAGAC in SARS-CoV-2 (double-underlined in the pdf) is identical in both viruses at the same relative position in the S1 protein sequence, where it defines an identical dipeptide, QT.”
Also see Gallagher’s article, ‘A palindromic RNA sequence as a common breakpoint contributor to copy‑choice recombination in SARS‑COV‑2’.
Setting aside Gallagher’s theory that important location breakpoints in NC_045512.2 genome (and there appears to be at least one hundred) shows it clearly originated in nature, the reverse can be argued because restriction site enzymes have found at important locations in Covid-19 genome indicating possible laboratory origin. Gallaher’s coming out of retirement taking supreme interest in NC_045512.2 (Wuhan-Hu-1) regarding the origin of Covid-19 at such an early date March 2020 is amazing.
A software BLAST run on NCBI (on three different dates) website shows NC_045512.2 is 100% nucleotide identical to later date isolates,
OK372407.1 collected July 20, 2020 Tennessee
MZ722702.1 collected 12/21/2020 Los Angeles
MW562722.1 collected 12/31/2020 Utah
and identical to many other later date isolates. https://blast.ncbi.nlm.nih.gov/Blast.cgi?PAGE=Nucleotides&PROGRAM=blastn&QUERY=NC_045512.2&DATABASE=nr&MEGABLAST=on&BLAST_PROGRAMS=megaBlast&LINK_LOC=nuccore&PAGE_TYPE=BlastSearch
Is this identicalness due a founder effect of a progenitor coronavirus, or does this identicalness mean that the source coronavirus for lineage B is still active and not restricted to HSM or its locale? Note this is a question, and not a conclusion.
“a founder effect: a genetic bottleneck that occurs when, … a new type is established from a small isolated number of infections.”——- ‘Genetic Study Three Variants of SARS-Cov-2’ — sci-news.com
“In the context of SARS-CoV-2, and other viral pathogens, founder effects result from a chance colonization event allowing a new population of viral lineages to emerge. When a chance colonization event occurs, the growth of a new population of viral lineages can give the impression that one lineage has a growth advantage over others (Rambaut et al., 2004; Ruan et al., 2021)”, in the article, “A repeat pattern of founder events for SARS-CoV-2 variants in Alaska”, by Tracie Haan, Lisa . Smith, and many others.
Even though Dr Gao doesn’t reference strain, BetaCoV/Wuhan/IPBCAMS-WH-01/2019 EPI_ISL_402123 (GISAID) MT019529 (NCBI) age 65 years old, sample taken December 23, 2019, earliest known human sample. Pekar and Worobey re-analyzed that sequence as being identical to Wuhan-human-1.
“reanalysis of sequence data from the earliest sampled viruses found that three previously reported mutations in IPBCAMS-WH-01 were spurious, and the genome was, in fact, identical to the Hu-1 reference genome” .”—in the article, ‘SARS-CoV-2 emergence very likely resulted from at least two zoonotic events’, by Jonathan Pekar, Andrew Magee, Michael Worobey, and many others
IPBCAMS = Institute of Pathogen Biology, Chinese Academy of Medical Sciences in Beijing
Correction to my above comment. I didn’t mean to reference ‘OM035668.1 32 year old, and OM065385.1 a 54 year old’, in the comment above. But rather, MN996528.1 (Dec. 30 2019-WIV04-49 year old female?) and MN996530.1 (Dec. 30, 2019-WIV06) who were in HSM in December 2019. Both 100% identical and 100% query cover to Wuhan-Hu-1/NC_045512.2 in NCBI BLAST. Should we not expect the source of these three Covid-19 isolates and the eventual F13 sample, to have a different histological profile, Ct count and viral load and infectivity, December 20-25, 2019, than on January 1, 2020 when Beijing CDC takes samples. But comparing Wuhan-Hu-1/NC_045512.2 on December 26 to F13 sample January 1, identical, the histological profile of their source didn’t change, or F13 and F54 themselves didn’t change from December 26. If F13 sample was on the HSM stall wall December 26, it showed no decay due to its half-life, in comparison to Wuhan-Hu-1 in time snapshot December 26. Was the source of the four isolates ‘reproducible’ at different times, a zoonotic event? Why was F13 wall sample (and F54) relatively ‘fresh’, high viral load and infectivity January 1, 2020, apparently not aerosol transmitted.
On May 31, 2021 2.59 pm, I made a comment regarding Atlanta CDC bat coronavirus BtKy72 at website,
https://dnascience.plos.org/2021/03/11/on-the-anniversary-of-the-pandemic-considering-the-bioweapon-hypothesis/
Questions for Atlanta CDC scientists Ying Tao and Suxiang Tong who attempted to sequence bat coronavirus BtKy72 in April 2019
Reasons for the questions to scientists Tao and Tong: Because “Complete genome sequencing was not performed due to limited viral loads in fecal samples” for BtKy72 bat coronavirus in May 2019, the existential integrity and validity of that coronavirus may be in question. Only by verifying the existential validity and integrity of BtKy72 coronavirus (distant cousin coronavirus to Covid-19), can the evolutionary history of Covid-19 coronavirus be verified and insured.
Tao and Tong state in their May 2019 article, regarding coronavirus BtKy72, “Complete genome sequencing was not performed due to limited viral loads in fecal samples from the other four betacoronavirus-positive bats”. On May 5, 2019, when you sent your article, “Complete Genome Sequence of a Severe Acute Respiratory Syndrome-Related Coronavirus from Kenyan Bats”, out for publication, what was the total nucleotide count for BtKy72 sequence on that day? How was BtKy72 genome completed? What exact date did Tao and Tong complete the “complete genome” for BtKy72? Who was that “complete genome” shared with in 2019? Who was the ‘complete genome for BtKy72’ shared with in 2020, before February 5, 2020 filing date? E-mails.
How many sequences from bat coronavirus BM48-31 were used to create primers to sequence BtKy72? What was the total length of the sequences from BM48-31 coronavirus, that were incorporated in BtKy72’s genome? Who instructed or suggested you to use sequences from BM48-31 to create primers, to sequence BtKy72? E-mails.
We don’t see an assembly method or sequencing technology in the NCBI entry for BtKy72, nor in the May 2019 article. Can you provide a complete typed written account as to how BtKy72 was sequenced, especially the steps taken in May through December 2019.
Did any non-Atlanta CDC person help or assist you in your attempted sequencing of BtKy72 coronavirus before you published your article in May 2019? Who? When? E-mails.
Did any non-Atlanta CDC person help you sequence BtKy72 coronavirus, after you published your article in May 2019? Who? When?
How did you ‘complete’ the genome sequence for BtKy72, after you published your article in May 2019, after stating that you had “limited viral loads in fecal samples”? If you used different swabs containing fecal samples, from which collection site in Kenya were that or those swabs samples collected from?
Did anyone at the Atlanta CDC suggest or ask you to isolate and sequence BtKy72, at anytime in 2019? Who? Can you provide e-mails to that extent? Did any non-Atlanta CDC person suggest or ask you to isolate and sequence BtKy72, in 2019? Who?
Did you have any e-mail or phone contacts with anyone outside of the Atlanta CDC regarding bat coronavirus BtKy72 during the year 2019? Who? What was the nature of those contacts.
Did you send any e-mails to anyone in Wuhan or Beijing China in 2019? To whom did you send them?
Who filed the virological sequences for BtKy72 with NCBI on Feb 5, 2020? Can you produce copies of all documentation pertaining that filing?
.
Did you ever try to determine the subspecies of BtKy72 using cytochrome (cytb) DNA extracted from the feces or swabs? Why not? Subspecies sinicus, affinis, blasii?
Question for Ralph Baric — Where did you obtain the genome for BtKy72 that you used to create the phylogenic trees (Figures 2B and 2C) in the Feb. 5, 2020 article, ‘The species Severe acute respiratory syndrome related coronavirus: classifying 2019-nCoV and naming it SARS-CoV-2’, by Ralph Baric, Christian Drosten, and others (Coronavirus Study Group) from? When did you obtain that genome? Did you give a copy of BtKy72 genome to anyone else in 2019? Who? In 2020? Who? E-mails related.
Question for Christian Drosten — Where did you obtain the genome for BtKy72 that you used to create the E-sarbeco-assay and N-Sarbeco-oligos in the ANNEX of the article ‘Diagnostic detection of Wuhan coronavirus 2019 by real-time RTPCR -Protocol and preliminary evaluation as of Jan 13, 2020’ from? When did you obtain that genome? Did you give a copy of BtKy72 genome to anyone else? Who? https://www.who.int/docs/default-source/coronaviruse/wuhan-virus-assay-v1991527e5122341d99287a1b17c111902.pdf January 13, 2020 version
https://www.who.int/docs/default-source/coronaviruse/protocol-v2-1.pdf January 17, 2020 version
Question for the Chinese National CDC in Beijing. They published the article, ‘Genomic characterisation and epidemiology of 2019 novel coronavirus: implications for virus origins and receptor binding’, on the Internet January 29, 2020. Lancet 2020; http://dx.doi.org/10.1016/S0140-6736(20)30251-8. That article’s “Figure 3 phylogenic analysis of full genome of 2019-nCov”, references BtKy72 complete genome, seven day before that genome was filed with NCBI on Feb. 5, 2020. Where Beijing get the pre-knowledge of that genome? The January 29 version has been replaced with a February 20 version on the Internet, to cover up their mistake.