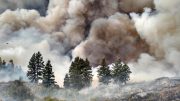
A dry Nevada landscape. New research led by DRI scientists shows that atmospheric thirst is a persistent force in pushing Western landscapes and water supplies toward drought. Credit: Riccardo Panella, DRI
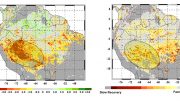
Largest changes centered over Rio Grande region of Southwestern U.S.
In arid Western states, the climate is growing warmer and drier, leading to increased demand for water resources from humans and ecosystems. Now, the atmosphere across much of the U.S. is also demanding a greater share of water than it used to, according to a new study by a team from DRI, University of California, Merced, and Scripps Institution of Oceanography at UC San Diego.
The study was published in the Journal of Hydrometeorology and assessed trends in evaporative demand across the U.S. during a 40-year period from 1980-2020 using five datasets. Evaporative demand, sometimes described as “atmospheric thirst,” is a measure of the potential loss of water from the earth’s surface to the atmosphere based on variables including temperature, humidity, wind speed, and solar radiation.
The team’s findings showed substantial increases in atmospheric thirst across much of the Western U.S. during the past 40 years, with the largest and most robust increases in an area centered around the Rio Grande and Lower Colorado rivers. These regions have experienced changes on the order of two-to-three standard deviations from what was seen during the baseline period of 1980-2000.
“This means that atmospheric thirst conditions in parts of the country are now verging outside of the range that was experienced 20 to 40 years ago, especially in some regions of the Southwest,” said lead author Christine Albano, Ph.D., of DRI. “This is really important to understand, because we know that atmospheric thirst is a persistent force in pushing Western landscapes and water supplies toward drought.”
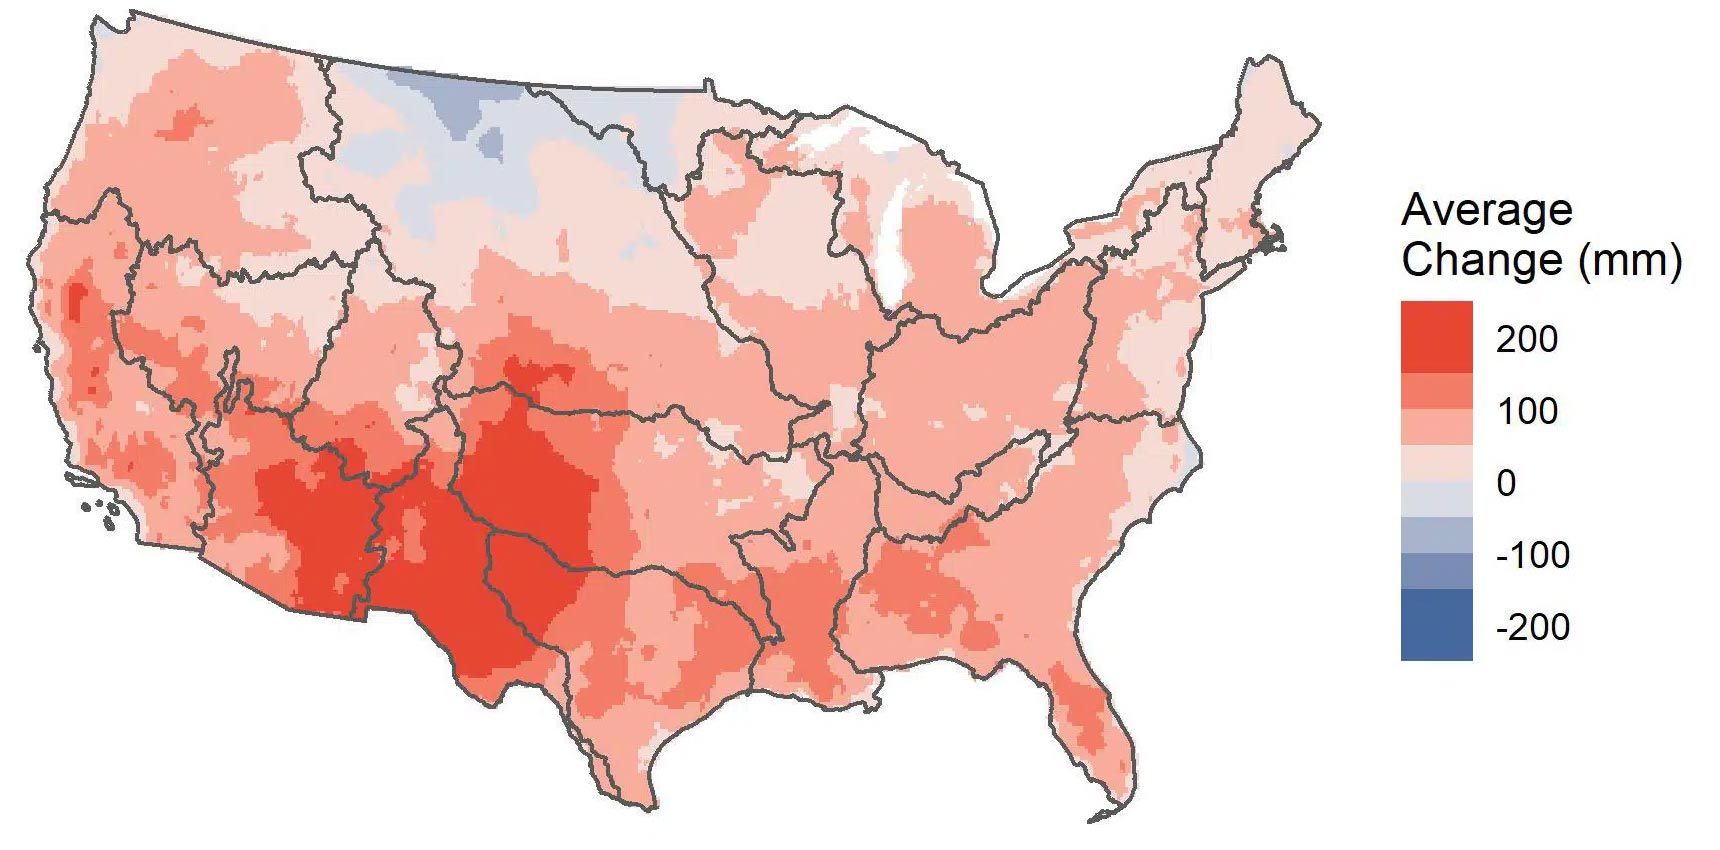
Figure showing changes in atmospheric thirst, measured in terms of reference evapotranspiration (mm), from 1980-2020. The largest changes are centered over the Rio Grande region of the southwestern U.S. Credit: DRI
To learn more about the role that different climate variables play in determining atmospheric thirst, Albano and her colleagues analyzed the relative influences of temperature, wind speed, solar radiation, and humidity. They found that, on average, increases in temperature were responsible for 57 percent of the changes observed in all regions, with humidity (26 percent), wind speed (10 percent), and solar radiation (8 percent) playing lesser roles.
“This study shows the dominant role that warming has played on the increasing evaporative demand and foreshadows the increased water stressors the West faces with continued warming,” said study co-author John Abatzoglou, Ph.D., of University of California, Merced.
For farmers and other water users, increases in atmospheric thirst mean that in the future, more water will be required to meet existing water needs. Some of these changes observed in this study are centered over areas where warming temperatures and lower-than-average precipitation are already creating stress on water supplies.
For example, in the Rio Grande region, the study authors calculated that atmospheric thirst increased by 8 to 15 percent between 1980 and 2020. Holding all else equal and assuming no other changes in management, this means that 8 to 15 percent more water is now required to maintain the same thoroughly-watered crop.
“Our analysis suggests that crops now require more water than they did in the past and can be expected to require more water in the future,” said study co-author Justin Huntington, Ph.D., of DRI.
Other impacts of increased atmospheric thirst include drought, increased forest fire area, and reduced streamflows.
“Our results indicate that, decade by decade, for every drop of precipitation that falls, less and less water is likely to drain into streams, wetlands, aquifers, or other water bodies,” said study co-author Michael Dettinger, Ph.D., of Scripps Institution of Oceanography and DRI. “Resource managers, policymakers, and the public need to be aware of these changes and plan for these impacts now and into the future.”
Members of the team are now developing seasonal to sub-seasonal forecasts of evaporative demand.
“We anticipate these types of forecasts will be important for drought and fire forecasting applications,” said study co-author Dan McEvoy, Ph.D., of DRI.
Reference: “A Multidataset Assessment of Climatic Drivers and Uncertainties of Recent Trends in Evaporative Demand across the Continental United States” by Christine M. Albano, John T. Abatzoglou, Daniel J. McEvoy, Justin L. Huntington, Charles G. Morton, Michael D. Dettinger and Thomas J. Ott, 1 April 2022, Journal of Hydrometeorology.
DOI: 10.1175/JHM-D-21-0163.1
The study team included Christine Albano (DRI), John Abatzoglou (UC Merced), Daniel McEvoy (DRI), Justin Huntington (DRI), Charles Morton (DRI), Michael Dettinger (Scripps Institution of Oceanography/DRI), and Thomas Ott (DRI).
This research was funded by the Sulo and Aileen Maki Endowment Fund to the Desert Research Institute’s Division of Hydrologic Sciences, the National Oceanic and Atmospheric Administration (NOAA) California-Nevada Climate Applications Program (NA17OAR4310284), NOAA National Integrated Drought Information System California-Nevada Drought Early Warning System (NA20OAR4310253C), the NASA Applied Sciences, Water Resources Program (NNX17AF53G), the U.S. Geological Survey Landsat Science Team (140G0118C0007), and USDA-NIFA project (2021-69012-35916).


Why are the changes shown in millimeters (mm) when the color scheme only allows 2 levels between 0 and 100 mm? That means there is only a resolution of 50 mm, with the trailing zero not being significant; it isn’t mentioned what the error range is for the evapo-transpiration rates. Are the authors trying to subjectively inflate the importance of the change by using millimeters when centimeters (cm) would have been adequate (Actually, more appropriate!)? That is, the maximum increases are less than 20 cm (<8") and the uncertainty for a particular color is +/- 2.5 cm (~1"). That is, the accuracy and precision of the measurements don't warrant the use of millimeters.
It seems that the authors didn't have sufficient curiosity to ask the question why there seems to be a problem with drought. After all, the recent average land temperature increases around the world appear to be about 0.18 deg C per decade, or about 0.72 deg C in the last 40 years. However, most of the global average increase has been at night and in the Winter, and the Arctic has been warming at about 2-3X the global average and the Arctic warming is used in the calculation of the global average. Warming should evaporate more water from the oceans and increase the absolute humidity of the air. One might expect increased rainfall, as is common in the tropics — think Hawaii.
If warming evaporates more water from the oceans why wouldn’t it evaporate more from the land where it gets hotter than the oceans.
It probably does. However, the oceans are a virtually unlimited source of water vapor, while land is not only limited, but the soil is much cooler just a few inches below the surface. And, soil can only get so dry, it can’t go negative. So, overall, I’d expect the increased atmospheric water vapor to be able to replenish what is lost by evapo-transpiration under most situations.
So, the question becomes, do droughts happen just because of elevated temperatures, or are there other things that reduce precipitation?