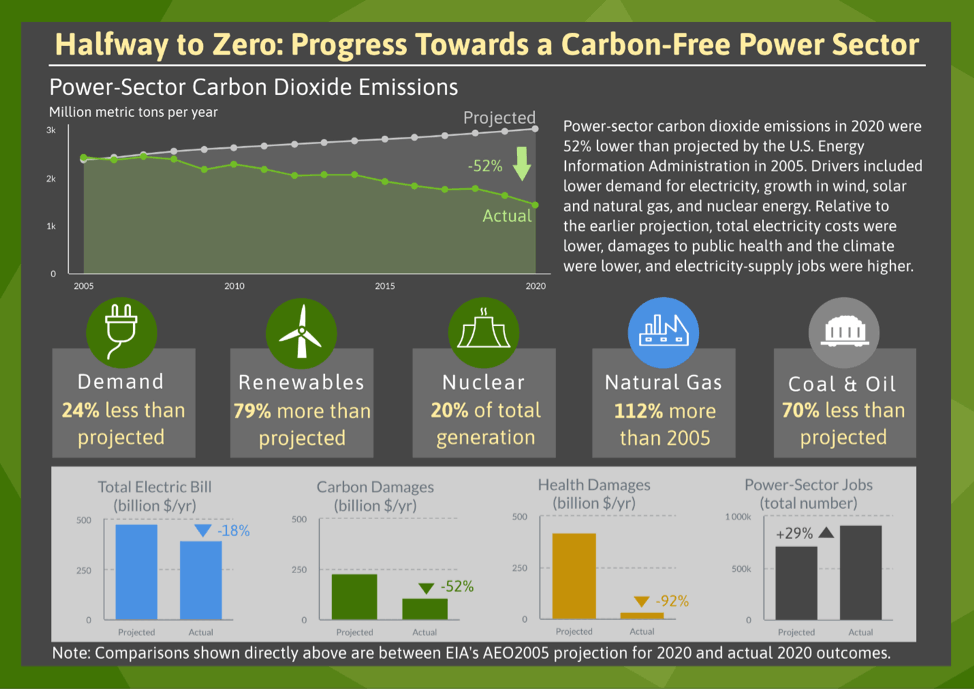
Projected versus actual outcomes for the U.S. power sector. Credit: Berkeley Lab
New Berkeley Lab study reviews progress towards a carbon-free power sector.
Concerns about climate change are driving a growing number of states, utilities, and corporations to set the goal of zeroing out power-sector carbon emissions. To date, 17 states plus Washington, D.C., and Puerto Rico have adopted laws or executive orders to achieve 100% carbon-free electricity in the next couple of decades. Additionally, 46 U.S. utilities have pledged to go carbon-free no later than 2050. Altogether, these goals cover about half of the U.S. population and economy.
These are ambitious targets, but a new look at the past 15 years in the electricity sector shows that large reductions in emissions are possible.
New research from the Department of Energy’s Lawrence Berkeley National Laboratory (Berkeley Lab) analyzes historical trends to examine how much progress the power sector has already made in reducing emissions. The study, “Halfway to Zero: Progress towards a Carbon-Free Power Sector,” looks back at the 2005 Annual Energy Outlook from the Energy Information Administration (EIA), the U.S. government’s official agency for data collection and analysis.
“Business-as-usual projections saw annual carbon dioxide emissions rising from 2,400 to 3,000 million metric tons (MMT) from 2005 to 2020,” said Berkeley Lab scientist Ryan Wiser, lead author of the study. “But actual 2020 emissions fell to only 1,450 MMT. The U.S. cut power sector emissions by 52% below projected levels – we are now ‘halfway to zero.’”
According to the study, relative to projected values, total consumer electricity costs were 18% lower; costs to human health and the climate were 92% and 52% lower, respectively; and the number of jobs in electricity generation was 29% higher.
Drivers of change
From technological advances to policy, the study identified the main drivers from the last 15 years that contributed to lower carbon emissions in the U.S. power sector. Total demand for electricity was almost exactly the same in 2020 as it was in 2005, and was 24% lower than projected fifteen years earlier. “This drop in demand was due in part to sectoral and economic changes, but also to greater energy efficiency driven by policies and technology advancement,” said Wiser.
The researchers found that wind and solar power dramatically outperformed expectations, delivering 13 times more generation in 2020 than projected. This is also a result of technology development and state and federal policies, as prices plummeted for new wind and solar technologies. In addition, nuclear generation has largely held steady, tracking the past projections and helping to ensure no backsliding in carbon emission.
The study found that switching from coal to natural gas for power generation played a big role in lowering carbon emissions. Natural gas generation grew rapidly, driven by the shale gas revolution and low fuel prices.
The researchers also found that changes over the last 15 years had numerous other economic and environmental benefits. For example, total electric bills for consumers were 18% lower in 2020 than previously projected by EIA, for a total savings of $86 billion per year.
According to the study, reduced sulfur and nitrogen emissions led to lower health impacts, such as respiratory disease, with premature deaths falling from 38,000 to 3,100 per year. “Compared to the business-as-usual projection, not only did the nation significantly reduce its carbon footprint, but it did so while also reducing total energy bills and health burdens,” said co-author and Berkeley Lab scientist Dev Millstein.
The study also found that while employment patterns shifted along with changes in the power sector, electricity supply is supporting 200,000 more jobs than might have been the case under the earlier projection.
Looking forward
While a look back shows that dramatic changes in emissions are possible over a 15-year span, the study points out that this does not guarantee the next 15 years will see similar progress.
Given advancements in wind, solar, and battery technologies, these resources are likely to play important near-term roles in further power-sector decarbonization. According to the study, a large share of the capacity needed to approach a zero-carbon power-sector target is already in the development pipeline: about 660 gigawatts (GW) of wind and solar have requested transmission access, more than half of what might be required to approach a zero-carbon power-sector target. Not all proposed projects will be built, but the scale indicates interest in development.
Wiser points out there are significant infrastructure requirements related to scaling up renewable energy. The power sector will have to ensure electricity delivery, reliability, and resilience; build new transmission infrastructure; change planning and grid operations; revise siting processes; and focus attention on impacted workers and communities.
Another major challenge is how to meet the last portion of demand, to ensure a reliable power supply when the wind doesn’t blow and the sun doesn’t shine. The study concludes that further research, development, and demonstration is needed for the numerous technologies that can fill this gap, such as longer-duration energy storage, hydrogen or synthetic fuels, bioenergy, fossil or biomass generation with carbon capture, nuclear energy, geothermal energy, and solar-thermal with storage.
“As the country maps out a plan for further decarbonization, experience from the past 15 years offers two central lessons,” said Wiser. “First, policy and technology advancement are imperative to achieving significant emissions reductions. Second, our ability to predict the future is limited, and so it will be crucial to adapt as we gain policy experience and as technologies advance in unexpected ways.”
Reference: “Halfway to Zero: Progress towards a Carbon-Free Power Sector” by Ryan H Wiser, Dev Millstein, Joseph Rand, Paul Donohoo-Vallett, Patrick Gilman and Trieu Mai, April 2021.
Link
Funding for this research was provided by the Department of Energy’s Office of Energy Efficiency and Renewable Energy.


The latest 2020 LLNL US Energy Flow Graph gives a clearer picture.
Solar 1.25, nuclear 8.25, hydro 2.6, wind 3.0 comes to 15 quads out of 93 total quads, with 35.6 input quads for the electric generation part. As the non electrical side is converted slowly to electric, the grade of the hill trends quickly upwards not downwards since most of the 93 quads will now have to be converted to electric production and use, and many nuclear plants are shutting down.
Even if you look at the electric only part on the right side of the 35.6, you see 12.4 in orange for useful electric output and 23.2 as grey waste heat from generation ie CO2 from the increasing gas and decreasing coal inputs.
The more intermittent energy that goes on the grid, the more it must be matched by nat gas peaker plants. The only difference betrwwen this and the 2005 graphs is the solar+wind has reached about 4% of total primary input, and coal has been considerably replaced by gas. But US gas is now locked in with solar & wind. The nuclear and hydro never changes much year on year.
Take the Ridgemont wind power adverts run by BP during the news shows, the windiest part of the US where BP crows or greenwashes wind. In fact 28% max of that plant energy is from wind and the other 72% is from nat gas, they never give those figures on TV. It can’t change because 30% is about the maximum capacity factor of wind everywhere in the world.
And every nuclear plant that shuts down is always replaced immediately by gas or coal so we are going backwards on that front faster than wind & solar can compensate. In Germany the entire solar & wind has produced negligible CO2 changes for the last decade because they took down so much nuclear and replaced with coal.
The basic problem is the fact that reducing emissions does nothing to lower what CO2 has already been added and which will continue to grow simply because carbon fuels cannot be stopped in an instant.Add that problem to the ill-advised and very expensive plans to capture and store CO2 by the billions of tons and you have a plan that leaves us right where we are…minus the ability to transport the goods and services we all need. The pandemic travel lockdowns and the recent Colonial pipeline incident both show clearly that any further lowering of CO2 emissions will only make the economic devastation worse. Be careful what you wiah for?
Very discouraging how people always seem to talk about the economy as of greater importance than the environment. Where will your economy be when you’re starving to death because of warming induced crop failures?
This article and similar articles are usually based on a false premise. They conflate power with electricity generation. The vast majority of power used comes from oil products and byproducts. Gasoline, diesel, natural gas, propane, etc. Natural gas has proven to be the best solution to reduce emissions. It can fuel any internal combustion engine with minor changes. That would suit a large trucks just as it does buses. It is used in large ships of all scales, and can be used all the way down to small cars and lawnmowers if designed to accept the tanks for compressed natural gas. Vehicles can be fueled for lower prices than gasoline, diesel, or ethanol. That only requires hooking up to natural gas lines already available and using special pumps and ventilation. Worldwide natural gas vehicles do a much larger job with large trucks, buses, ships, and cars, than do electric vehicles. America and Europe are far behind the rest of the world in using this fuel for clean transportation.
Wikipedia
https://en.wikipedia.org › wiki › Natural_gas_vehicle
Worldwide, there were almost 28 million NGVs by 2019. In 2016, the market was led by China (5.4 million), Iran (4 million), India (3 million) …