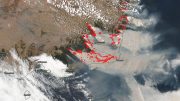
VIIIRS Red-Green-Blue imagery provides a “true-color” view of the smoke. (Note that these images do not represent what a human would see from orbit. In these images, the effect of Rayleigh scattering, which would add “blue haze,” has been taken out.) While useful, it is often hard to distinguish smoke over clouds and, sometimes, over dark ocean surfaces. Credit: NASA/Colin Seftor
A fleet of NASA satellites working together has been analyzing the aerosols and smoke from the massive fires burning in Australia.
The fires in Australia are not just causing devastation locally. The unprecedented conditions that include searing heat combined with historic dryness, have led to the formation of an unusually large number of pyrocumulonimbus (pyrCbs) events. PyroCbs are essentially fire-induced thunderstorms. They are triggered by the uplift of ash, smoke, and burning material via super-heated updrafts. As these materials cool, clouds are formed that behave like traditional thunderstorms but without the accompanying precipitation.
PyroCb events provide a pathway for smoke to reach the stratosphere more than 10 miles (16 km) in altitude. Once in the stratosphere, the smoke can travel thousands of miles from its source, affecting atmospheric conditions globally. The effects of those events — whether the smoke provides a net atmospheric cooling or warming, what happens to underlying clouds, etc.) — is currently the subject of intense study.
NASA is tracking the movement of smoke from the Australian fires lofted, via pyroCbs events, more than 9.3 miles (15 kilometers) high. The smoke is having a dramatic impact on New Zealand, causing severe air quality issues across the county and visibly darkening mountaintop snow.
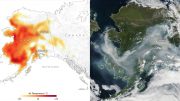
The UV aerosol index is a qualitative product that can easily detect smoke (and dust) over all types of land surfaces. It also has characteristic that is particularly well suited for identifying and tracking smoke from pyroCb events: the higher the smoke plume, the larger the aerosol index value. Values over 10 are often associated with such events. The aerosol index values produced by some of the Australian pyroCb events have rivaled that larges ever recorded. Credit: NASA/Colin Seftor
Two instruments aboard NASA-NOAA’s Suomi National Polar-orbiting Partnership (NPP) satellite — VIIRS and OMPS-NM — provide unique information to characterize and track this smoke cloud. The VIIRS instruments provided a “true-color” view of the smoke with visible imagery. The OMPS series of instruments comprise the next generation of back-scattered UltraViolet (BUV) radiation sensors. OMPS-NM provides unique detection capabilities in cloudy conditions (very common in the South Pacific) that VIIRS does not, so together both instruments track the event globally.
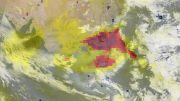
At NASA Goddard, satellite data from the OMPS-NM instrument is used to create an ultraviolet aerosol index to track the aerosols and smoke. The UV index is a qualitative product that can easily detect smoke (and dust) over all types of land surfaces. To enhance and more easily identify the smoke and aerosols, scientists combine the UV aerosol index with RGB information.
Combining UV aerosol index with RGB information is one way to enhance both. Credit: NASA/Colin Seftor
Colin Seftor, research scientist at Goddard said, “The UV index has a characteristic that is particularly well suited for identifying and tracking smoke from pyroCb events: the higher the smoke plume, the larger the aerosol index value. Values over 10 are often associated with such events. The aerosol index values produced by some of the Australian pyroCb events have rivaled that largest values ever recorded.”
Beyond New Zealand, by Jan. 8, the smoke had traveled halfway around Earth, crossing South America, turning the skies hazy and causing colorful sunrises and sunsets.
The smoke is expected to make at least one full circuit around the globe, returning once again to the skies over Australia.
NASA’s satellite instruments are often the first to detect wildfires burning in remote regions, and the locations of new fires are sent directly to land managers worldwide within hours of the satellite overpass. Together, NASA instruments detect actively burning fires, track the transport of smoke from fires, provide information for fire management, and map the extent of changes to ecosystems, based on the extent and severity of burn scars. NASA has a fleet of Earth-observing instruments, many of which contribute to our understanding of fire in the Earth system. Satellites in orbit around the poles provide observations of the entire planet several times per day, whereas satellites in a geostationary orbit provide coarse-resolution imagery of fires, smoke and clouds every five to 15 minutes.
Be the first to comment on "World Path of Smoke and Aerosols From Australian Fires Animated by Fleet of NASA Satellites"