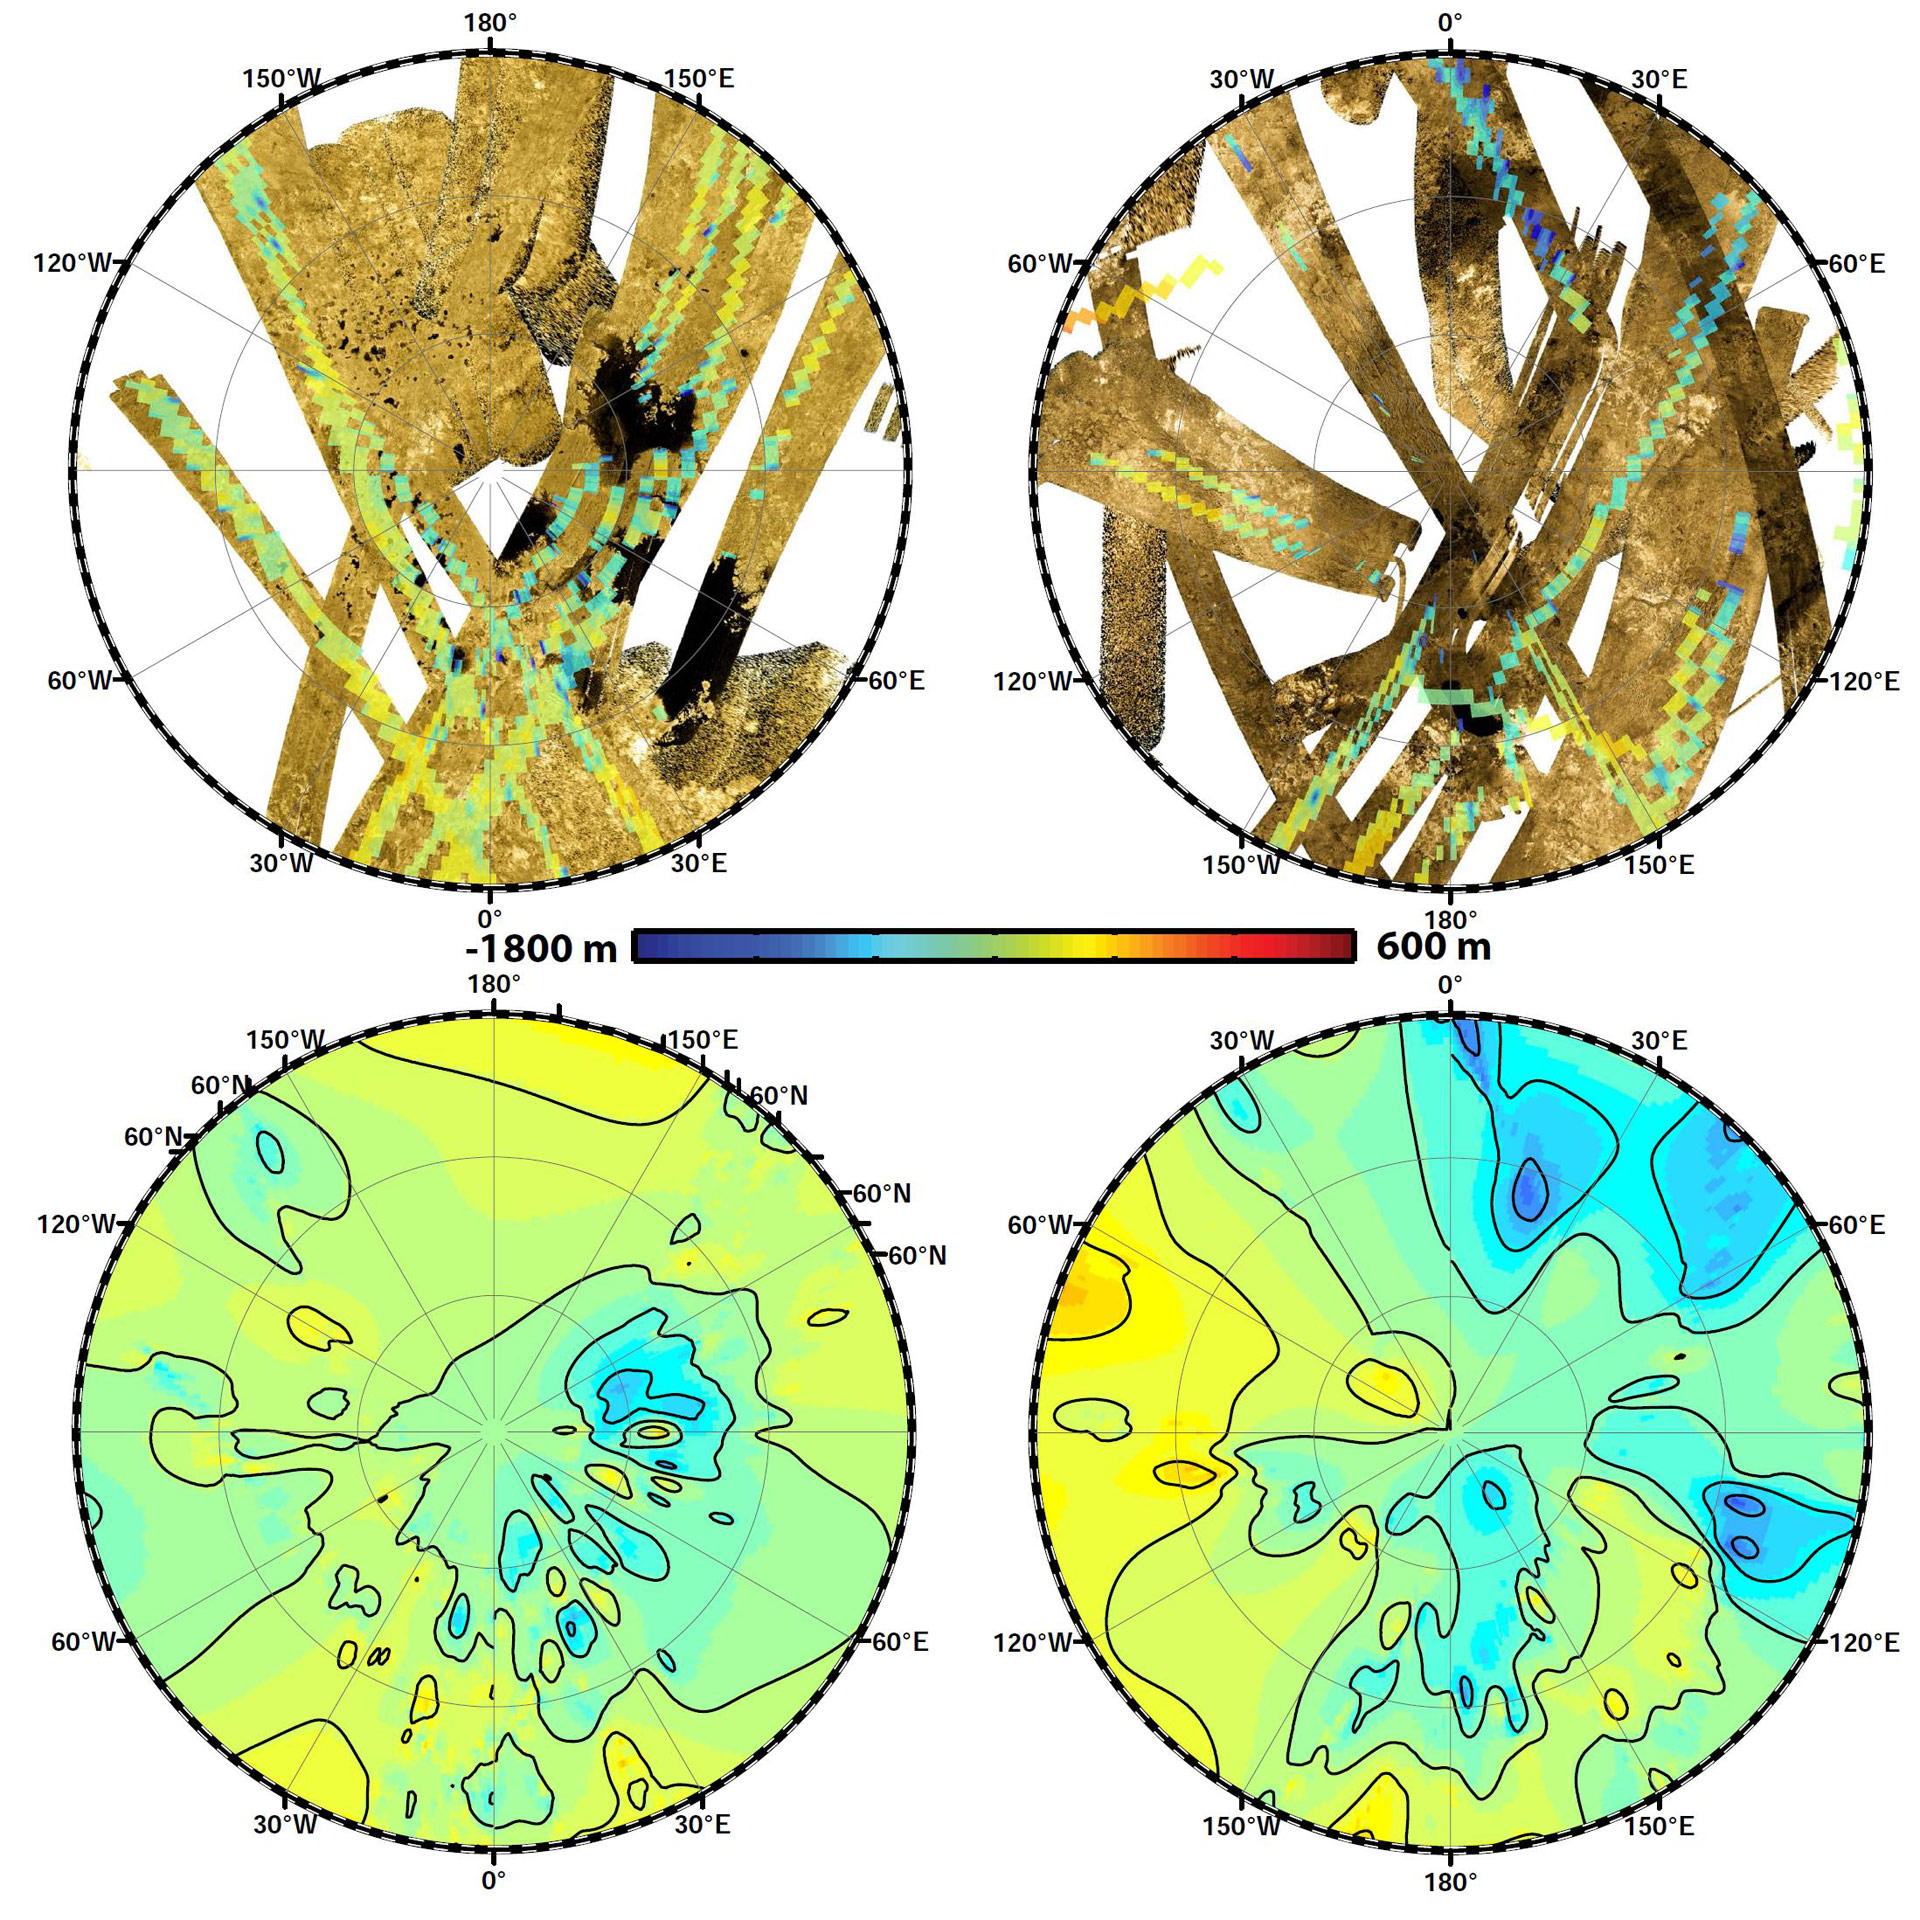
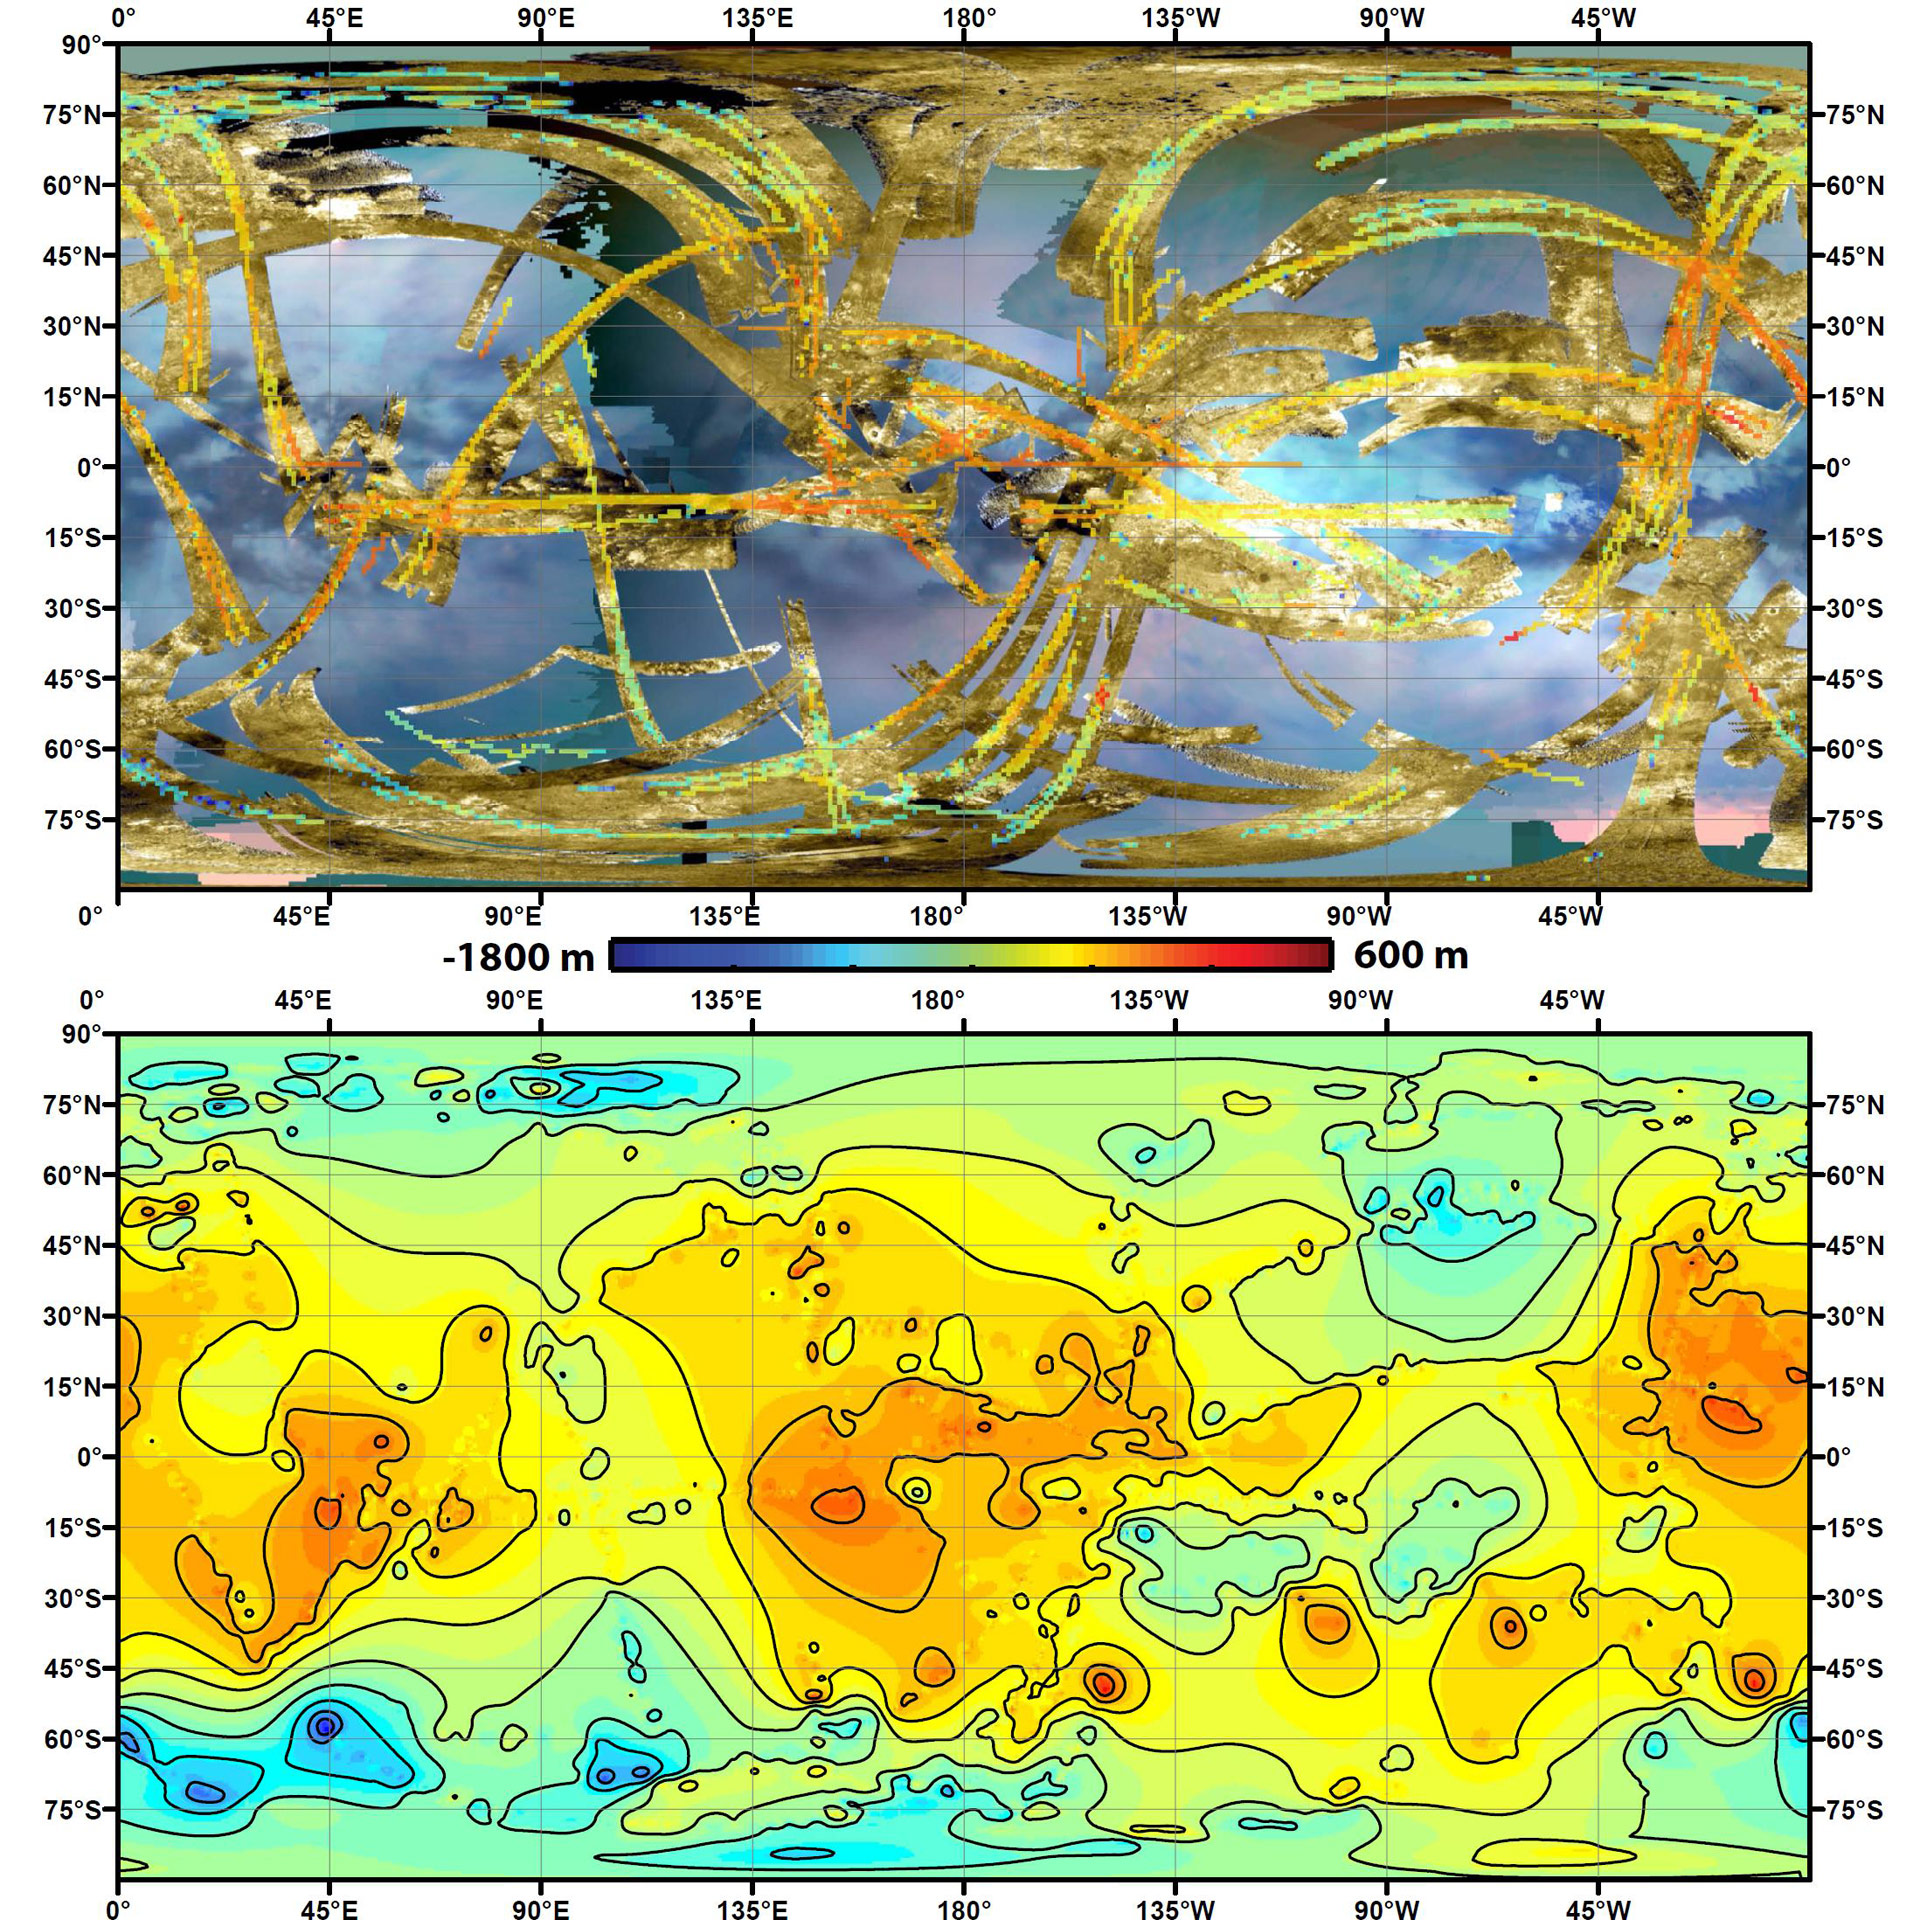
Visible are deep basins at 72 degrees south latitude and 20 degrees east longitude, and a wider basin at 68 degrees south latitude and 105 degrees east longitude. Credit: NASA/JPL-Caltech/ASI/JHUAPL/Cornell/Weizmann
Using data from the Cassini spacecraft, researchers have created the first global topographic map of Saturn’s moon Titan.
Scientists have created the first global topographic map of Saturn’s moon Titan, giving researchers a valuable tool for learning more about one of the most Earth-like and interesting worlds in the solar system. The map was just published as part of a paper in the journal Icarus.
Titan is Saturn’s largest moon — with a radius of about 1,600 miles (2,574 kilometers), it’s bigger than planet Mercury — and is the second-largest moon in the solar system. Scientists care about Titan because it’s the only moon in the solar system known to have clouds, surface liquids and a mysterious, thick atmosphere. The cold atmosphere is mostly nitrogen, like Earth’s, but the organic compound methane on Titan acts the way water vapor does on Earth, forming clouds and falling as rain and carving the surface with rivers. Organic chemicals, derived from methane, are present in Titan’s atmosphere, lakes and rivers and may offer clues about the origins of life.
“Titan has so much interesting activity — like flowing liquids and moving sand dunes — but to understand these processes it’s useful to know how the terrain slopes,” said Ralph Lorenz, a member of the Cassini radar team based at the Johns Hopkins University Applied Physics Laboratory, Laurel, Maryland, who led the map-design team. “It’s especially helpful to those studying hydrology and modeling Titan’s climate and weather, who need to know whether there is high ground or low ground driving their models.”
Titan’s thick haze scatters light in ways that make it very hard for remote cameras to “see” landscape shapes and shadows, the usual approach to measuring topography on planetary bodies. Virtually all the data we have on Titan comes from NASA’s Saturn-orbiting Cassini spacecraft, which has flown past the moon nearly 100 times over the past decade. On many of those flybys, Cassini has used a radar imager, which can peer through the haze, and the radar data can be used to estimate the surface height.
“With this new topographic map, one of the most fascinating and dynamic worlds in our solar system now pops out in 3-D,” said Steve Wall, the deputy team lead of Cassini’s radar team, based at NASA’s Jet Propulsion Laboratory in Pasadena, California. “On Earth, rivers, volcanoes and even weather are closely related to heights of surfaces — we’re now eager to see what we can learn from them on Titan.”
There are challenges, however. “Cassini isn’t orbiting Titan,” Lorenz said. “We have only imaged about half of Titan’s surface, and multiple ‘looks’ or special observations are needed to estimate the surface heights. If you divided Titan into 1-degree by 1-degree [latitude and longitude] squares, only 11 percent of those squares have topography data in them.”
Lorenz’s team used a mathematical process called splining — effectively using smooth, curved surfaces to “join” the areas between grids of existing data. “You can take a spot where there is no data, look how close it is to the nearest data, and use various approaches of averaging and estimating to calculate your best guess,” he said. “If you pick a point, and all the nearby points are high altitude, you’d need a special reason for thinking that point would be lower. We’re mathematically papering over the gaps in our coverage.”

The estimations fit with current knowledge of the moon — that its polar regions are “lower” than areas around the equator, for example — but connecting those points allows scientists to add new layers to their studies of Titan’s surface, especially those modeling how and where Titan’s rivers flow, and the seasonal distribution of its methane rainfall. “The movement of sands and the flow of liquids are influenced by slopes, and mountains can trigger cloud formation and therefore rainfall. This global product now gives modelers a convenient description of this key factor in Titan’s dynamic climate system,” Lorenz said.
The most recent data used to compile the map is from 2012; Lorenz says it could be worth revising when the Cassini mission ends in 2017, when more data will have accumulated, filling some of the gaps in present coverage. “We felt we couldn’t wait and should release an interim product,” he says. “The community has been hoping to get this for a while. I think it will stimulate a lot of interesting work.”
Reference: “A global topographic map of Titan” byRalph D. Lorenz, Bryan W. Stiles, Oded Aharonson, Antoine Lucas, Alexander G. Hayes, Randolph L. Kirk, Howard A. Zebker, Elizabeth P. Turtle, Catherine D. Neish, Ellen R. Stofan, Jason W. Barnes and the Cassini RADAR Team, 18 April 2013, Icarus.
DOI: 10.1016/j.icarus.2013.04.002
The Cassini-Huygens mission is a cooperative project of NASA, the European Space Agency and ASI, the Italian Space Agency. JPL, a division of the California Institute of Technology in Pasadena, manages the mission for NASA’s Science Mission Directorate, Washington. The radar instrument was built by JPL and the Italian Space Agency, working with team members from the United States and several European countries.
Never miss a breakthrough: Join the SciTechDaily newsletter.
Follow us on Google and Google News.