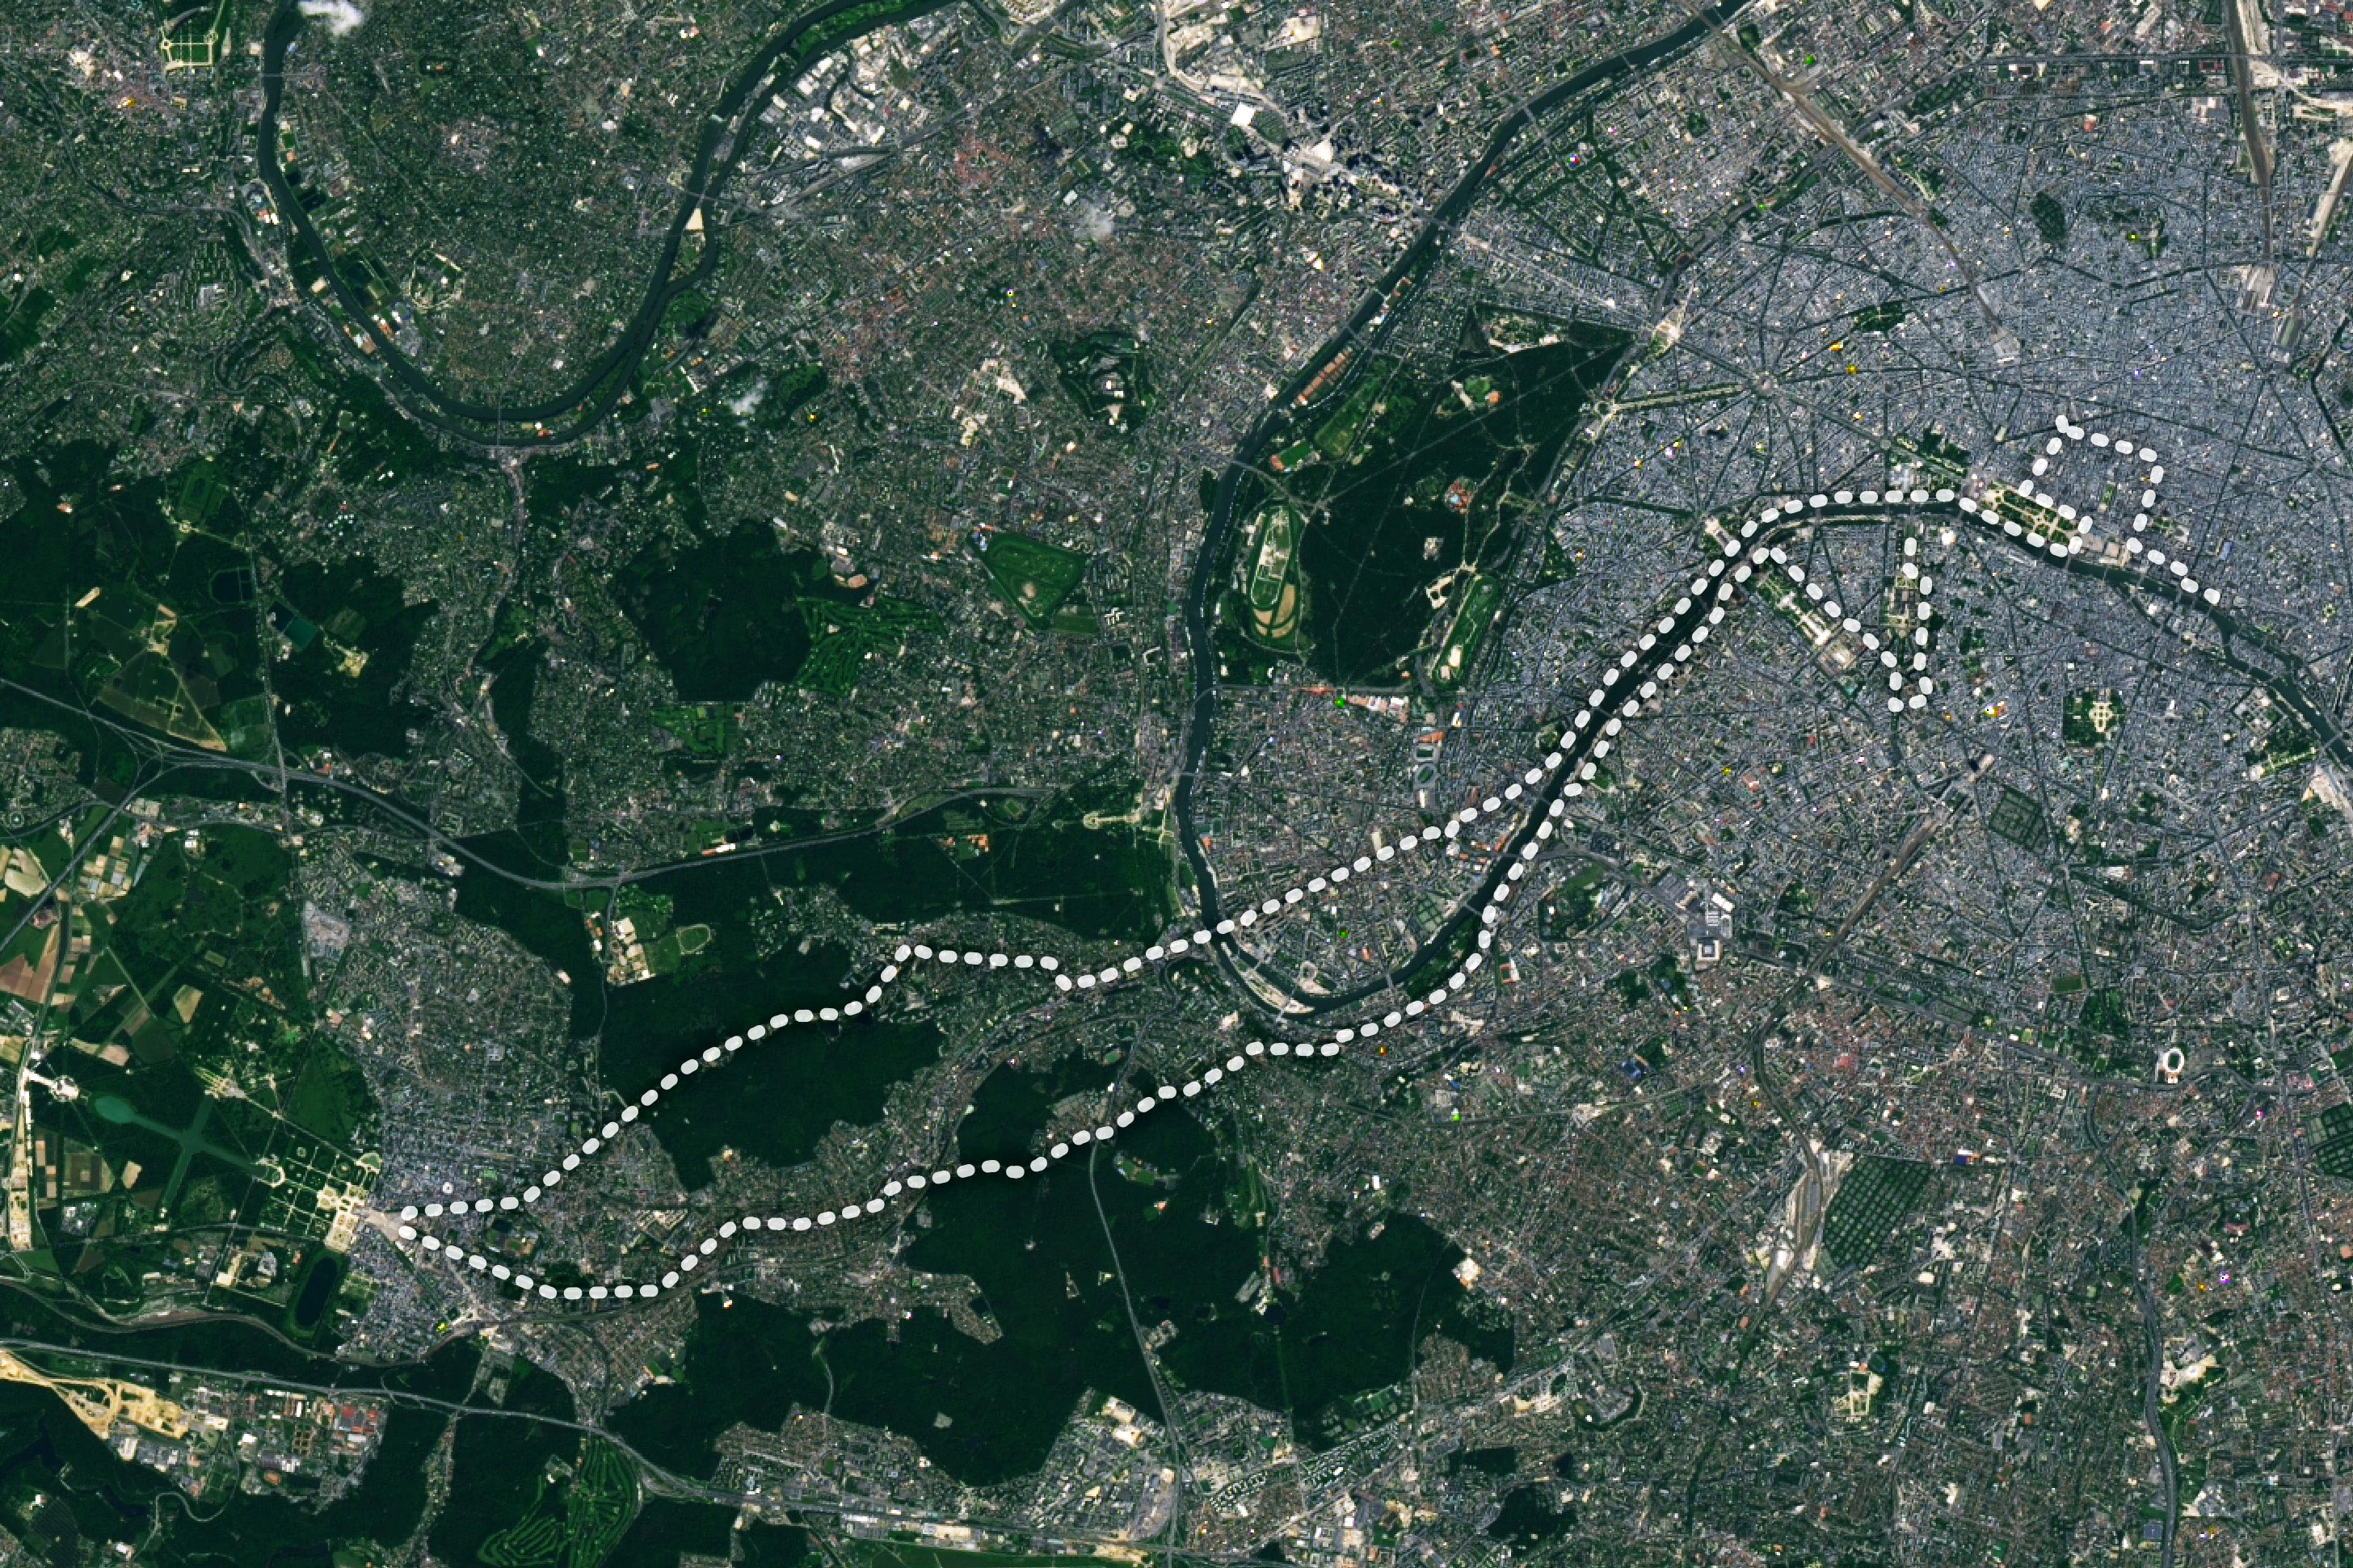
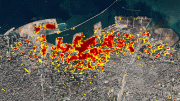
Satellite image of the Paris 2024 Olympics marathon course captured on June 7, 2024, by the Operational Land Imager-2 on Landsat 9.
Over the past century, Paris has warmed significantly, presenting a challenging environment for the 2024 Olympic marathon runners.
The course features tough terrain and historical landmarks, while the athletes also face urban heat effects, exacerbated by limited green spaces and dense architecture. Innovative satellite imaging has improved monitoring of these conditions, offering crucial data to help mitigate heat-related risks for competitors.
Climate Change and Olympic Challenges
Since Paris hosted the Olympic Games a century ago, temperatures in the city have increased by 3.1 degrees Celsius (5.5 degrees Fahrenheit). Hot days with highs above 30°C (86°F) are now nearly three times more frequent than in 1924.
This type of climate shift could pose problems for 2024’s marathon contestants, who already face unusually hilly terrain that some commentators have called one of the most “grueling” and “brutal” Olympic courses ever conceived. On August 10 and 11, runners had to confront two long, punishing hills as they completed a 42-kilometer (26-mile) course rich with historical significance and views of iconic architecture.
Extreme heat can pose a particular risk for endurance athletes competing in outdoor events. During the 2020 Summer Olympics in Tokyo, a British runner collapsed during the 10,000-meter run during sweltering, humid conditions, as did a Japanese athlete during the 50-kilometer race walk. Fortunately for the marathoners competing in Paris, the heat wave that caused problems during the first week of competition has mostly subsided. Recent weather forecasts suggest temperatures will stay below 24°C (75°F) during both the men’s and women’s marathons.
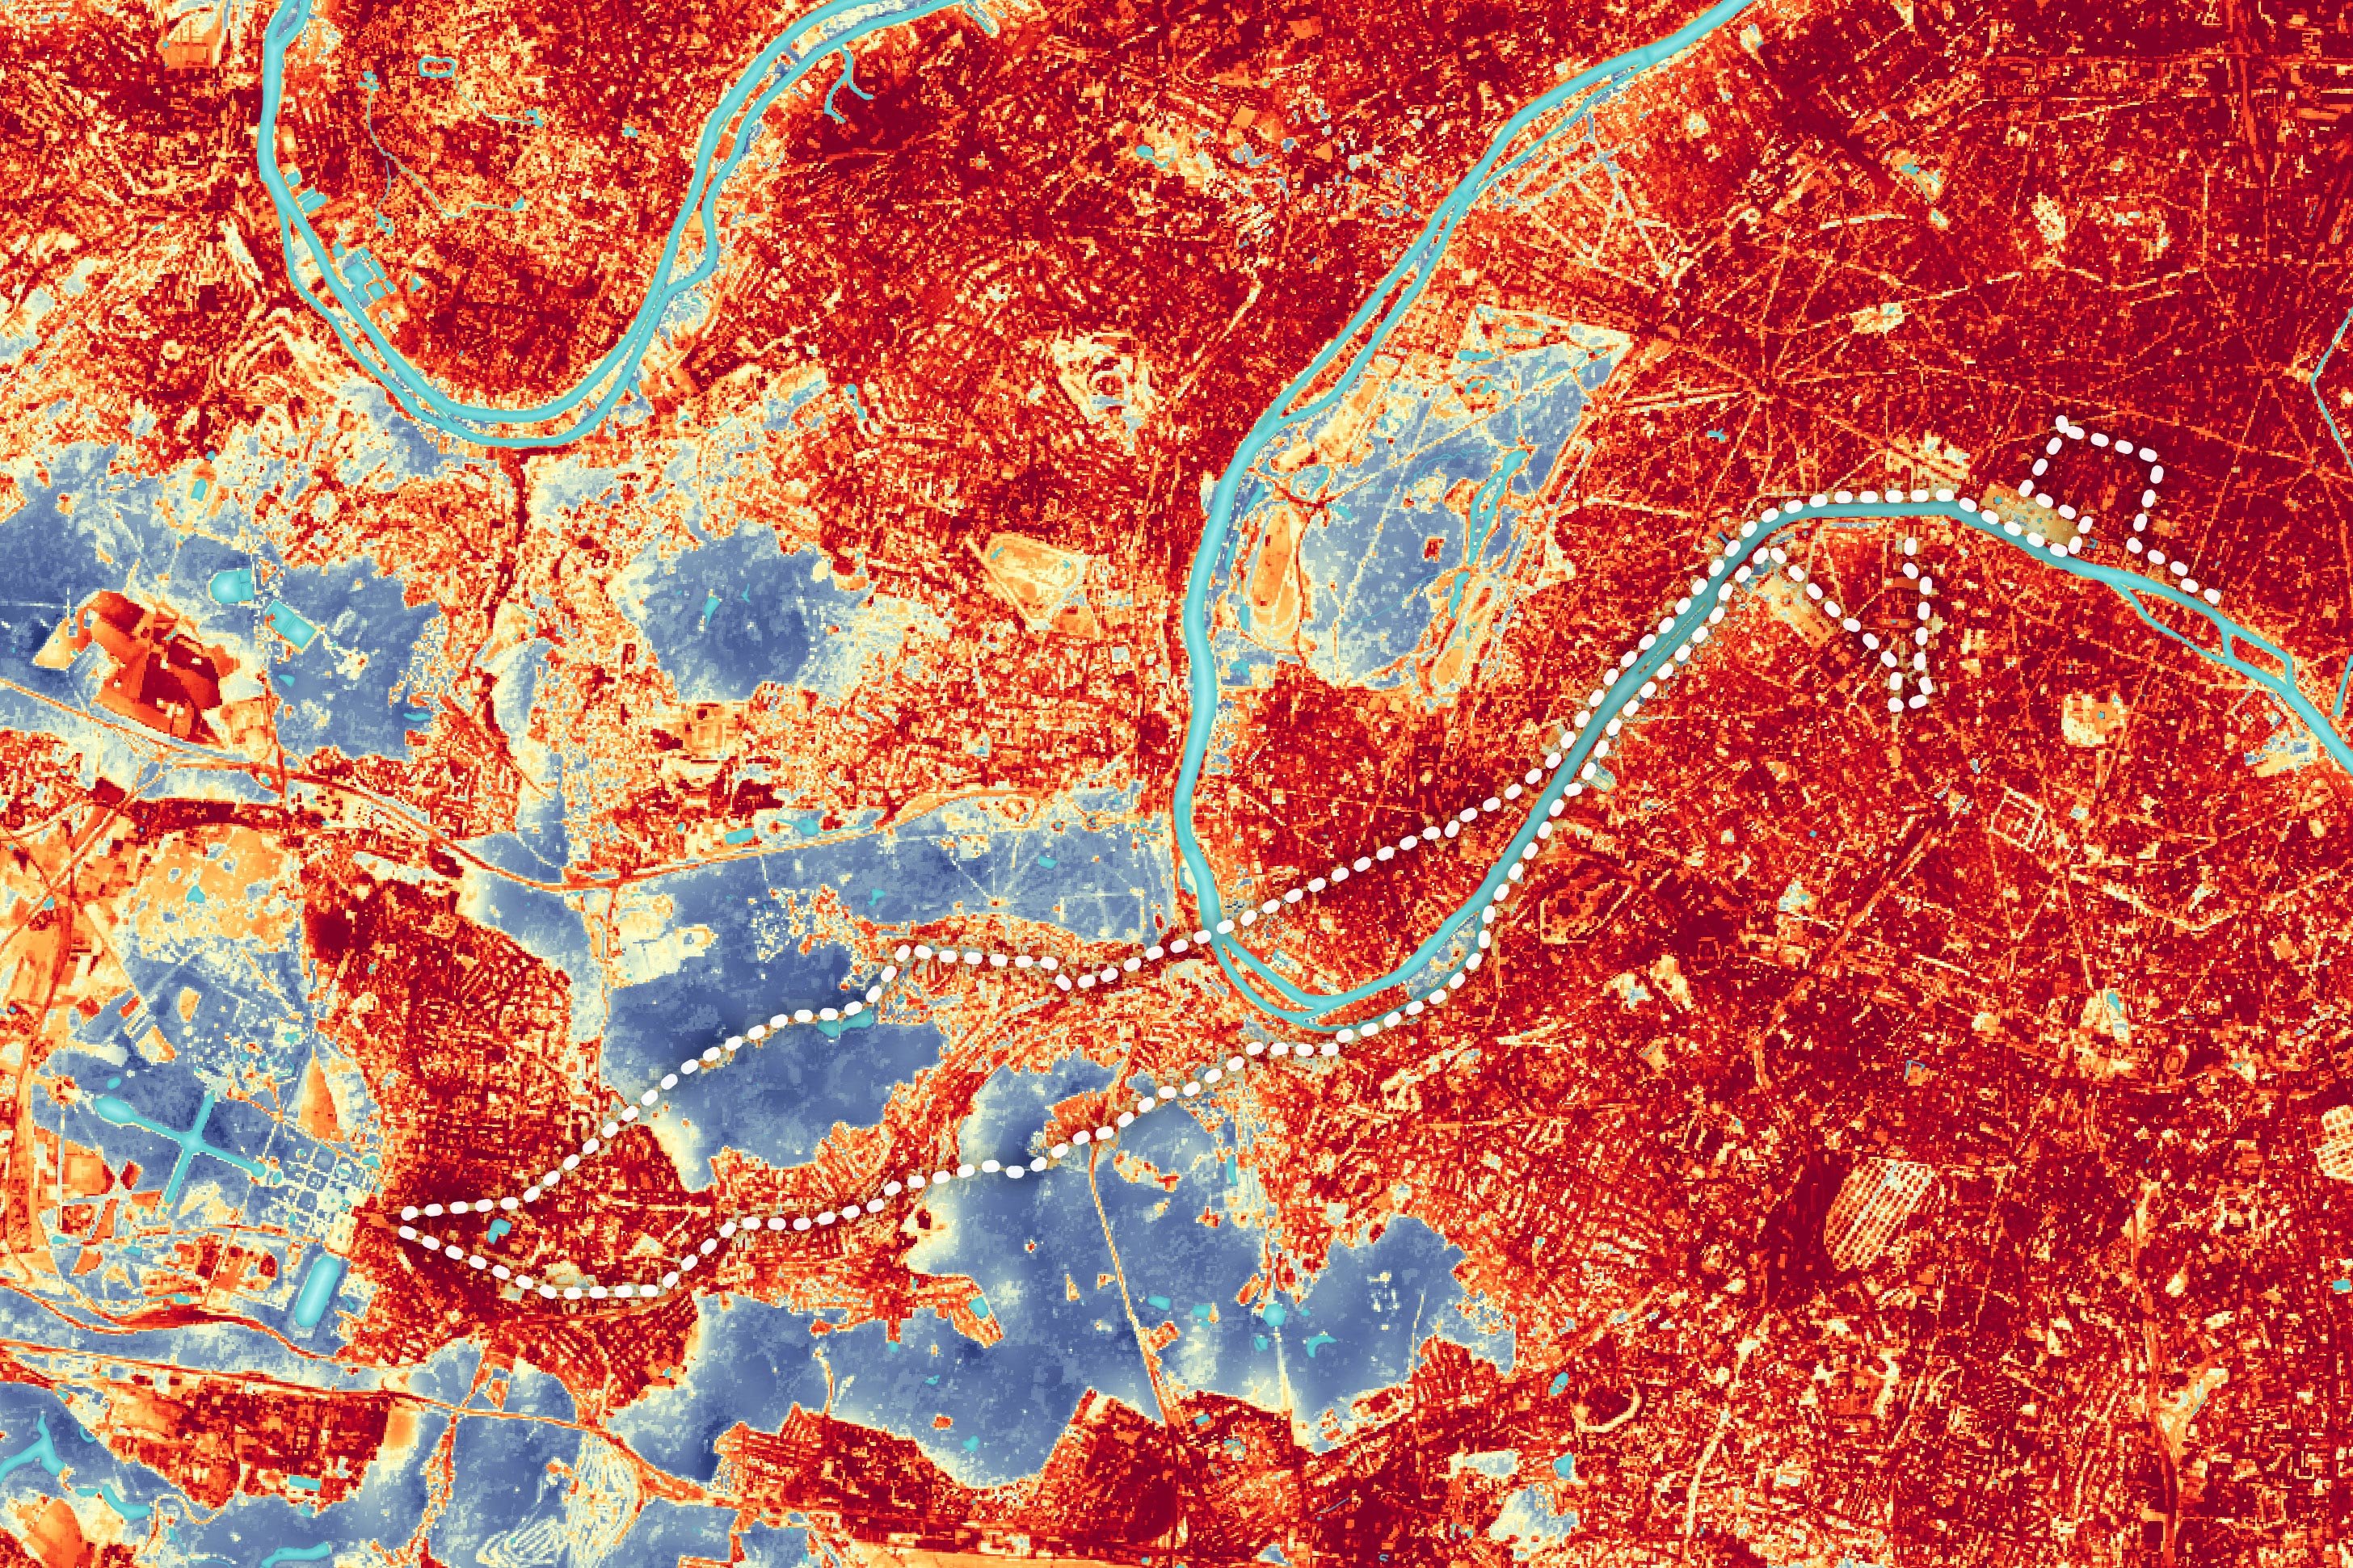
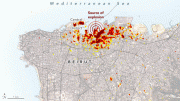
Land surface temperatures of the Paris 2024 Olympics marathon course captured on August 6, 2024, by the Visible Infrared Imaging Radiometer Suite on the NOAA-NASA Suomi NPP satellite.
Advanced Monitoring of Marathon Routes
The map above offers a baseline perspective on how the thermal environment along the marathon route varies on a typical summer day. It shows land surface temperatures (LSTs) observed by the VIIRS (Visible Infrared Imaging Radiometer Suite) on the NOAA-NASA Suomi NPP satellite at 1:40 p.m. local time on August 6, 2024, a clear day when air temperatures peaked at 28°C (82°F). Scientists from NASA’s Jet Propulsion Laboratory “sharpened” the thermal data using machine-learning methods and surface reflectance data from the European Space Agency’s Sentinel-2 satellite. The technique enhanced the resolution of the data, improving it from 375 meters per pixel to about 20 meters per pixel.
Warmer land surface temperatures are shown in red; cooler areas appear blue. Note how parks and other green infrastructure—such as the tree-lined avenues radiating from the Arc de Triomphe—are cooler than features such as buildings, roads, and parking lots. Urban spaces like these are typically constructed from materials that have a high heat capacity and absorb and re-emit the Sun’s heat more than living landscapes such as trees, grass, and gardens.
The effect, known as an urban heat island, can be particularly intense in Paris, partly because the city has less tree cover than many other European cities and an abundance of zinc roofing that is particularly prone to heating up.
Note that the map shows land surface temperatures, not air temperatures. Heat islands are visible in both land surface temperatures and air temperature data, though disparities tend to be more pronounced in land surface temperatures. When the image was acquired on August 6, land surface temperatures varied from highs of 43°C (110°F) near the starting line to lows of 25°C (77°F) in thickly forested areas.
Urban Heat and Its Impact on Athletic Performance
The limited tree cover in the center of Paris is visible in the other image (top of page), which was acquired by the OLI-2 (Operational Land Imager-2) on Landsat 9. The zinc roofing, which appears gray, can soar to temperatures of 90°C (194°F) on hot summer days.
One analysis of satellite data conducted by the European Environment Agency found that green infrastructure—urban forests and parks—cover just 26 percent of Paris, well below the 41 percent average for other European capitals. Such disparities can add up. In a recent analysis of the intensity of urban heat islands for 100 European cities, Paris came out near the top.
The men’s Olympic marathon will begin at 8 a.m. local time on August 10, a day before the women’s marathon. The races will start on wide, paved boulevards in one of the densest parts of Paris, with racers passing several iconic city landmarks, including the Hôtel de Ville, the Palais Garnier opera house, the Place Vendôme, the Louvre, and the Trocadéro.
Adapting to Urban Heat During Marathons
Limited vegetation and dense development in this part of the city will boost temperatures and add to the heat stress that runners experience, according to Ariane Middel, a climatologist at the University of Arizona and the co-author of a study that detailed how variation in microclimates affected heat stress for marathon runners during the 2020 Olympic marathon in Tokyo. “However, the tall buildings on either side of the route and some tree-lined streets will offer runners some shade—a major factor in reducing heat load on the human body on a sunny day,” she said. “Running over grass rather than pavement will not reduce the heat load on the body as much as running in the shade.”
According to Middel, the heat stress on runners should ease some as the course continues through tree-lined boulevards along the Seine River for several kilometers and then drop even more as runners pass through the Fausses-Reposes forest, a former royal forest near Versailles. Likewise, Bois de Meudon (also called Forét domaniale de Meudon), another forest near Versailles, should help cool runners as they loop back toward the area where the race started, she said.
The course mirrors the route of the 1789 Women’s March on Versailles, a key moment during the French Revolution when thousands of women and allies marched through Paris to Versailles. Once there, they besieged the palace and pressured King Louis XVI to ratify the Universal Declaration of the Rights of Man and Citizens.
Even as temperatures rise in Paris and elsewhere, Middel pointed out several ways race planners can mitigate the risks of extreme heat: “Start marathons early in the morning to benefit from cool temperatures and more shade, increase tree cover along courses, and install temporary sunshade structures.”
NASA Earth Observatory images by Wanmei Liang and Michala Garrison, using VIIRS Land Surface Temperature data, marathon route from Github, and Landsat data from the U.S. Geological Survey.


Be the first to comment on "Mapping Marathon Heat With NASA Tech at the Paris Olympics"