NASA’s ICESat-2 has hit an incredible milestone: 2 trillion laser shots fired from orbit!
This Earth-monitoring marvel has been tracking ice sheets, glaciers, forests, and even ocean floors with remarkable precision since 2018. Designed to measure ice, its laser pulses have revealed significant changes in places like Antarctica’s rapidly retreating Vanderford Glacier. With its laser still in top shape, this mission is building a vast, detailed record of Earth’s shifting landscapes, one pulse at a time.
Happy 2 Trillionth Shot, ICESat-2!
NASA’s ICESat-2 satellite just hit an incredible milestone: its laser instrument has fired 2 trillion times in orbit. On March 9 at 12:51 p.m. EDT (16:51:00.268 UTC), the satellite marked this achievement while measuring clouds off the coast of East Antarctica.

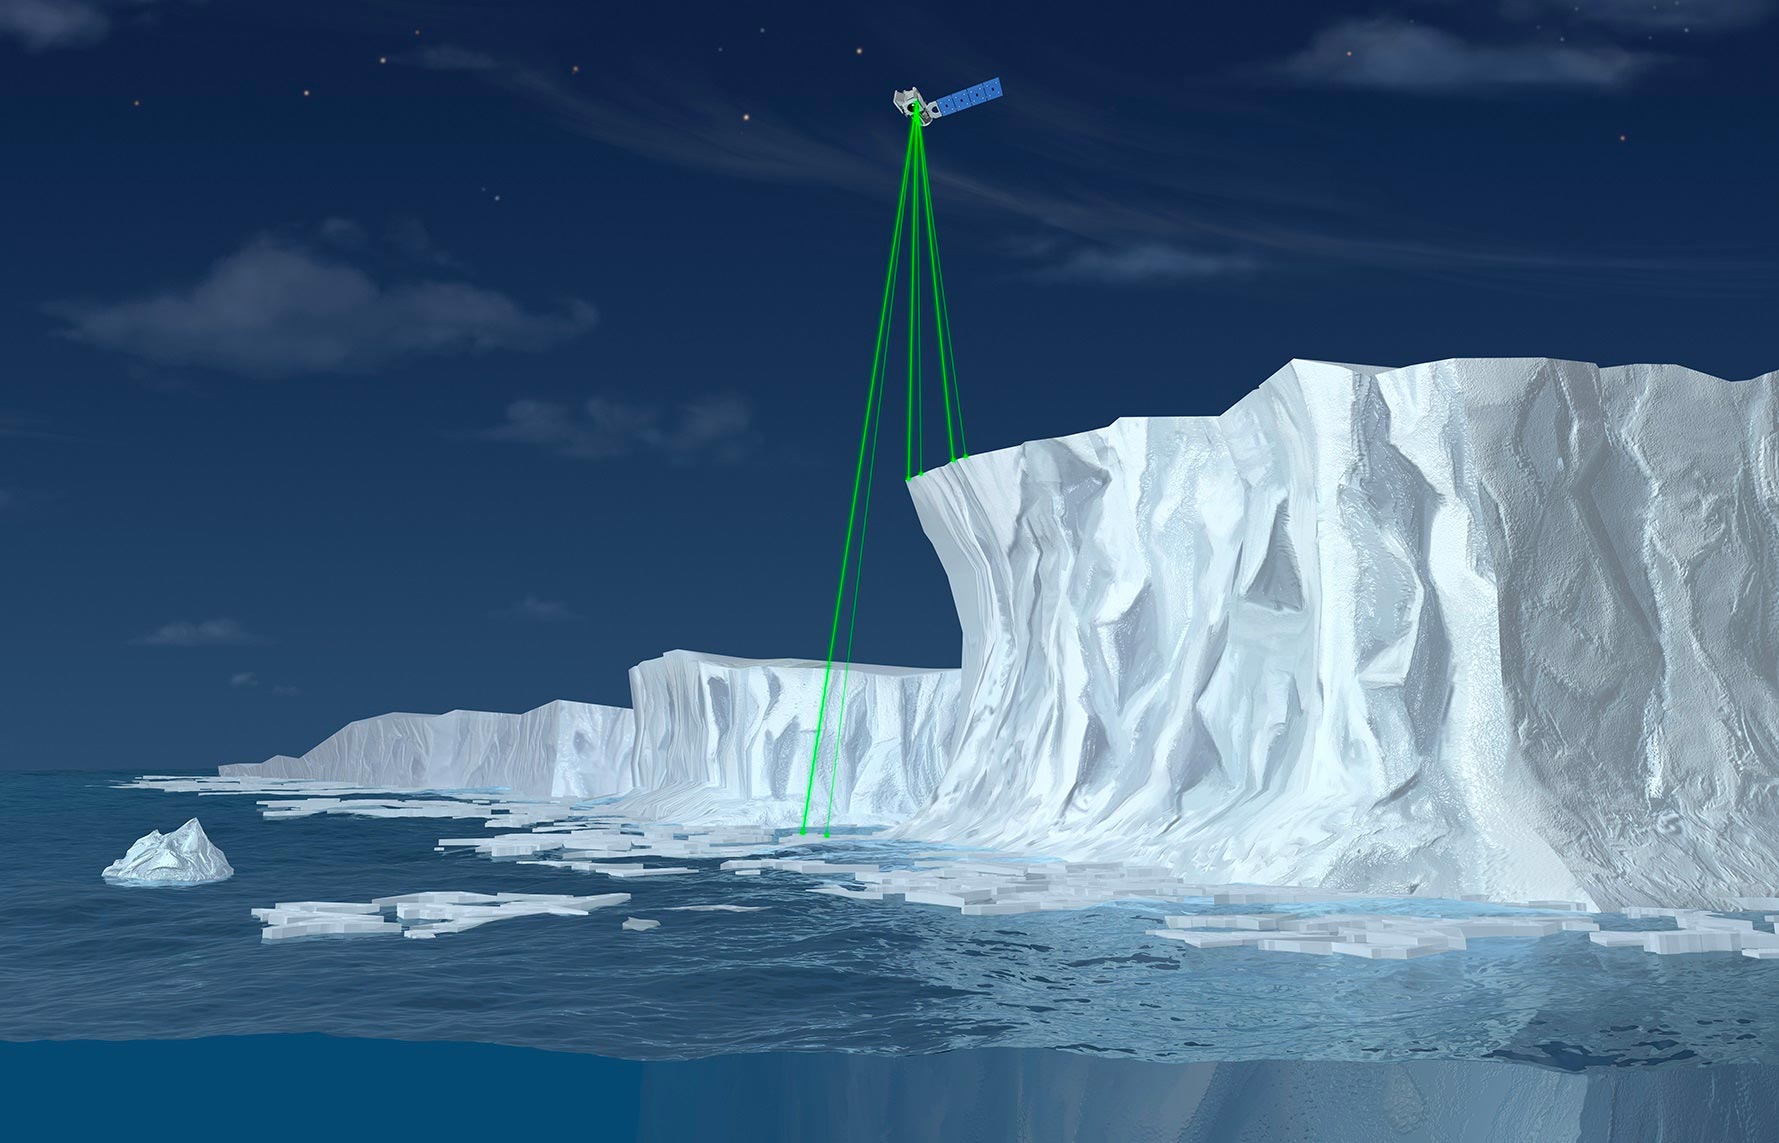
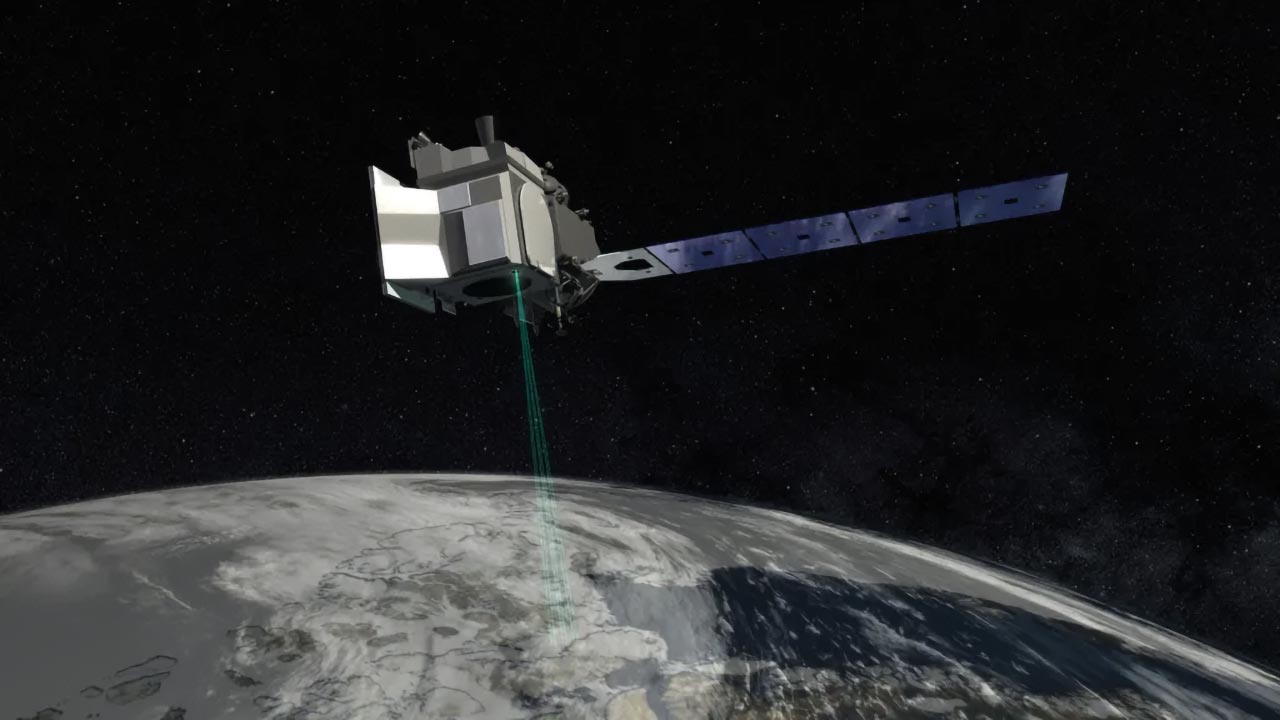
ICESat-2 is equipped with the Advanced Topographic Laser Altimeter System (ATLAS), which sends out rapid pulses of green laser light to precisely measure Earth’s surface elevation. Since launching in September 2018, it has been mapping ice sheets, sea ice, forests, water bodies, and even parts of the ocean floor.
Firing at an incredible 10,000 times per second, ICESat-2 has built a detailed record of Earth’s changing landscapes, including glaciers, sea ice, water reservoirs, forests, and more. It has even detected the coastal seafloor in places.
A Workhorse Laser Still Going Strong
Despite six years and trillions of pulses, the laser remains in excellent condition, according to Anthony Martino, an instrument scientist at NASA’s Goddard Space Flight Center. If it continues at this pace, it could remain operational well into the 2030s. And if needed, a backup laser is on board, ready to take over.
While the primary mission of ICESat-2 is to measure ice, ATLAS operates around the clock and the 2 trillionth shot captured a common sight: clouds. About 79 seconds earlier, it passed over the clear skies of the Antarctic ice sheet as it flows down Vanderford Glacier and into the Southern Ocean.

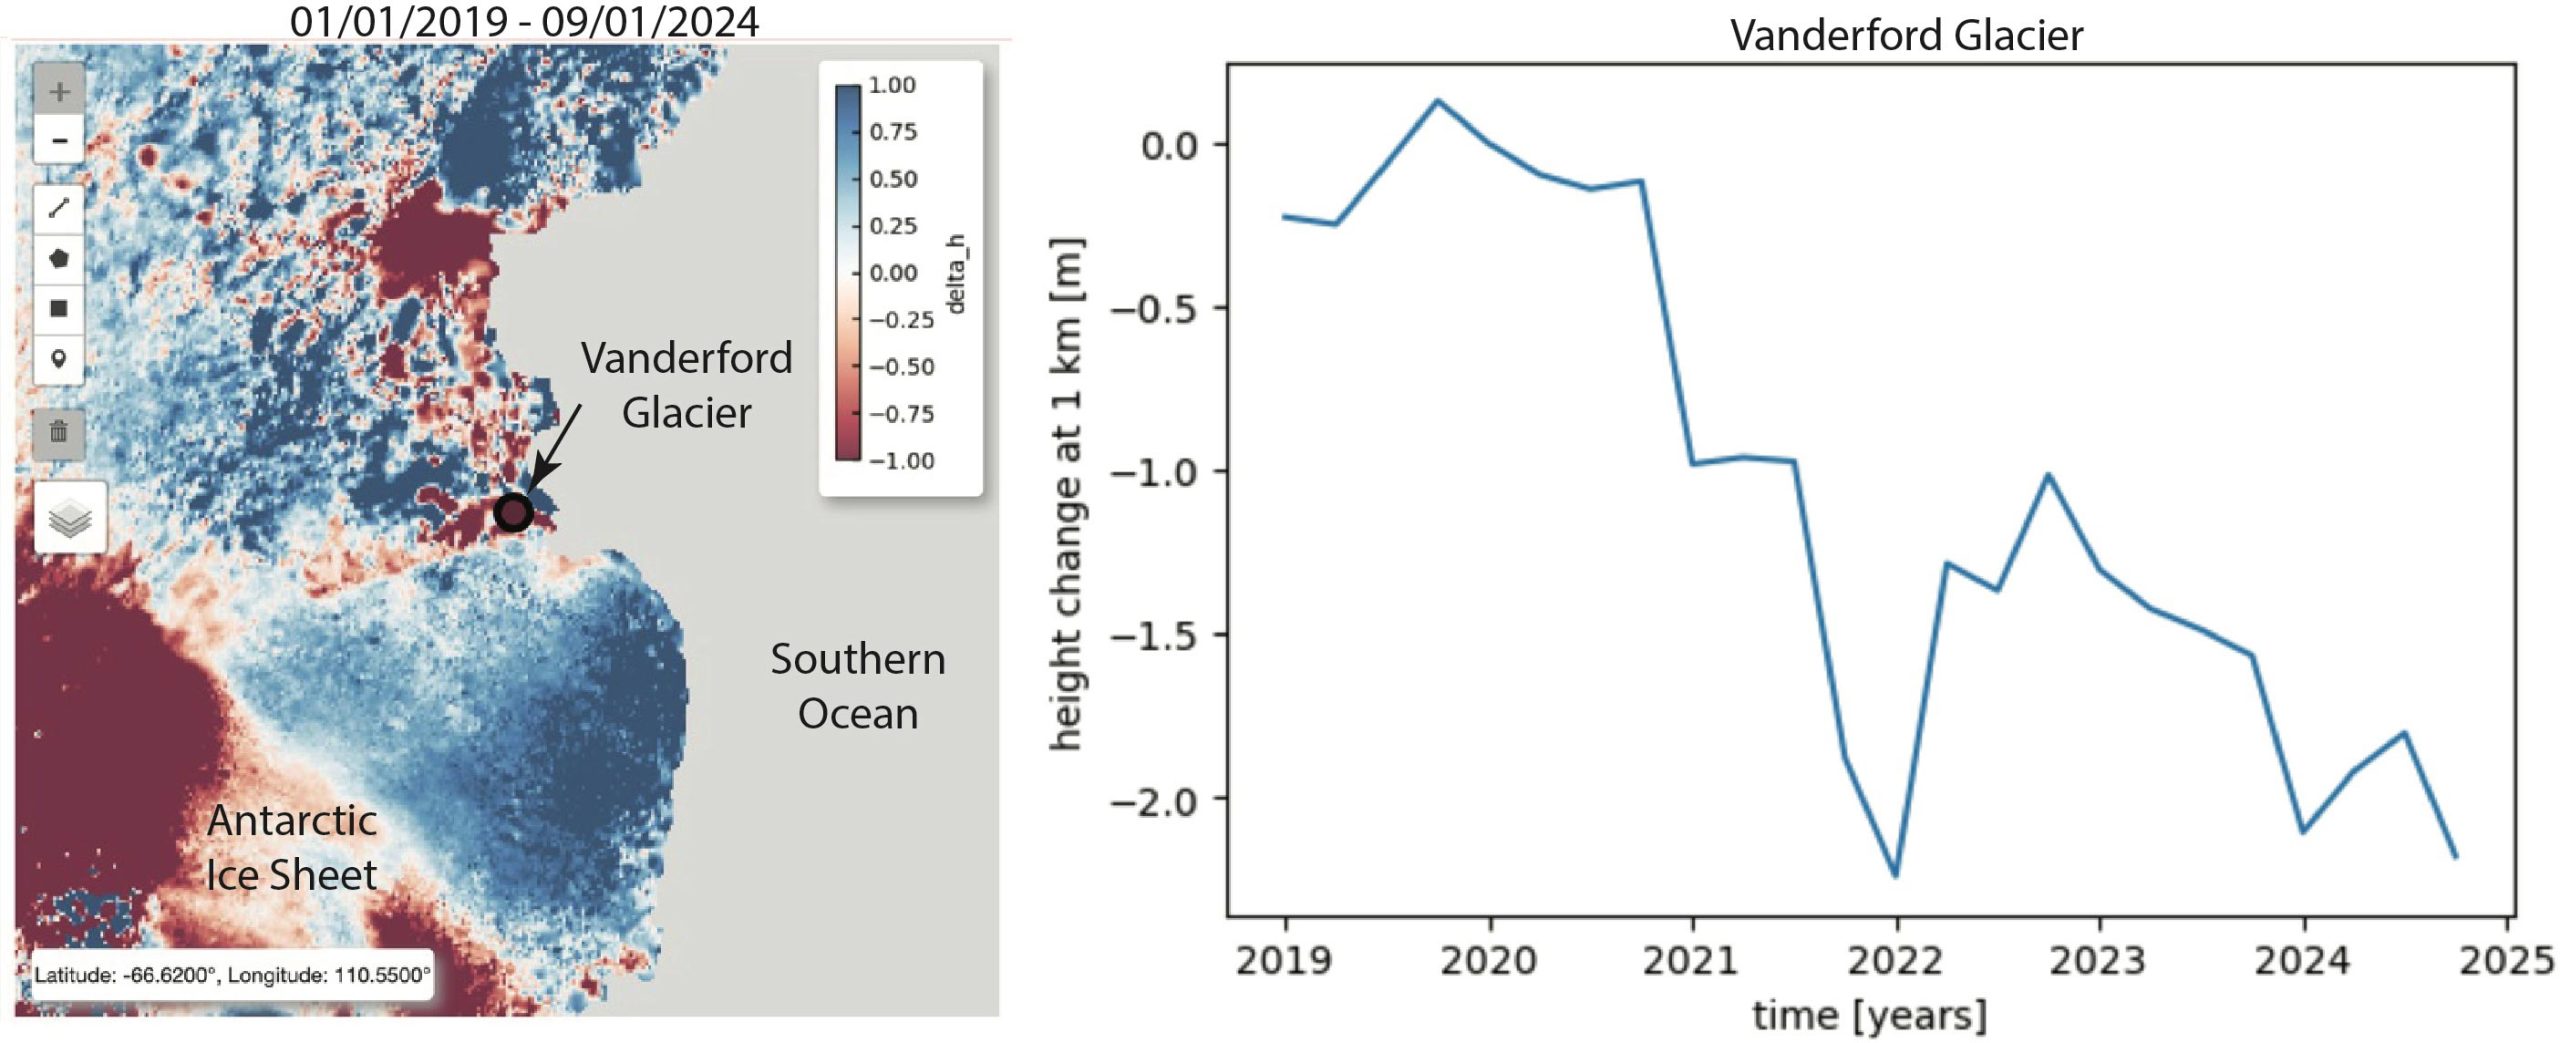
Vanderford Glacier: A Case Study in Change
Vanderford Glacier is East Antarctica’s fastest retreating glacier, as warmer ocean water seeps in to melt it from below, according to a recent study. And it’s a prime example of what scientists can use ICESat-2 data for, said Denis Felikson, ICESat-2 deputy project scientist at NASA Goddard.
Tracking a specific site on Vanderford throughout ICESat-2’s record, for example, shows how the ice surface dropped about six feet between 2019 and 2022, rose a few feet the next year, but then dropped back down in 2024. Zoom out, and researchers can track elevation across the glacier and its surroundings.
A Global Record of Change
“With data from 2 trillion laser shots, and more to come, we have this consistent global record of all of Earth’s ice from space, at glacier scales but also in really fine detail,” Felikson said. “Both of these scales are critical for us to understand how Earth is changing over time.”
NASA’s ICESat-2
ICESat-2 (Ice, Cloud, and land Elevation Satellite-2) is a NASA Earth-observing mission launched in 2018 to precisely measure changes in ice sheets, glaciers, sea ice, forests, and water bodies. Using the Advanced Topographic Laser Altimeter System (ATLAS), it fires 10,000 laser pulses per second to track surface elevation changes with unprecedented accuracy. The mission provides critical data for understanding climate change, sea-level rise, and polar ice dynamics.

Never miss a breakthrough: Join the SciTechDaily newsletter.
Follow us on Google and Google News.
4 Comments
“2 Trillion Pulses Unleashed:”
A meaningless metric! Unless this was an article about the reliability of the laser technology, which it isn’t.
The graph for the elevation change at Vanderford Glacier shows a decline of about 2 m over the last 25 years. A decline is probably real. However, nothing is said about whether the sampling location is affected by ocean tides, and if it is, whether a correction is made for the tides. Why are some areas showing an increase in elevation while Vanderford is showing a decline? Why was Vanderford chosen as an example and nothing said about the areas gaining ice?
As an afterthought, to put things in context, I see that the range in height of the waves near the Vanderford track is about +/- 2 m. That is, about twice what the purported ice decline has been in 25 years. Make of it what you will.
As I read the article, it is definitely prompted by the 2 trillionth laser pulse! Of course it would not have made such an interesting story if that event had happened over solid cloud cover, or the ocean, or a parking lot somewhere. The fact that ICESat-2 repeatedly passes over the same locations on the Earth with high precision permits detailed changes in the surface height to be determined. Downside is that it does not inspect every inch of the planet, unlike a satellite imaging setup. It happens that this 2 trillionth pulse occurred during a pass over an interesting Antarctic outlet glacier – which is a focus of research since it is changing in various ways – did you look at the linked (open-access) paper about the Vanderford?
That the observations happened near the 2 trillionth pulse is just coincidence and provides no additional information.
Just what is the point you are trying to make about the linked article, which is about modeling the retreat of the grounding line? Is it the statement that “Our results suggest that grounding line retreat and dynamic mass loss at Vanderford Glacier is likely to be dominated by basal melting higher than current satellite-derived estimates, highlighting the need for improved constraints on basal melt estimates in the Vincennes Bay region, and that ice front retreat has an almost negligible impact on sustained grounding line retreat.”? Or, “…, the driver of observed grounding line retreat remains unknown.”?
Have 2 trillion pulses helped resolve the disparity in modeling and observation?