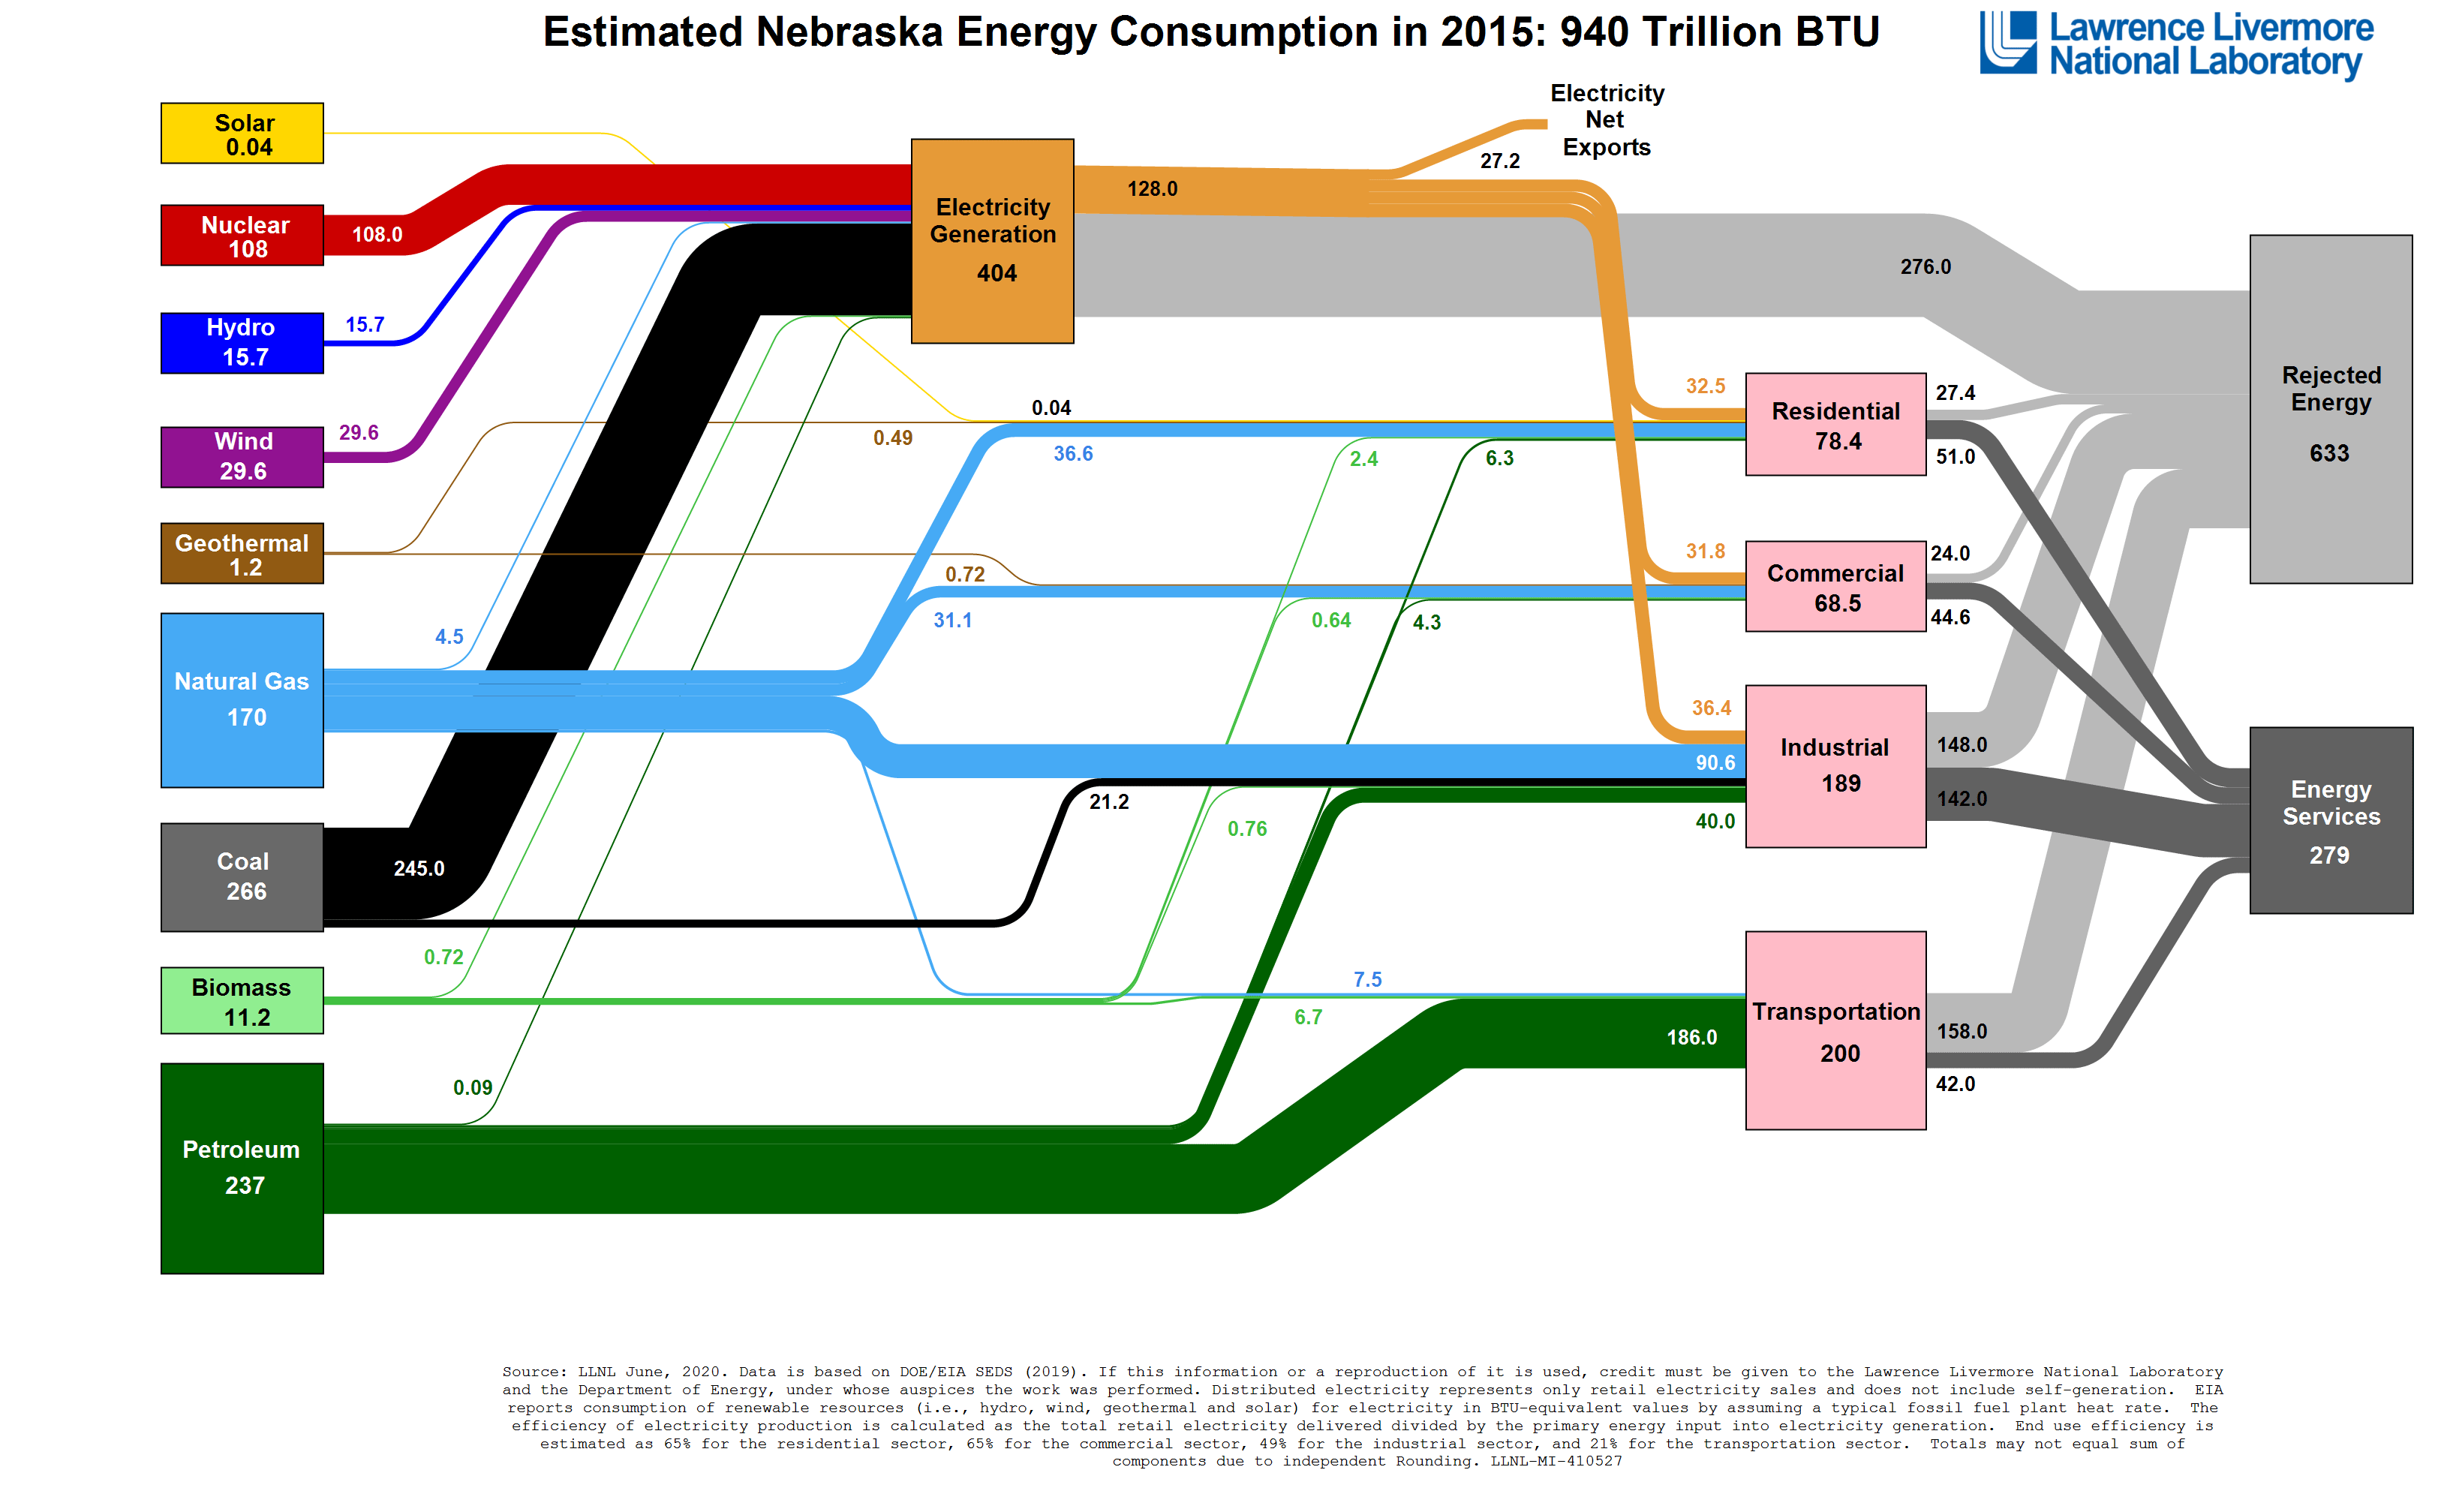
Americans used 7 percent less energy in 2020 due in part to the COVID-19 pandemic. The 2020 energy flow chart released by Lawrence Livermore National Laboratory details the sources of energy production, how Americans are using energy and how much waste exists. Credit: LLNL
Americans used approximately 7 percent less energy in 2020, due in part to the COVID-19 pandemic, according to energy flow charts released by Lawrence Livermore National Laboratory (LLNL).
Each year, LLNL releases flow charts that illustrate the nation’s consumption and use of energy. Americans used 92.9 quads (quadrillion BTU) of energy, which is 7.2 quads less or 7 percent less than 2019. The highest recorded energy use in American history was in 2018, when 101.2 quads were consumed. A BTU, or British Thermal Unit, is a unit of measurement for energy; 3,412 BTUs is equivalent to 1 kilowatt-hour, which is the amount of energy it takes to light an efficient LED lightbulb for a week.
Even in the face of a large drop in energy use, renewable energy made significant gains, with solar up by 19 percent and wind up 10 percent in 2020.
“Solar and wind continue to show year-on-year growth, which is an impressive change for the energy system,” said A.J. Simon, group leader for Energy at LLNL. “During the pandemic, where total electricity declined only slightly, a lot of coal generation was replaced by renewable energy. “
Overall, use of natural gas was down 2 percent. Natural gas use in the commercial sector declined 11 percent, likely due to decreased commercial activity during the pandemic. A 7 percent decline in natural gas use in the residential sector was likely due to a relatively warm winter. These declines were offset by increased use of natural gas in the electricity sector, which (along with renewables) replaced coal consumption.
The outlier in energy consumption at the end use sectors was electricity use in the residential applications, which increased 2 percent over 2019. Residential occupancy during shelter-in-place orders and increased working from home contributed to this rise. Conversely, transportation energy use declined by 14 percent due to substantially reduced mobility during the pandemic.
“It was certainly an interesting year for energy,” Simon said. “Overall, consumption is down nearly 7 percent from the prior year, and COVID was only a factor for three quarters of the year. Frankly, I’m surprised that we didn’t see a larger increase in residential energy use with so many people working and learning from home.”
All energy use and conversion results in some losses, shown on the charts as rejected energy. As energy becomes more efficient, rejected energy numbers go down. In 2020, rejected energy dropped 7 percent from 2019. This energy most often takes the form of waste heat, such as the warm exhaust from automobiles and furnaces. The efficiency of the nation’s cars, lightbulbs and factories determines how much waste heat is produced and how much fuel and electricity can be put to productive use.


Be the first to comment on "COVID Pandemic Drives Down U.S. Energy Use in 2020"