ESA/NASA/JAXA
In an unprecedented collaboration, ESA, NASA and JAXA (Japan Aerospace Exploration Agency) have created a new tool that combines a wealth of data from Earth-observing satellites to monitor the worldwide impacts of COVID-19. This new online platform is now available to the public.
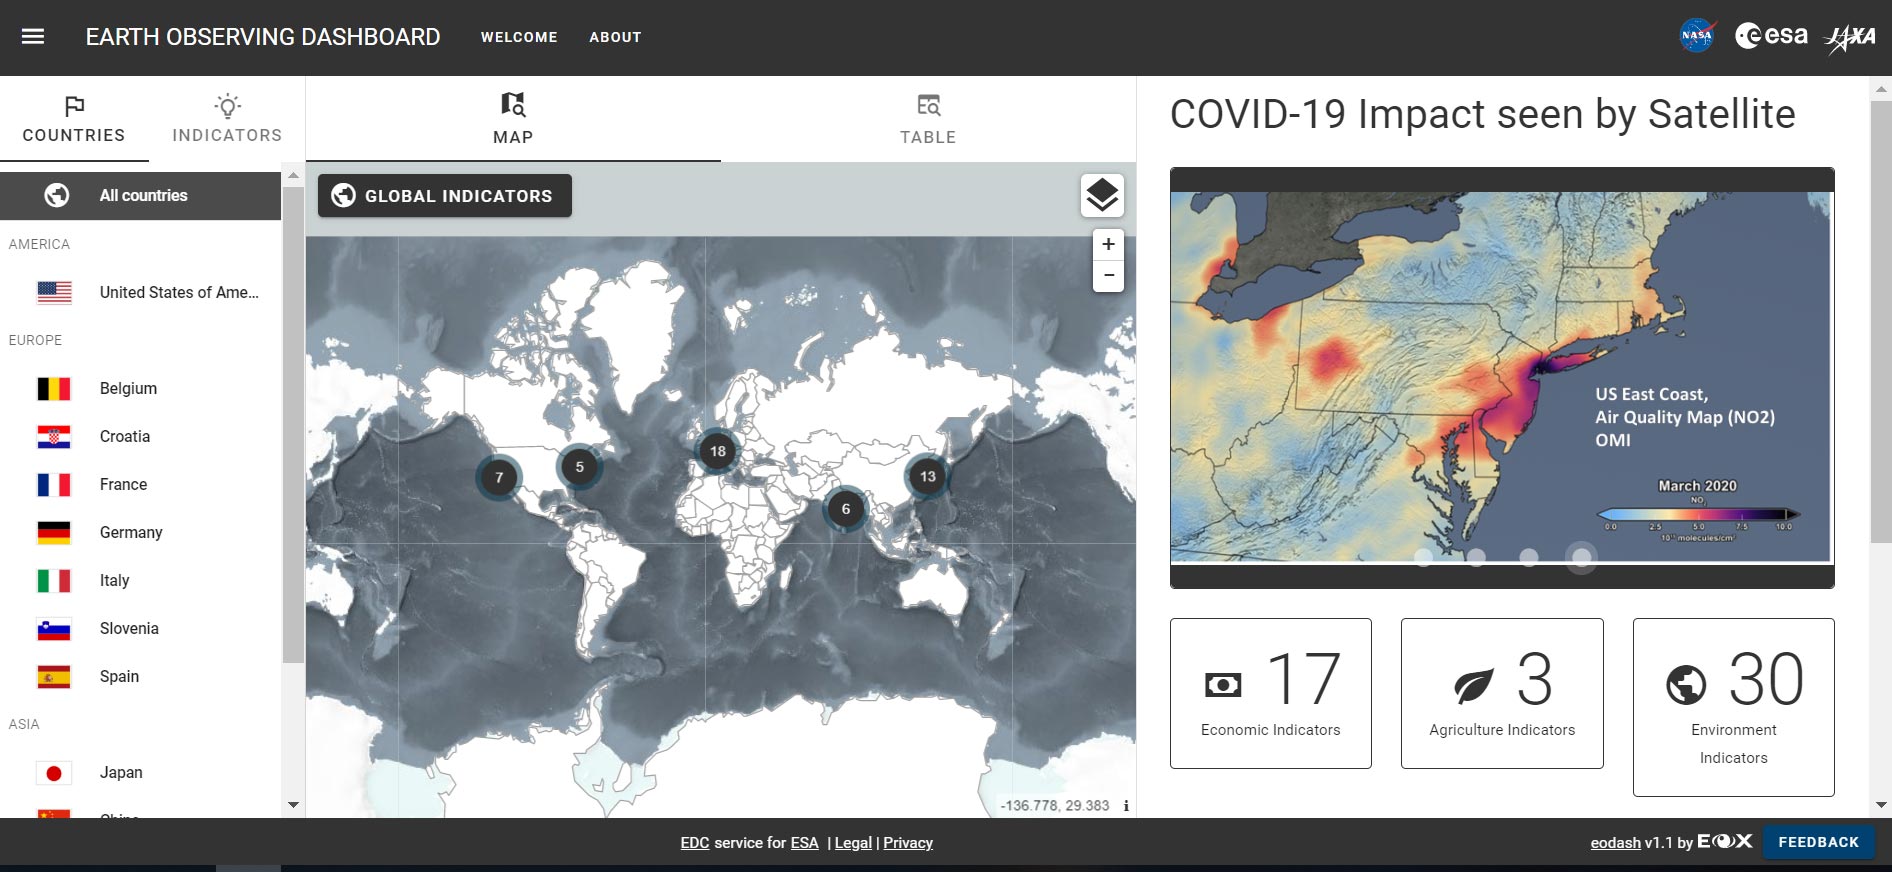
The new ‘COVID-19 Earth Observation Dashboard’ integrates multiple satellite data records from the three space agencies with analytical tools to allow users to track changes in air and water quality, climate change, economic activity, and agriculture. The tri-agency platform gives the general public and policy-makers a unique platform to explore the short and long-term impacts of the coronavirus lockdown.
ESA’s Director for Earth Observation, Josef Aschbacher, comments, “The coronavirus pandemic has brought on unprecedented challenges with severe societal consequences. Earlier this month, ESA and the European Commission created the ‘Rapid Action COVID-19 Earth observation’ initiative which allowed for a European platform to provide COVID-related information using Copernicus Sentinel satellite data.
“As the challenges we face from COVID-19 are global by nature, international collaboration among space agencies is key. Through this close cooperation, ESA, NASA, and JAXA have created a new centralized platform. Through this, we are making sure that our Earth observation programs deliver their full potential to society, and in doing so, are helping humanity navigate through this crisis with more accurate information at its disposal.”
Thomas Zurbuchen, Associate Administrator for NASA’s Science Mission Directorate, says, “Together NASA, ESA, and JAXA represent a great human asset: advanced Earth-observing instruments in space that are used every day to benefit society and advance knowledge about our home planet.
“When we began to see from space how changing patterns of human activity caused by the pandemic were having a visible impact on the planet, we knew that if we combined resources, we could bring a powerful new analytical tool to bear on this fast-moving crisis.”
The Earth observation dashboard allows users to explore and investigate how regional lockdowns and social distancing measures have affected Earth’s air, land and water.
Air quality changes, for example, were one of the first-noticed impacts of the restrictions put in place to reduce the spread of the coronavirus disease. Nitrogen dioxide, which is caused by fumes from sclerotic traffic, the burning of fossil fuels, as well as industrial activity, shows up clearly in satellite data. The dashboard brings together new and historical nitrogen dioxide datasets for comparison, as well as targeted regional areas including Los Angeles, Tokyo, Beijing, Paris, and Madrid.
Changes in carbon dioxide are also highlighted in the dashboard to monitor how global and local reactions to the pandemic have changed concentrations of this greenhouse gas. The dashboard allows for the short-term and long-term changes in carbon dioxide on a global scale, as well as observations in selected urban areas such as New York, San Francisco, and Delhi.
The dashboard also presents targeted satellite observations of total suspended matter and chlorophyll concentrations in select coastal areas, harbors, and semi-enclosed bays to assess what has produced these water quality changes, how widespread they may be, and how long they last. Long Island Sound, the North Adriatic, and Tokyo Bay are among the areas examined.
The COVID-19 Earth Observation Dashboard also provides observations of shipping activity in ports, parked cars, and nighttime lights in urban areas to show how specific sectors of the economy have been affected. These data are presented in the dashboard to quantify changes in Los Angeles, the Port of Dunkirk, Beijing, and several other locations.
The dashboard uses data from NASA’s Aura and OCO-2 satellites, JAXA’s GOSAT and ALOS-2 satellites, the Sentinel missions from the European Copernicus program led by the European Commission, as well as nightlight maps using data acquired by the US Suomi NPP satellite.
The dashboard will continue to be expanded with new data added over the following months and new sections will be added. The COVID-19 Earth Observation Dashboard is available at EODashboard.org.
Never miss a breakthrough: Join the SciTechDaily newsletter.
Follow us on Google and Google News.
1 Comment
This is marvelous. An international effort and sharing of data around the world is exactly what is needed to tackle the Covid-19 pandemic on a global scale. This is the way all science should be developed and shared.