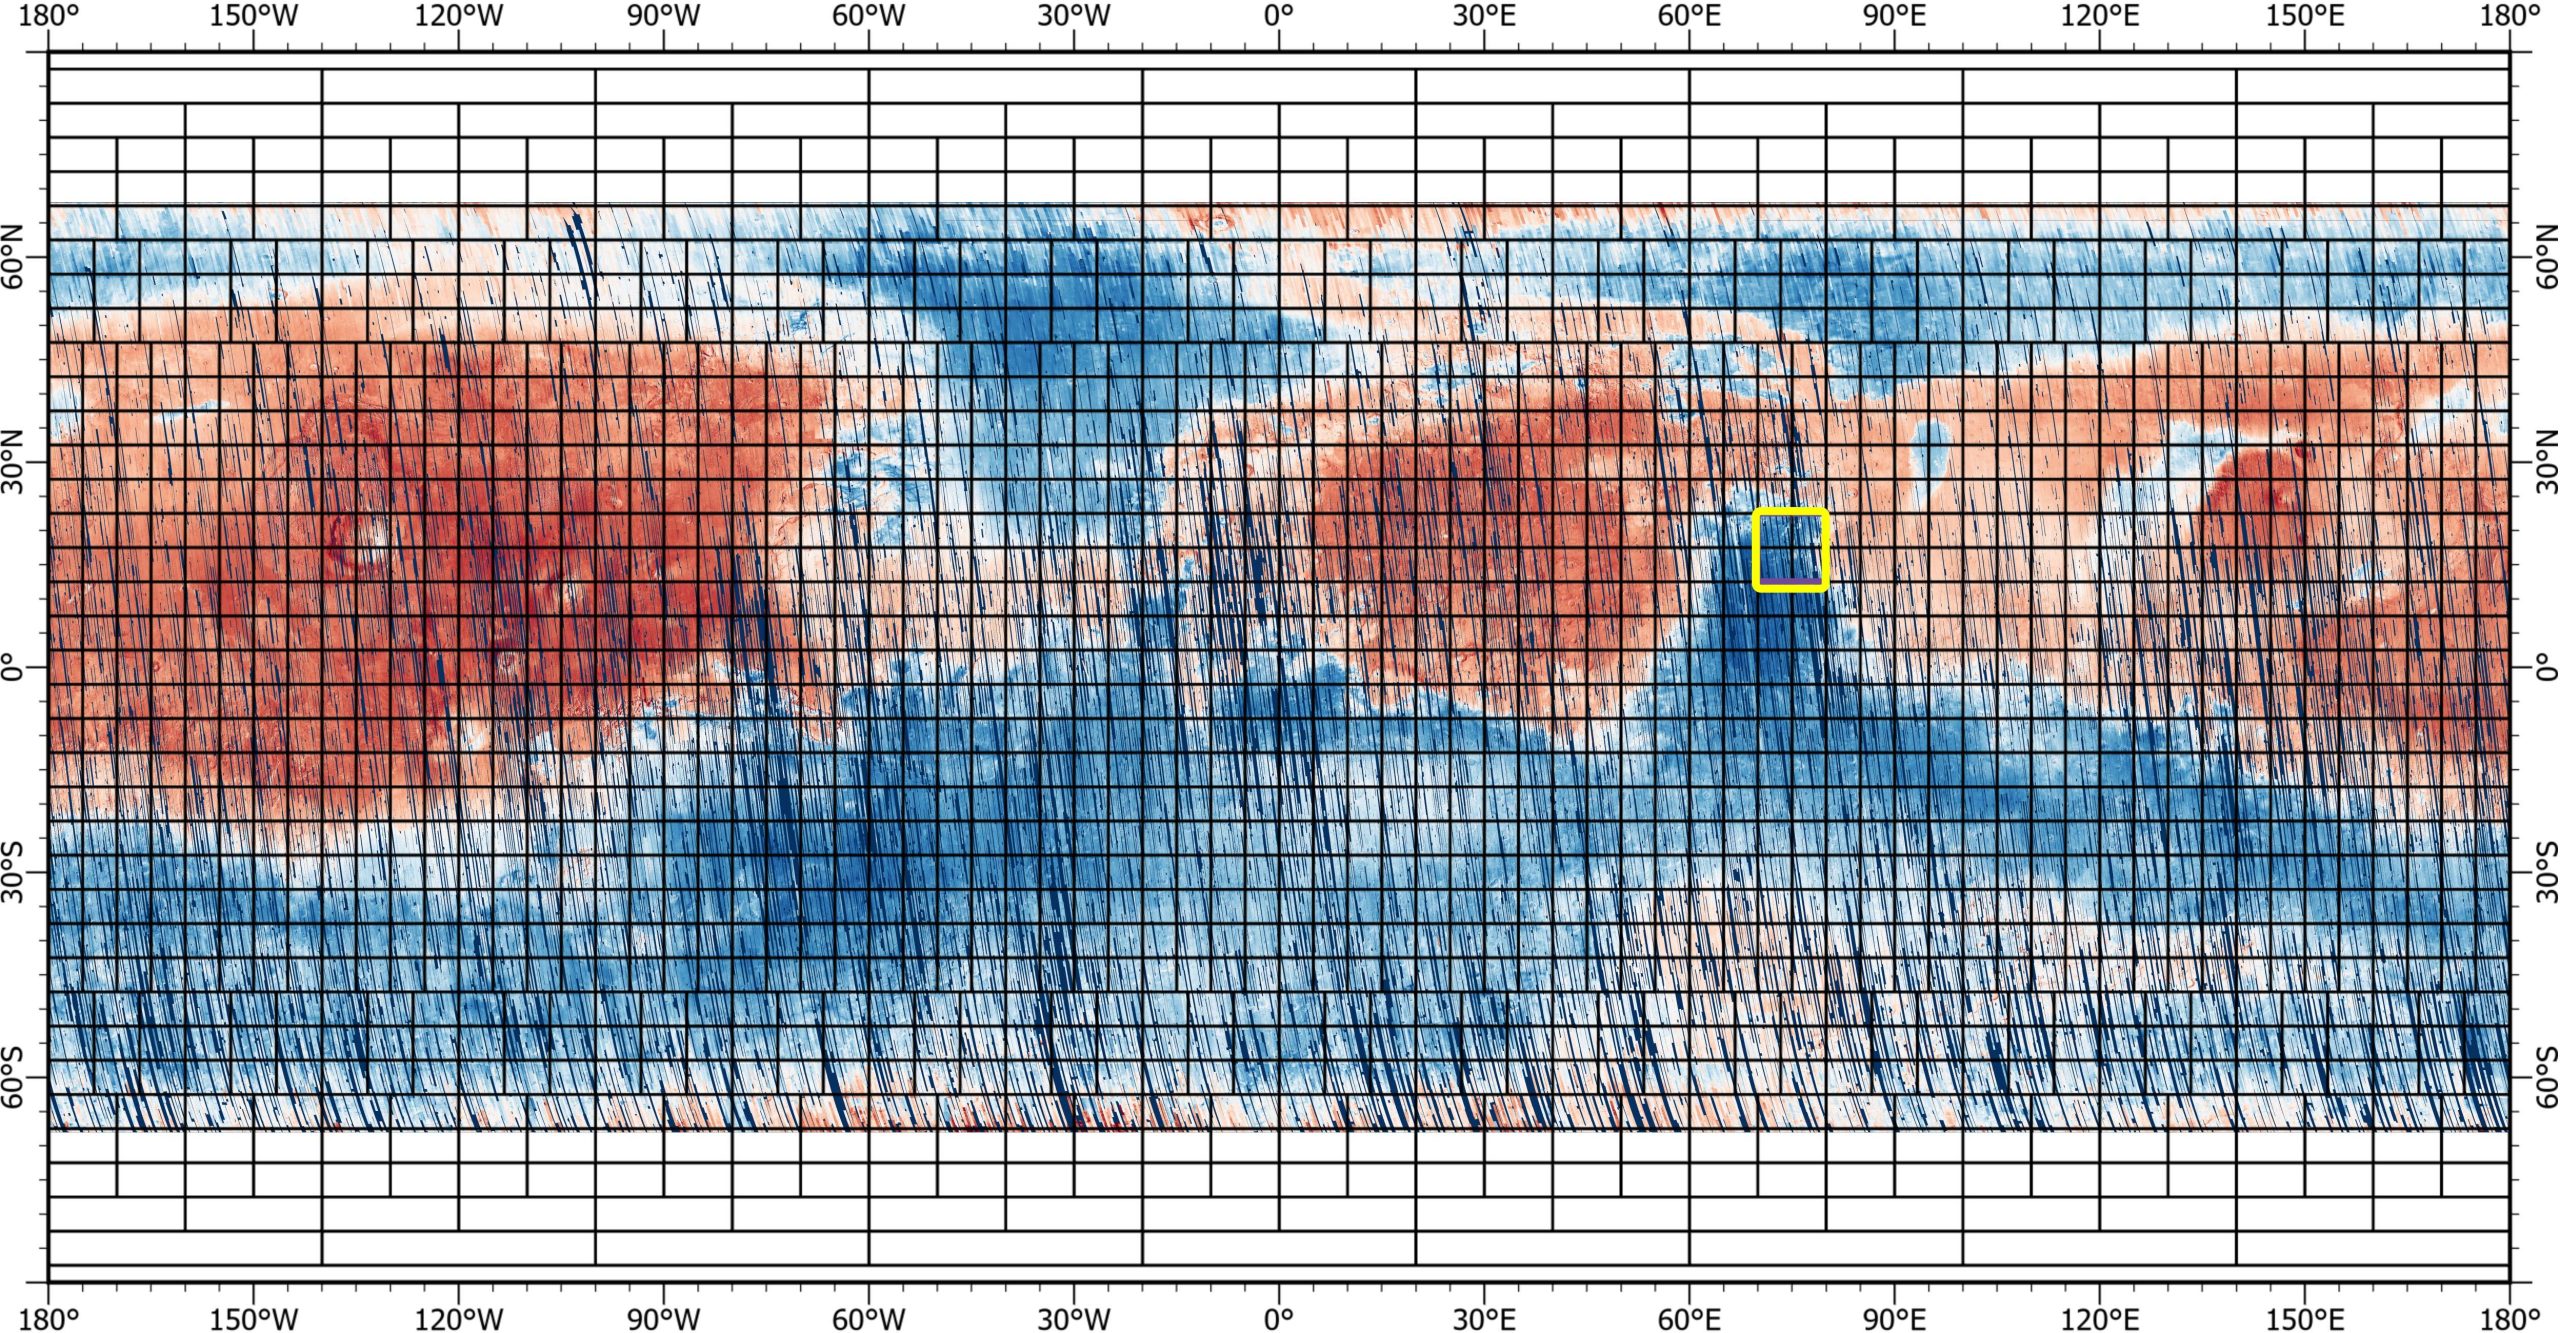
The rainbow-colored map, to be released in batches over six months, covers the vast majority of the planet Mars, revealing dozens of minerals found on its surface.
Scientists are about to get a new look at the Red Planet, thanks to a multicolored 5.6-gigapixel map. Covering 86% of the surface of Mars, the map reveals the distribution of dozens of key minerals. By looking at mineral distribution, researchers can better understand Mars’ watery past and can prioritize which regions need to be studied in more depth.
The first portions of this map have been released by NASA’s Planetary Data System. Over the next six months, more will be released, completing one of the most comprehensive surveys of the Martian surface ever made. (Read more about these map segments.)
NASA’s Mars Reconnaissance Orbiter, or MRO, has been mapping minerals on the Red Planet for 16 years, with its Compact Reconnaissance Imaging Spectrometer for Mars, or CRISM. (MRO launched on August 12, 2005, and arrived at Mars on March 10, 2006.)
Using detectors that see visible and infrared wavelengths, the CRISM team has previously produced high-resolution mineral maps that provide a record of the formation of the Martian crust and where and how it was altered by water. These maps have been crucial to helping scientists understand how lakes, streams, and groundwater shaped the planet billions of years ago. NASA has also used CRISM’s maps to select landing sites for other spacecraft, as with Jezero Crater, where NASA’s Perseverance rover is exploring an ancient river delta.
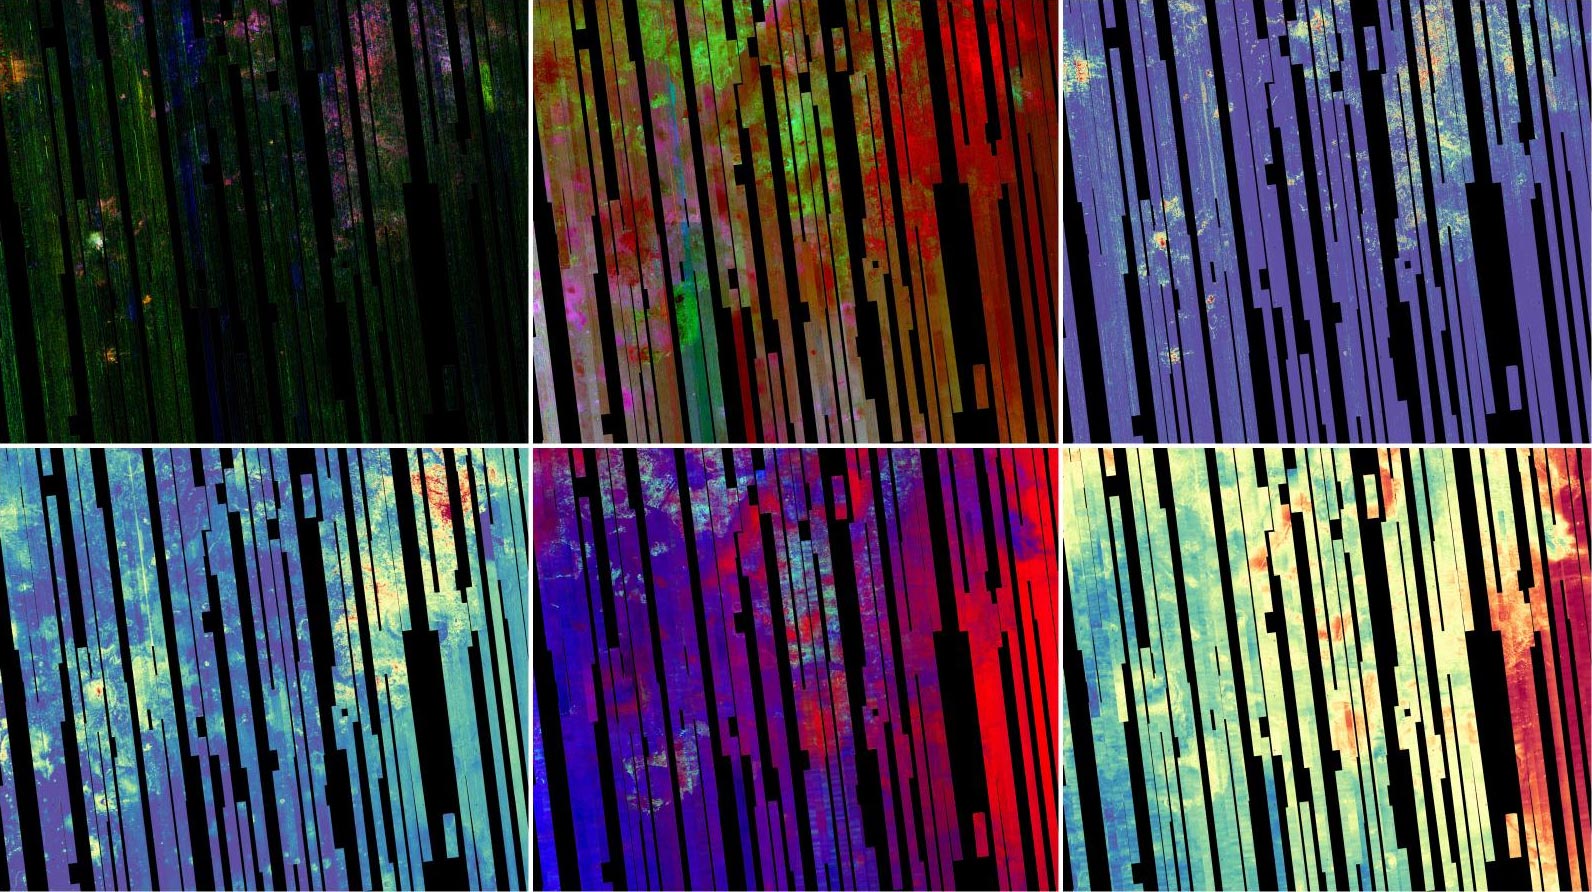
The first piece of this new map includes 51,000 images, each of which represents a “strip” 336 miles (540 kilometers) long by 6 miles (10 kilometers) wide that was captured as MRO passed overhead. The resolution is lower than CRISM maps made from targeted observations because the data was acquired with the instrument looking straight down, a different imaging strategy designed to cover much more of the planet.
CRISM’s Final Contributions Before Decommissioning
To acquire its data, CRISM used two spectrometers, one of which was designed with three cryocoolers to keep temperatures low so that it could more clearly detect the longest wavelengths of reflected solar infrared light. Used in succession, the last of these cryocoolers completed its lifecycle in 2017, limiting the instrument’s capabilities to view visible wavelengths. So this will be CRISM’s last map covering the instrument’s full wavelength range. The instrument is now in a standby mode and may record data a few more times in the coming months before being decommissioned.
One last map will be released within the year, covering visible wavelengths and focusing only on iron-bearing minerals; this will have twice the spatial resolution of the latest map.
“The CRISM investigation has been one of the crown jewels of NASA’s MRO mission,” said Richard Zurek, the mission’s project scientist at NASA’s Jet Propulsion Laboratory in Southern California. “Analyses based on these final maps will provide new insights into the history of Mars for many years to come.”
MRO is led by Jet Propulsion Laboratory (JPL), which is a division of Caltech in Pasadena. CRISM is led by Johns Hopkins University’s Applied Physics Laboratory.
Never miss a breakthrough: Join the SciTechDaily newsletter.
Follow us on Google and Google News.
1 Comment
Another poorly written press release. Detectors don’t “see” visible or infrared wavelengths. The detectors capture the intensities, which are recorded, and then converted to light by a computer display device, which then allows the relative intensities to be seen by humans. These press releases should be reviewed by the project scientist before being made public.