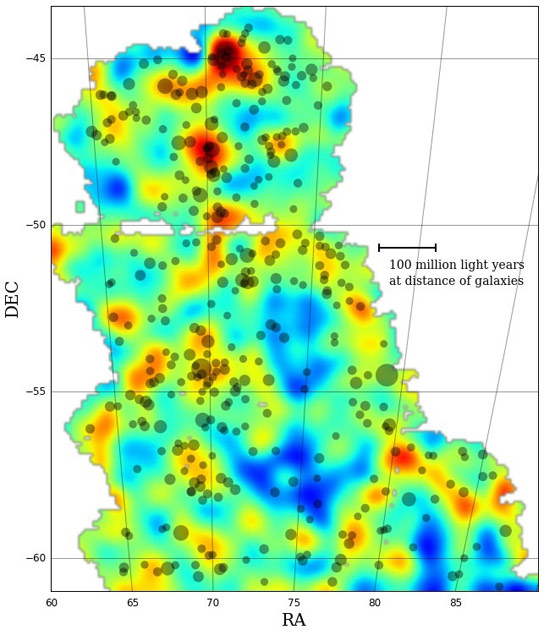
This is the first Dark Energy Survey map to trace the detailed distribution of dark matter across a large area of sky. The color scale represents projected mass density: red and yellow represent regions with more dense matter. The dark matter maps reflect the current picture of mass distribution in the universe where large filaments of matter align with galaxies and clusters of galaxies. Clusters of galaxies are represented by gray dots on the map – bigger dots represent larger clusters. This map covers three percent of the area of the sky that DES will eventually document over its five-year mission. Credit: Dark Energy Survey
Scientists have created the largest single high-definition map of dark matter, helping researchers understand the role that dark matter plays in galaxy formation.
Scientists on the Dark Energy Survey have released the first in a series of dark matter maps of the cosmos. These maps, created with one of the world’s most powerful digital cameras, are the largest contiguous maps created at this level of detail and will improve our understanding of dark matter’s role in the formation of galaxies. Analysis of the clumpiness of the dark matter in the maps will also allow scientists to probe the nature of the mysterious dark energy, believed to be causing the expansion of the universe to speed up.
The new maps were released today at the April meeting of the American Physical Society in Baltimore, Maryland. They were created using data captured by the Dark Energy Camera, a 570-megapixel imaging device that is the primary instrument for the Dark Energy Survey (DES).
Dark matter, the mysterious substance that makes up roughly a quarter of the universe, is invisible to even the most sensitive astronomical instruments because it does not emit or block light. But its effects can be seen by studying a phenomenon called gravitational lensing – the distortion that occurs when the gravitational pull of dark matter bends light around distant galaxies. Understanding the role of dark matter is part of the research program to quantify the role of dark energy, which is the ultimate goal of the survey.
This analysis was led by Vinu Vikram of Argonne National Laboratory (then at the University of Pennsylvania) and Chihway Chang of ETH Zurich. Vikram, Chang, and their collaborators at Penn, ETH Zurich, the University of Portsmouth, the University of Manchester and other DES institutions worked for more than a year to carefully validate the lensing maps.
“We measured the barely perceptible distortions in the shapes of about 2 million galaxies to construct these new maps,” Vikram said. “They are a testament not only to the sensitivity of the Dark Energy Camera, but also to the rigorous work by our lensing team to understand its sensitivity so well that we can get exacting results from it.”
The camera was constructed and tested at the U.S. Department of Energy’s Fermi National Accelerator Laboratory and is now mounted on the 4-meter Victor M. Blanco telescope at the National Optical Astronomy Observatory’s Cerro Tololo Inter-American Observatory in Chile. The data were processed at the National Center for Supercomputing Applications at the University of Illinois in Urbana-Champaign.
The dark matter map released today makes use of early DES observations and covers only about three percent of the area of sky DES will document over its five-year mission. The survey has just completed its second year. As scientists expand their search, they will be able to better test current cosmological theories by comparing the amounts of dark and visible matter.
Those theories suggest that, since there is much more dark matter in the universe than visible matter, galaxies will form where large concentrations of dark matter (and hence stronger gravity) are present. So far, the DES analysis backs this up: The maps show large filaments of matter along which visible galaxies and galaxy clusters lie and cosmic voids where very few galaxies reside. Follow-up studies of some of the enormous filaments and voids, and the enormous volume of data, collected throughout the survey will reveal more about this interplay of mass and light.
“Our analysis so far is in line with what the current picture of the universe predicts,” Chang said. “Zooming into the maps, we have measured how dark matter envelops galaxies of different types and how together they evolve over cosmic time. We are eager to use the new data coming in to make much stricter tests of theoretical models.”
View the Dark Energy Survey analysis.


Be the first to comment on "Dark Energy Survey Reveals Detailed Guide to Spotting Dark Matter"