The series of heatwaves we are currently experiencing in western Europe is a clear sign of human-induced global warming. ESA’s Clement Albergel explains how we monitor these events using satellites such as the Copernicus Sentinel-3 mission and puts them in the context of the long-term climate data record generated via ESA’s Climate Change Initiative.
Video Transcript:
The series of heatwaves we have been experiencing in Western Europe are the clearest sign of global warming caused by human activities, our emission of greenhouse gas in the atmosphere.
To better understand the variability of our climate system, we need observations. Satellite earth observations such as those operated by the European Space Agency in collaboration with the European Commission in the context of the Copernicus Program are particularly useful as they provide global coverage, uniformity, rapid measurement, and continuity.
Copernicus is powered by a dedicated family of satellites, the Sentinels.
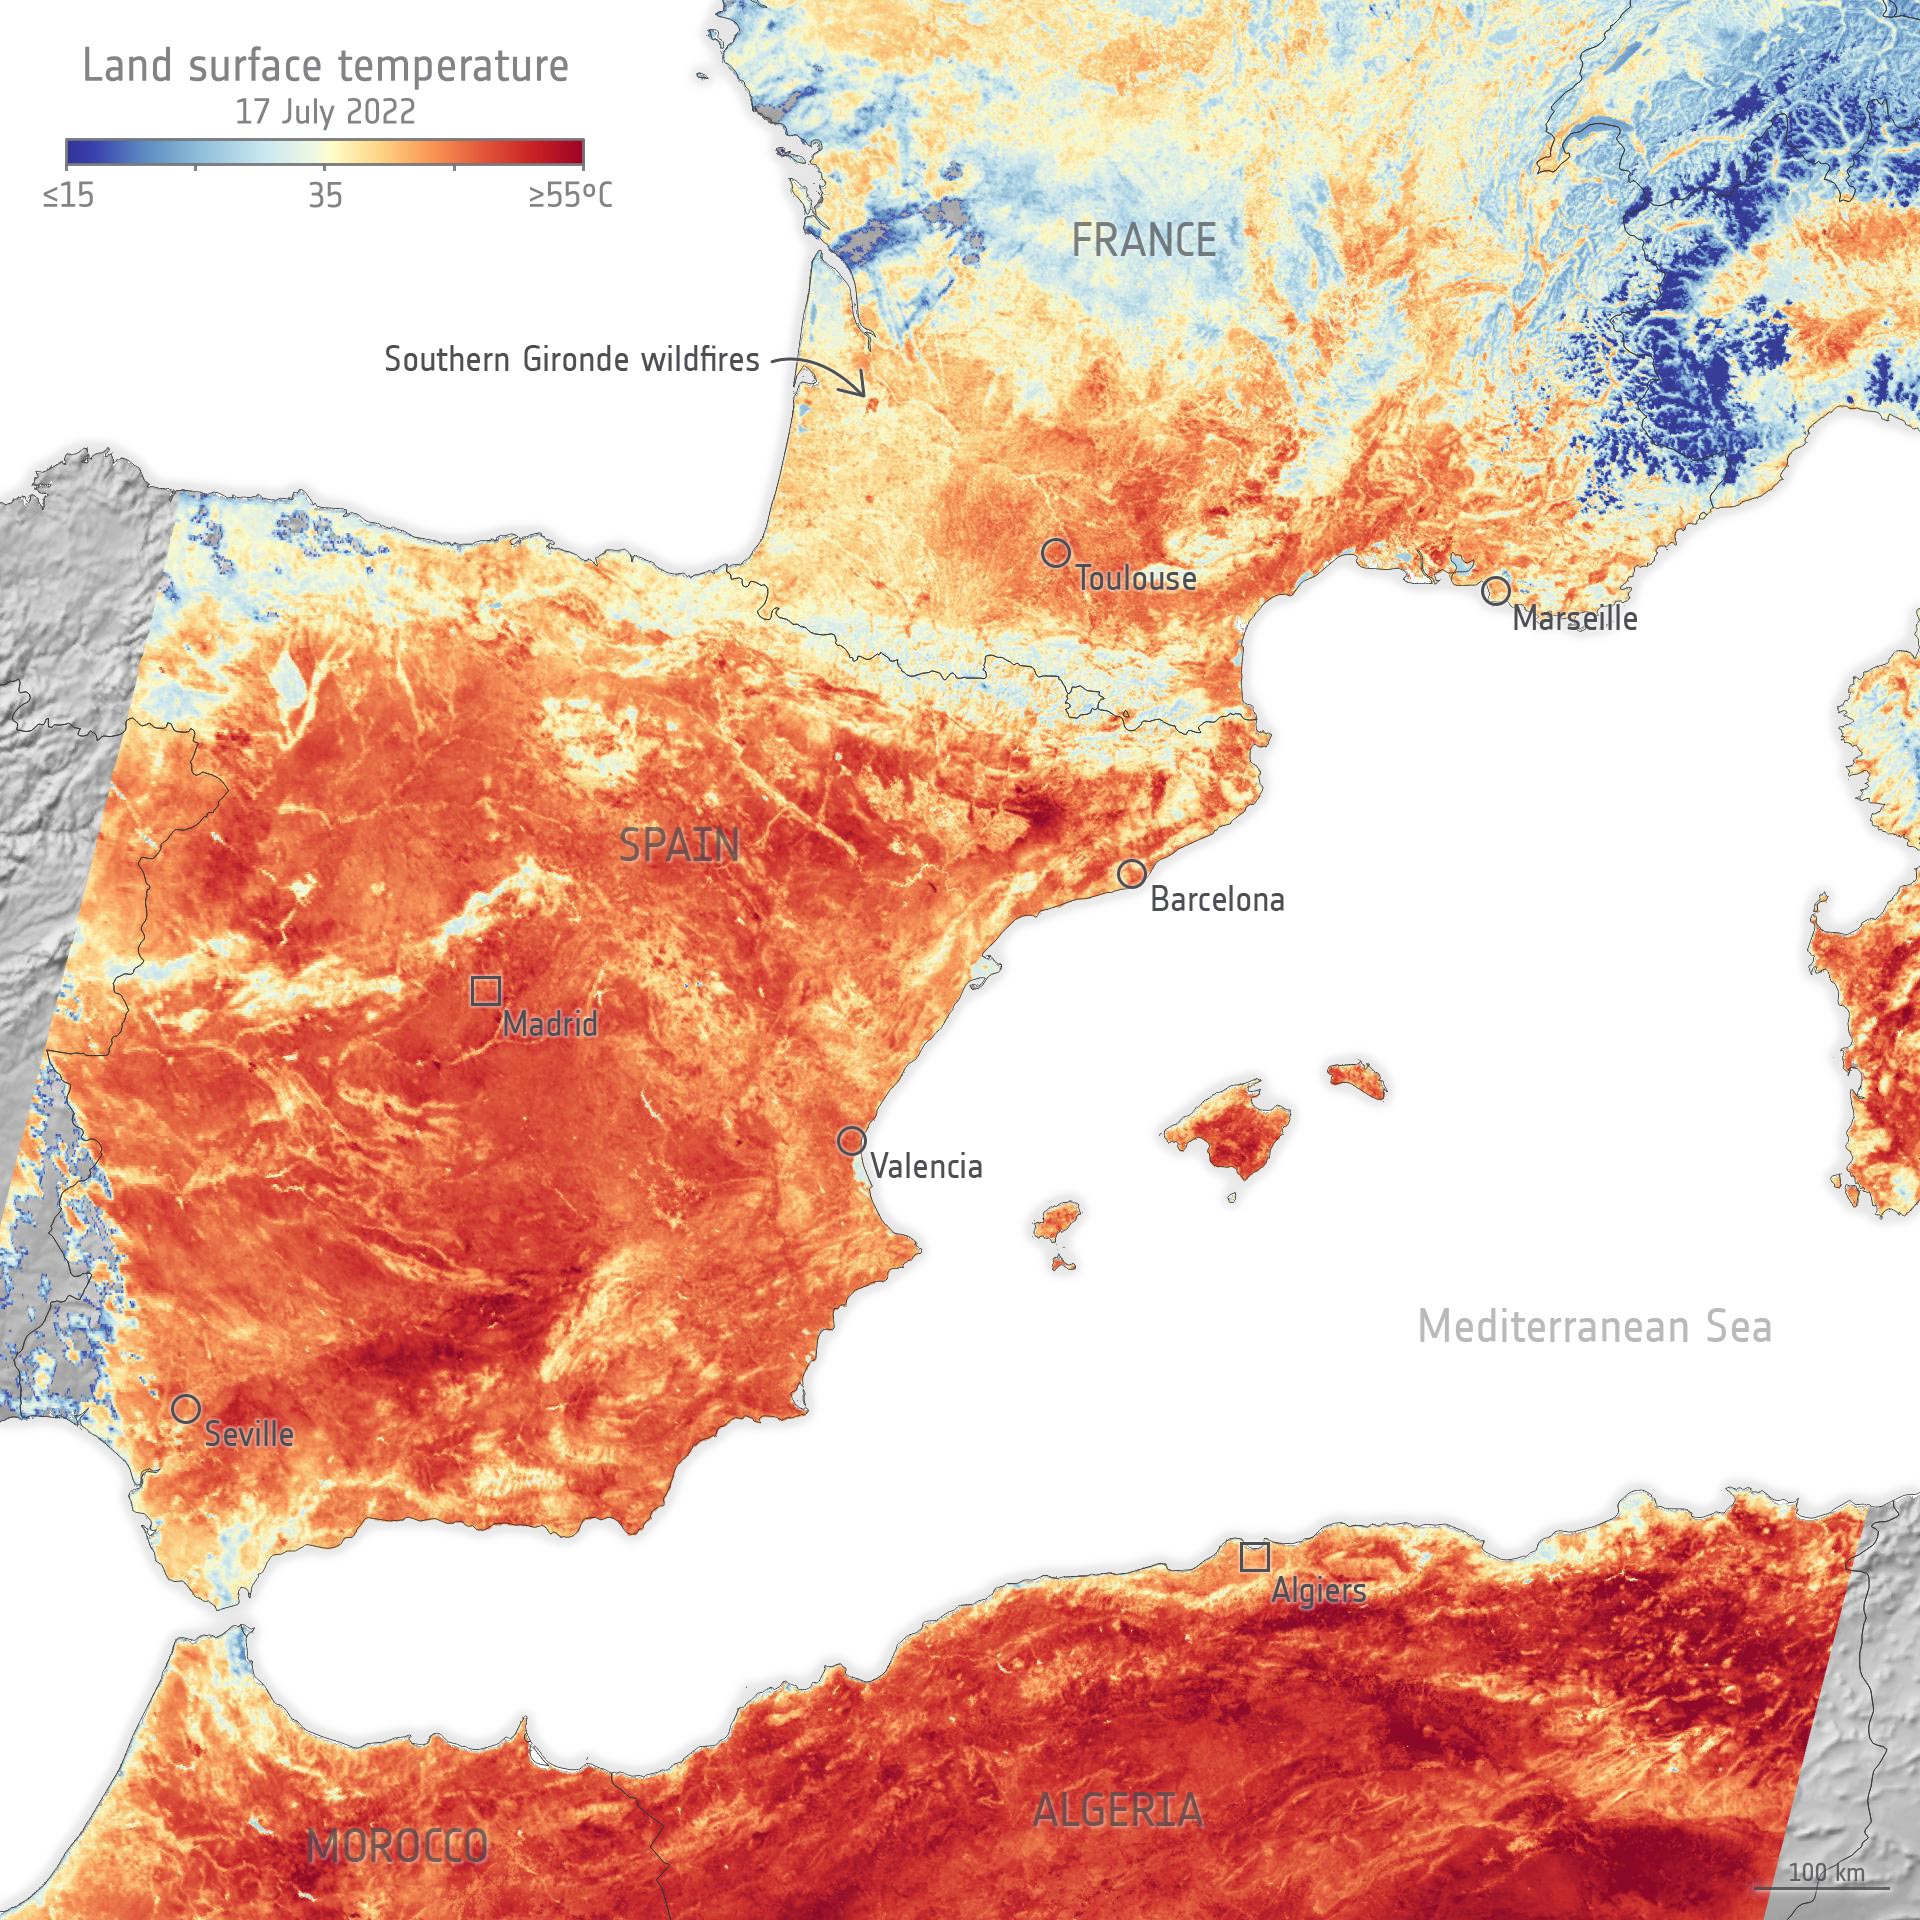
Sentinel 3 is an instrument a radiometer that measures land surface temperature. In the last two weeks of July, it has measured record-breaking land surface temperature. More than 45 degrees Celsius (113 degrees Fahrenheit) in the UK, more than 50 degrees Celsius (122 degrees Fahrenheit) in France, and more than 60 (140 degrees Fahrenheit) in Spain.
We can also combine land surface temperatures from Sentinel 3 with those from previous satellites in order to develop long time series. And that’s what we do in the context of ESA’s climate program, the climate change initiative.
We put together data from different satellites in order to develop global scale long-term satellite-derived time series of key components of the climate system, also known as essential climate variables. Land surface temperature is one of them.
We have recently released a 25-year climate data record of land surface temperature and the data indicate a stable increase of about 0.2 degrees Celsius (0.36 degrees Fahrenheit) per decade on average at a global scale with strong regional variability.
Heat waves can also be followed by wildfire. Extremely high temperatures combined with low air humidity and dry vegetation increase the risk of wildfire in case there is a source of ignition.
Satellites are very useful as they permit the monitoring of different fire characteristics. From a risk assessment point of view, we can detect areas that are dry and prone to wildfire outbreaks, we can monitor actively flaming fires, smoldering fires, as well as burn areas, the scar left on the ground by fire. We can monitor smoke plumes as well as trace gas in the atmosphere.
Another consequence of prolonged heat waves when combined with extremely low level of precipitation is droughts. Soils are getting drier and many rivers in Europe have now reached level low record.
Images acquired by Sentinel-2 show part of the Po Valley near Piacenza in Italy and revealed how the river has shrunk between June 2020 and June 2022. This is partially due to the lack of precipitation Northern Italy usually receives with extremely high temperatures and the lack of snow in the mountain that usually feeds the river.
Never miss a breakthrough: Join the SciTechDaily newsletter.
Follow us on Google and Google News.
3 Comments
“Considering Copernicus Sentinel-3 acquired these data in the morning, the temperature would have increased through the afternoon.”
Not necessarily! The ground temperature is determined by the type of material and the orientation (slope and aspect), along with the elevation of the sun. Those surfaces that will be hottest will be the sparsely-vegetated surfaces directly facing the sun with the surface-normal (90 deg) parallel to the sun’s rays. That relationship changes with the apparent motion of the sun through the sky. Air temperatures generally increase through the day, but ground temperatures are more complex. I’m afraid the assertion is a generalization ‘too far.’
“The series of heatwaves we are currently experiencing in western Europe is a clear sign of human-induced global warming.”
An assertion made without facts in evidence.
Lazy science. Not impressed. I see no connection whatsoever. How would this approach apply to the temperatures seen in the 1930’s (the Great Dust Bowl) in the U.S. or the heatwave in the PNW this summer? The statement below is indicative of the bias of this author. Just what precisely our those clearest signs? Human emissions? Come on. Climate is far more complex than suggesting a trace gas in the atmosphere is the major driver. Warming comes first, followed by a rise in CO2, not the other way around. Anyone who has a serious interest in climate change would delve into the historical history spanning thousands of years. How do you explain the Medieval Warming Period or the Roman Warming Periods? Human emissions? Rubbish!
“The series of heatwaves we have been experiencing in Western Europe are the clearest sign of global warming caused by human activities, our emission of greenhouse gas in the atmosphere.”