Earth’s global surface temperatures in 2018 were the fourth warmest since 1880, according to independent analyses by NASA and the National Oceanic and Atmospheric Administration (NOAA).
Global temperatures in 2018 were 1.5 degrees Fahrenheit (0.83 degrees Celsius) warmer than the 1951 to 1980 mean, according to scientists at NASA’s Goddard Institute for Space Studies (GISS) in New York. Globally, 2018’s temperatures rank behind those of 2016, 2017, and 2015. The past five years are, collectively, the warmest years in the modern record.
“2018 is yet again an extremely warm year on top of a long-term global warming trend,” said GISS Director Gavin Schmidt.
Since the 1880s, the average global surface temperature has risen about 2 degrees Fahrenheit (1 degree Celsius). This warming has been driven in large part by increased emissions into the atmosphere of carbon dioxide and other greenhouse gases caused by human activities, according to Schmidt.
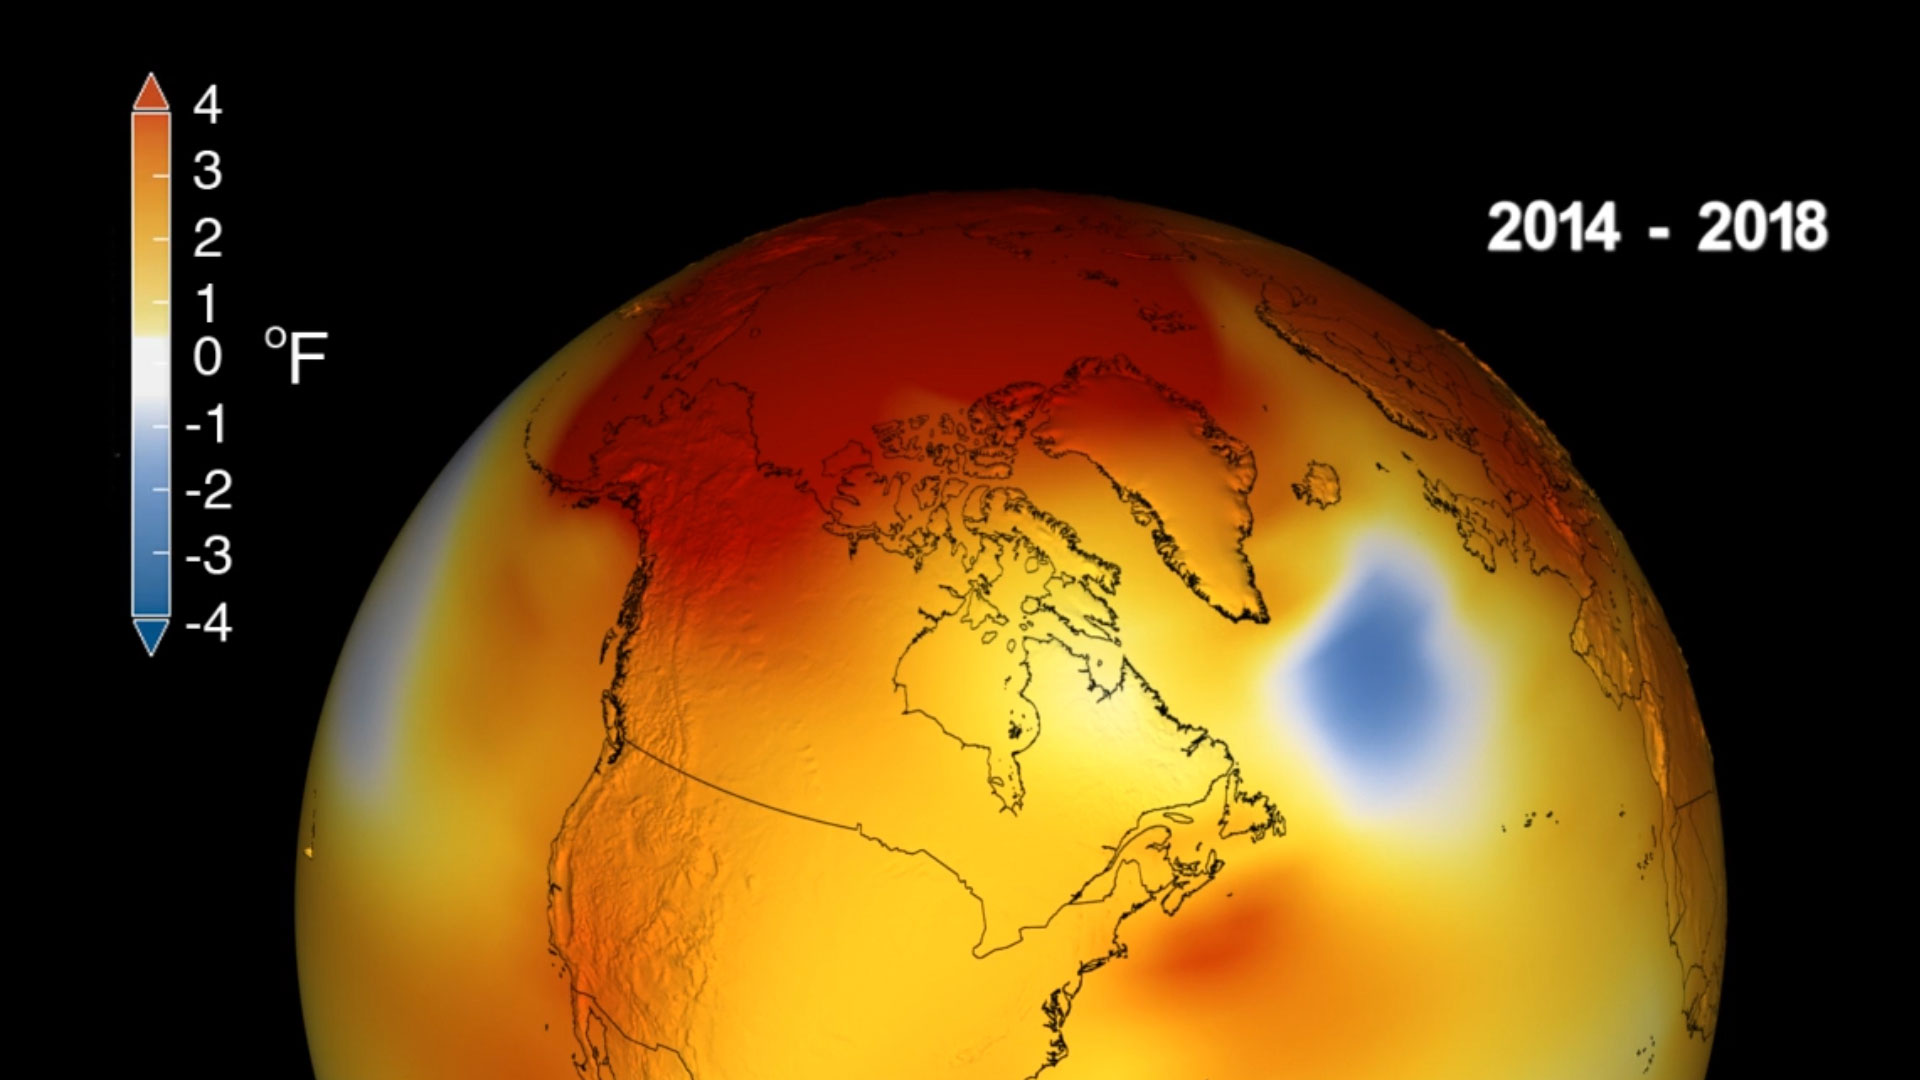
Earth’s long-term warming trend can be seen in this visualization of NASA’s global temperature record, which shows how the planet’s temperatures are changing over time, compared to a baseline average from 1951 to 1980. The record is shown as a running five-year average. Credit: NASA’s Scientific Visualization Studio/Kathryn Mersmann
Weather dynamics often affect regional temperatures, so not every region on Earth experienced similar amounts of warming. NOAA found the 2018 annual mean temperature for the contiguous 48 United States was the 14th warmest on record.
Warming trends are strongest in the Arctic region, where 2018 saw the continued loss of sea ice. In addition, mass loss from the Greenland and Antarctic ice sheets continued to contribute to sea level rise. Increasing temperatures can also contribute to longer fire seasons and some extreme weather events, according to Schmidt.
“The impacts of long-term global warming are already being felt — in coastal flooding, heat waves, intense precipitation, and ecosystem change,” said Schmidt.
NASA’s temperature analyses incorporate surface temperature measurements from 6,300 weather stations, ship- and buoy-based observations of sea surface temperatures, and temperature measurements from Antarctic research stations.
Because weather station locations and measurement practices change over time, the interpretation of specific year-to-year global mean temperature differences has some uncertainties. Taking this into account, NASA estimates that 2018’s global mean change is accurate to within 0.1 degree Fahrenheit, with a 95 percent certainty level.
NOAA scientists used much of the same raw temperature data, but with a different baseline period and different interpolation into the Earth’s polar and other data-poor regions. NOAA’s analysis found that 2018 global temperatures were 1.42 degrees Fahrenheit (0.79 degrees Celsius) above the 20th-century average.
NASA’s full 2018 surface temperature data set — and the complete methodology used to make the temperature calculation — are available at: https://data.giss.nasa.gov/gistemp
GISS is a laboratory within the Earth Sciences Division of NASA’s Goddard Space Flight Center in Greenbelt, Maryland. The laboratory is affiliated with Columbia University’s Earth Institute and School of Engineering and Applied Science in New York.
NASA uses the unique vantage point of space to better understand Earth as an interconnected system. The agency also uses airborne and ground-based monitoring, and develops new ways to observe and study Earth with long-term data records and computer analysis tools to better see how our planet is changing. NASA shares this knowledge with the global community and works with institutions in the United States and around the world that contribute to understanding and protecting our home planet.
Never miss a breakthrough: Join the SciTechDaily newsletter.
Follow us on Google and Google News.
2 Comments
We’re toast.
This is one of the worst-written and captioned articles I have ever seen on SciTech Daily! “Earth’s global surface temperatures in 2018 were the fourth warmest since 1880” means that the third and second warmest years were hotter than 2018, and took place some indeterminate time between now and 1880, which was the hottest year of the four. That does not describe the reported trend at all!
I would also like to know more about the data sets that were used by the NASA, NOAA, the Japan Meteorological Agency, the Berkeley Earth research group, and the Met Office Hadley Centre (UK) to produce their remarkably similar temperature trends shown in the figure. As far as I am aware, all the different climate modelling groups tend to use the same data sets for historical global temperature records, and simply process them in a slightly different way in their predictive models. This would account for why there are five almost identical charts for the historical temperature record – it would not mean that five different groups have all measured things independently and reached exactly the same result, which is what the graphic and caption is implying! Is it really so remarkable that all the graphs show “peaks and valleys in sync with each other” if they are all produced from essentially the same data?
Terrible article – 1/10 Must try harder.