
A pilot project has estimated emissions and removals of carbon dioxide in individual nations using satellite measurements.
A NASA Earth-observing satellite has helped researchers track carbon dioxide emissions for more than 100 countries around the world. The pilot project offers a powerful new look at the carbon dioxide being emitted in these countries and how much of it is removed from the atmosphere by forests and other carbon-absorbing “sinks” within their borders. The findings demonstrate how space-based tools can support insights on Earth as nations work to achieve climate goals.
The international study, conducted by more than 60 researchers and published in the journal Earth System Science Data, used measurements made by NASA’s Orbiting Carbon Observatory-2 (OCO-2) mission, as well as a network of surface-based observations, to quantify increases and decreases in atmospheric carbon dioxide concentrations from 2015 to 2020. Using this measurement-based (or “top-down”) approach, the researchers were then able to infer the balance of how much carbon dioxide was emitted and removed.
This visualization shows yearly net surface emissions and removals by more than 100 countries from 2015 to 2020. Countries with emissions, seen here in red, appear to pop from the page, compared to countries with removals, seen in green. Credit: NASA’s Scientific Visualization Studio
Although the OCO-2 mission was not specifically designed to estimate emissions from individual nations, the findings from the 100-plus countries come at an opportune time. The first Global Stocktake – a process to assess the world’s collective progress toward limiting global warming, as specified in the 2015 Paris Agreement – takes place in 2023.
“NASA is focused on delivering Earth science data that addresses real world climate challenges – like helping governments around the world measure the impact of their carbon mitigation efforts,” said Karen St. Germain, director of NASA’s Earth Science Division at NASA Headquarters in Washington. “This is one example of how NASA is developing and enhancing efforts to measure carbon emissions in a way that meets user needs.”
Traditional activity-based (or “bottom-up”) approaches to carbon measurement rely on tallying and estimating how much carbon dioxide is being emitted across all sectors of an economy, such as transportation and agriculture. Bottom-up carbon inventories are critical for assessing progress toward emission-reduction efforts, but compiling them requires considerable resources, expertise, and knowledge of the extent of the relevant activities.
This data visualization shows yearly fossil fuel emissions by more than 100 countries from 2015 to 2020. Countries with high emissions, including the U.S. and China, seen here in dark red, appearing to pop from the page, compared to others with lower emissions. Credit: NASA’s Scientific Visualization Studio
This is why developing a database of emissions and removals via a top-down approach could be especially helpful for nations that lack traditional resources for inventory development, the study authors assert. In fact, the scientists’ findings include data for more than 50 countries that have not reported emissions for at least the past 10 years.
The study provides a new perspective by tracking both fossil fuel emissions and the total carbon “stock” changes in ecosystems, including trees, shrubs, and soils. The data is particularly useful for tracking carbon dioxide fluctuations related to land cover change. Emissions from deforestation alone make up a disproportionate amount of total carbon output in the Global South, which encompasses regions of Latin America, Asia, Africa, and Oceania. In other parts of the world, the findings indicate some reductions in atmospheric carbon concentrations via improved land stewardship and reforestation.
The authors said that bottom-up methods for estimating carbon dioxide emissions and removals from ecosystems are essential. However, those methods are vulnerable to uncertainty when data is lacking or the net effects of specific activities, such as logging, aren’t fully known.
This data visualization illustrates changes in the amount of carbon stored in organic matter on land, called terrestrial carbon stock changes, from 2015 to 2020. Activities such as improved land stewardship and deforestation, which is more extensive in the tropics than other regions, affect these stock changes. Credit: NASA’s Scientific Visualization Studio
“Our top-down estimates provide an independent estimate of these emissions and removals, so although they cannot replace the detailed process understanding of traditional bottom-up methods, we can check both approaches for consistency,” said Philippe Ciais, a study author and research director at the Laboratoire des Sciences du Climat et de l’Environnement in France.
Tracking Carbon
The study offers a complex picture of carbon moving through Earth’s land, ocean, and atmosphere.
In addition to direct human impacts accounted for by national inventories, unmanaged ecosystems like some tropical and boreal forests – where humans have a minimal footprint – can sequester carbon from the atmosphere, thus reducing potential global warming.
“National inventories are intended to track how management policies impact emissions and removals of CO2,” said study author Noel Cressie, a professor at the University of Wollongong in Australia. “However, the atmosphere doesn’t care whether CO2 is being emitted from deforestation in the Amazon or wildfires in the Canadian Arctic. Both processes will increase the concentration of atmospheric CO2 and drive climate change. Therefore, it is critical to monitor the carbon balance of unmanaged ecosystems and identify any changes in carbon uptake.”
Looking forward, the researchers said their pilot project can be further refined to understand how emissions from individual nations are changing.
“Sustained, high-quality observations are critical for these top-down estimates,” said lead author Brendan Byrne, a scientist at NASA’s Jet Propulsion Laboratory in Southern California. “Continued observations from OCO-2 and surface sites will allow us to track how these emissions and removals change as the Paris Agreement is implemented. Future international missions that provide expanded mapping of CO2 concentrations across the globe will allow us to refine these top-down estimates and give more precise estimates of countries’ emissions and removals.”
Reference: “National CO2 budgets (2015–2020) inferred from atmospheric CO2 observations in support of the global stocktake” by Brendan Byrne, David F. Baker, Sourish Basu, Michael Bertolacci, Kevin W. Bowman, Dustin Carroll, Abhishek Chatterjee, Frédéric Chevallier, Philippe Ciais, Noel Cressie, David Crisp, Sean Crowell, Feng Deng, Zhu Deng, Nicholas M. Deutscher, Manvendra K. Dubey, Sha Feng, Omaira E. García, David W. T. Griffith, Benedikt Herkommer, Lei Hu, Andrew R. Jacobson, Rajesh Janardanan, Sujong Jeong, Matthew S. Johnson, Dylan B. A. Jones, Rigel Kivi, Junjie Liu, Zhiqiang Liu, Shamil Maksyutov, John B. Miller, Scot M. Miller, Isamu Morino, Justus Notholt, Tomohiro Oda, Christopher W. O’Dell, Young-Suk Oh, Hirofumi Ohyama, Prabir K. Patra, Hélène Peiro, Christof Petri, Sajeev Philip, David F. Pollard, Benjamin Poulter, Marine Remaud, Andrew Schuh, Mahesh K. Sha, Kei Shiomi, Kimberly Strong, Colm Sweeney, Yao Té, Hanqin Tian, Voltaire A. Velazco, Mihalis Vrekoussis, Thorsten Warneke, John R. Worden, Debra Wunch, Yuanzhi Yao, Jeongmin Yun, Andrew Zammit-Mangion and Ning Zeng, 7 March 2023, Earth System Science Data.
DOI: 10.5194/essd-15-963-2023
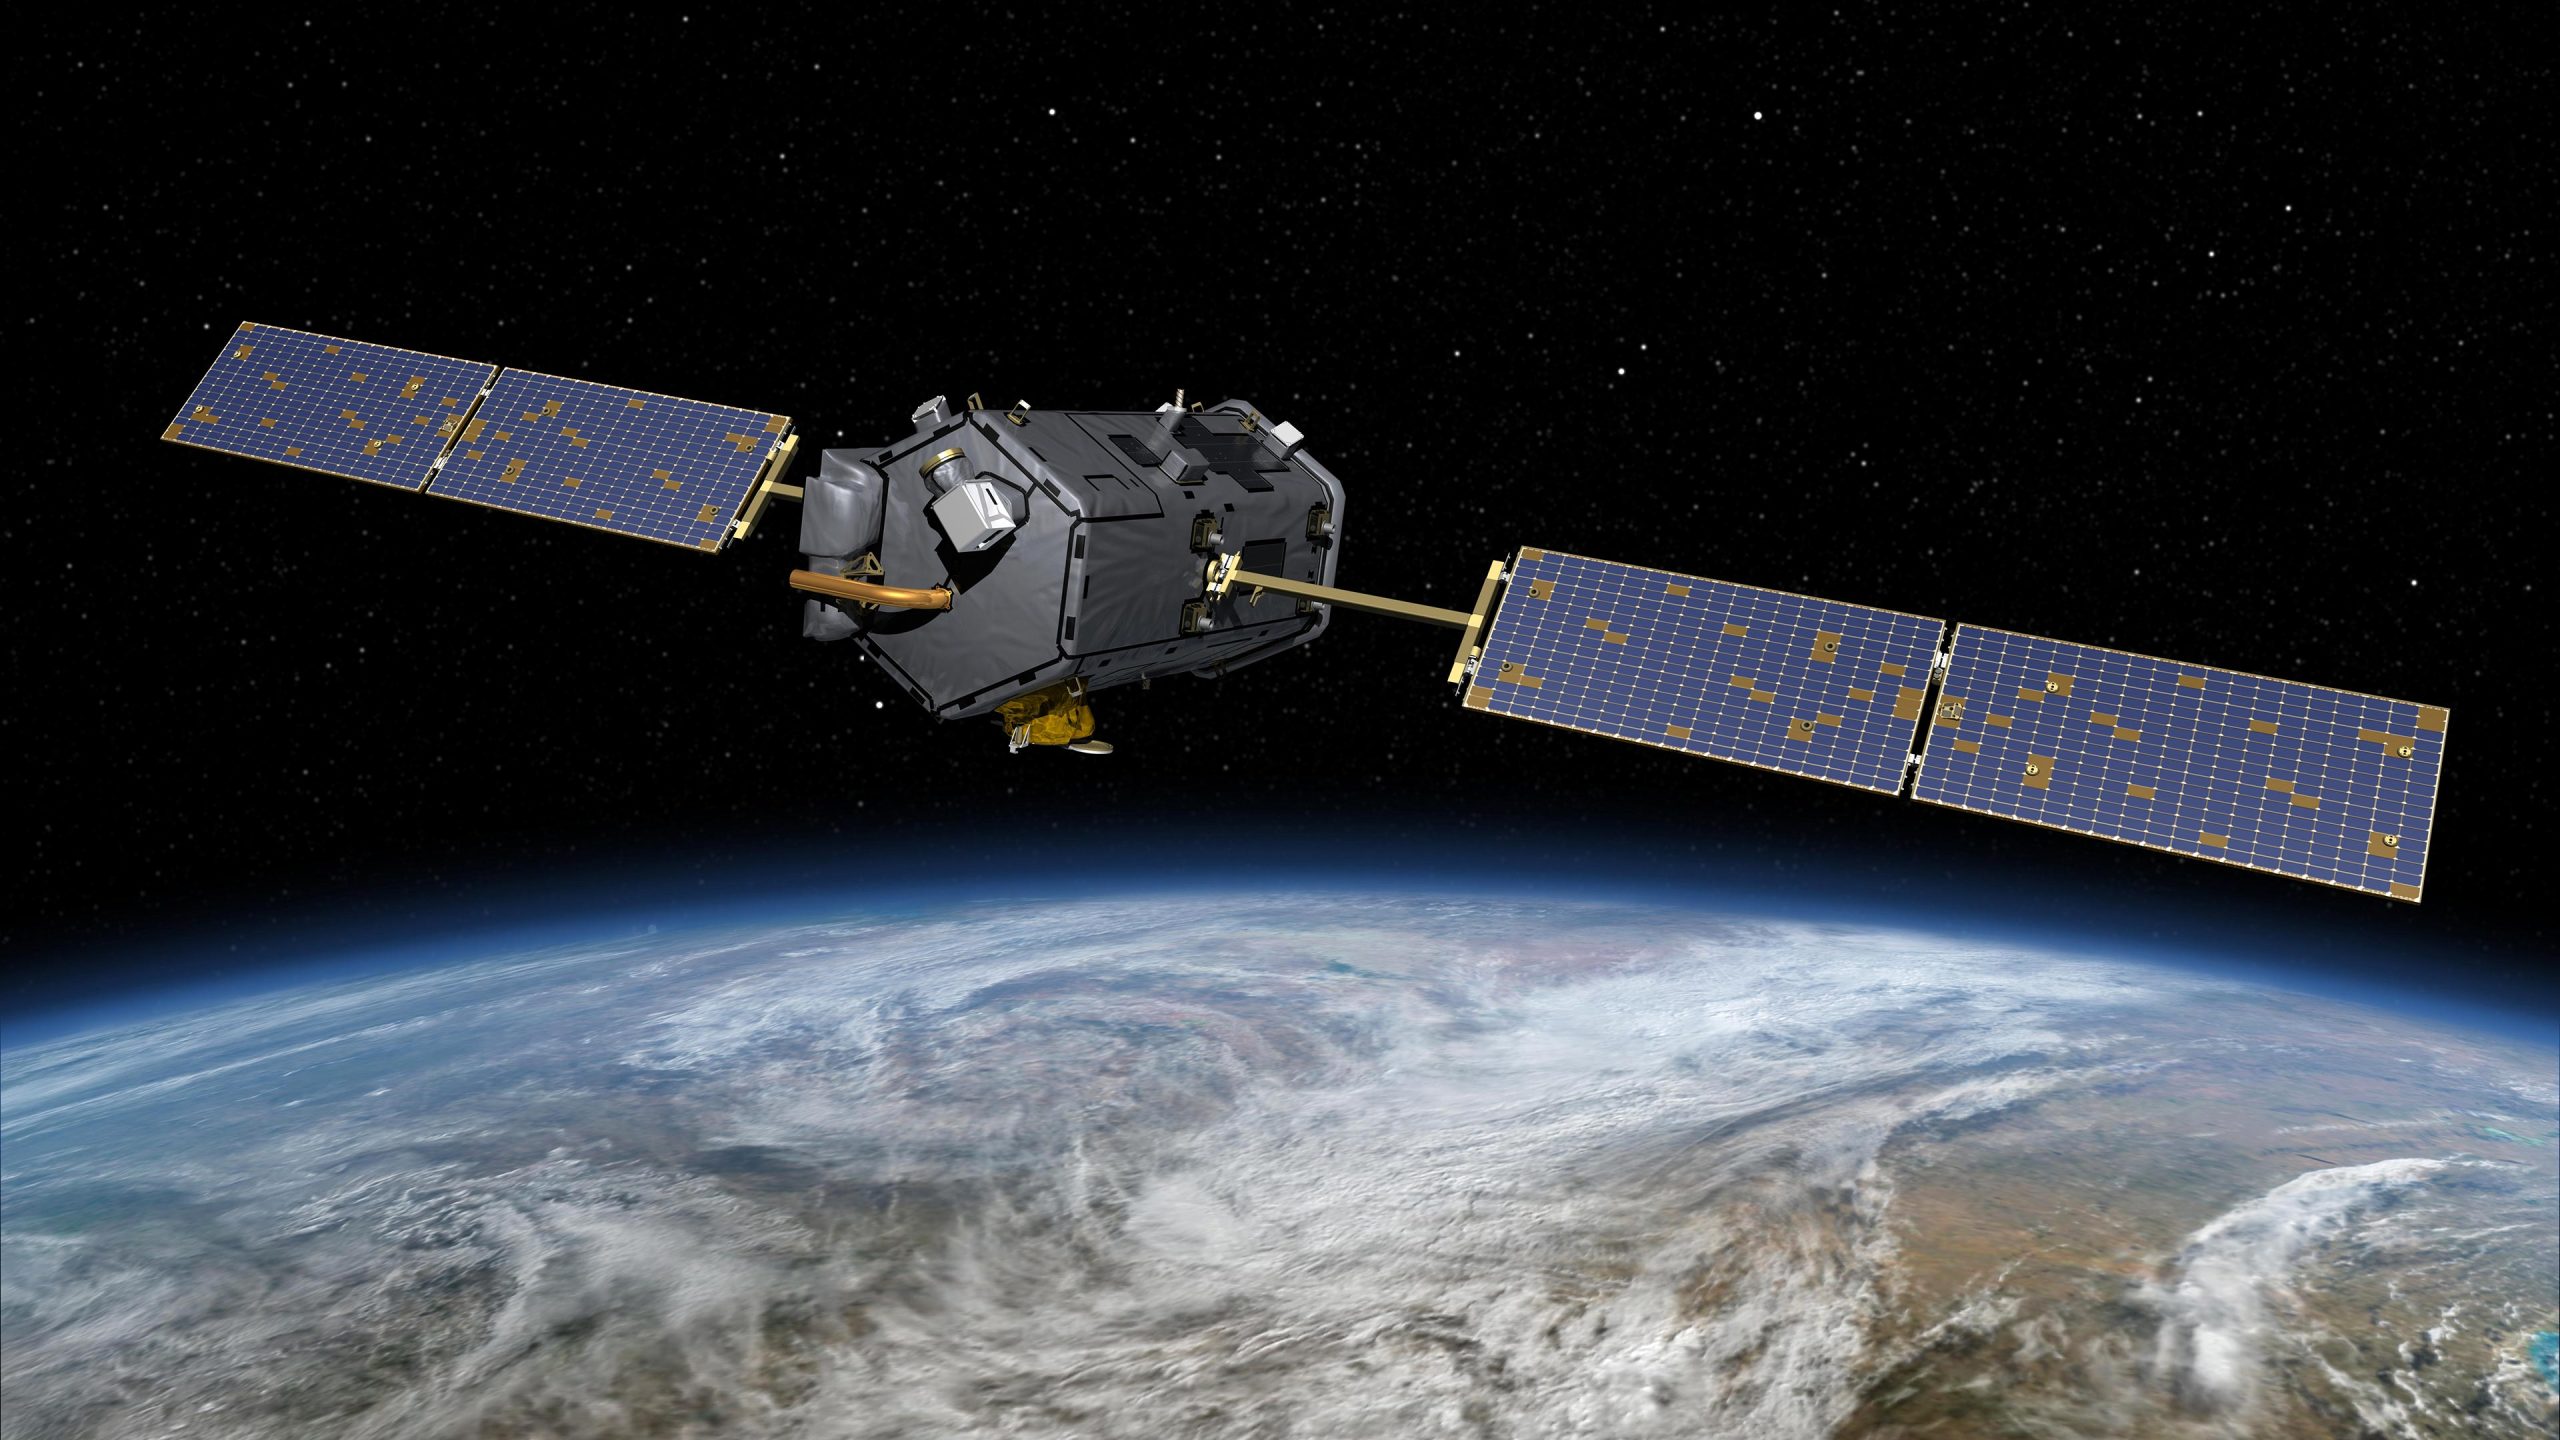
Launched in 2014, the OCO-2 satellite maps natural and human-made carbon dioxide concentrations with the help of three camera-like spectrometers. These devices are tuned to detect the unique spectra, or light signature, of carbon dioxide. They measure the gas indirectly by how much reflected sunlight it absorbs in a given column of air.
The OCO-2 project is managed by JPL. Caltech manages JPL for NASA.
Never miss a breakthrough: Join the SciTechDaily newsletter.
Follow us on Google and Google News.
2 Comments
We simply drop a giant ice cube into the ocean every now and then.
They can’t stop talking out of both sides of their mouth. “NASA is focused on delivering Earth science data that addresses real world climate challenges”, but wasn’t NASA the Space Administration? Focus on space. Also today, NASA said they conducted “A hot fire test of an Artemis rocket engine” (scitechdaily “This Week @ NASA: Artemis Systems Are Ready To Fly Astronauts to the Moon”), which burns “90,000 gallons of liquid hydrogen per minute, holding 700,000 gallons”.
With my bad rough math, at 48 kWh per kilogram efficiency in electrolysis (thanks NASA for publishing imperial measures), that’s 9000804kWh of electricity needed. So, 9 gigawatt hours. America produces 4243 gigawatt hours of electricity per year (EIA.gov). If a ton of coal burnt makes 1927 kWh, is my math right that they’re essentially burning 4,670,472 tons of coal each time? That’s a lot to fill each rocket, not to mention each launch uses two.
NASA’s focus is to reduce carbon dioxide emissions, so with the USA at #2 on their pretty map, stop funding NASA! Normally it wouldn’t matter, but with these weekly hypocritical pious carbon lectures they’re going to environmentalism NASA out of existance.