
A single thermal performance curve applies across life, from bacteria to animals. Species differ in optimal temperatures, but not in the fundamental shape of their response to heat.
Researchers at Trinity College Dublin have identified what they describe as a “universal thermal performance curve” (UTPC) that appears to govern how all species respond to changes in temperature. According to the scientists, this shared pattern effectively “shackles evolution,” since no known organism has escaped the fundamental limits the curve places on how temperature influences biological performance.
Temperature affects every form of life, but the UTPC brings together tens of thousands of previously separate curves used to describe performance across different species.
The same underlying relationship applies regardless of what is being measured, whether it is a lizard running on a treadmill, a shark swimming in open water, or the rate at which bacterial cells divide, showing that a single rule links temperature and performance across the living world.
Why warming helps, then harms
Crucially, the new UTPC shows that as all organisms warm:
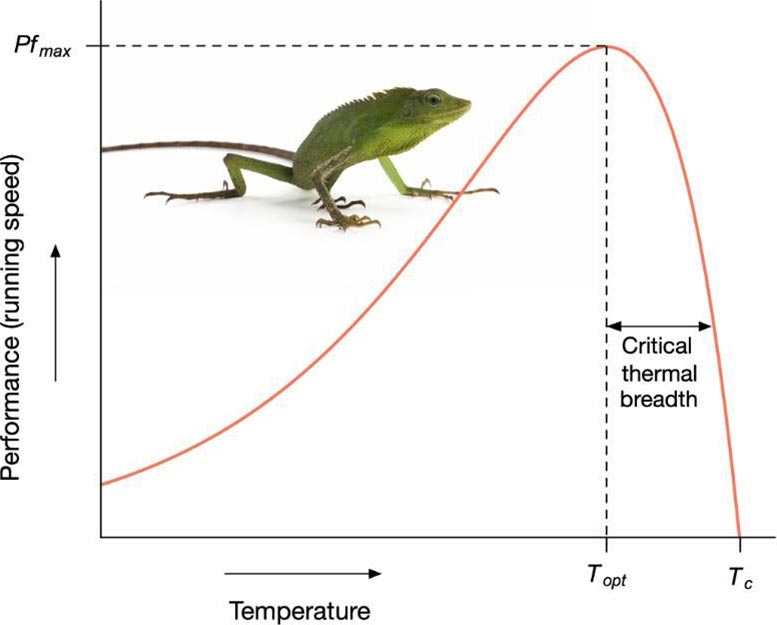
- As organisms heat up, their performance rises gradually until it reaches an optimal point (where performance is highest).
- Once temperatures climb beyond this optimum, performance drops off rapidly.
- This sharp decline at higher temperatures means that overheating poses serious risks, including physiological breakdown or death.
A key implication of the research, recently published in the international journal PNAS, is that species may have less flexibility to adjust to global climate change than previously thought, especially as temperatures continue to rise in most regions.
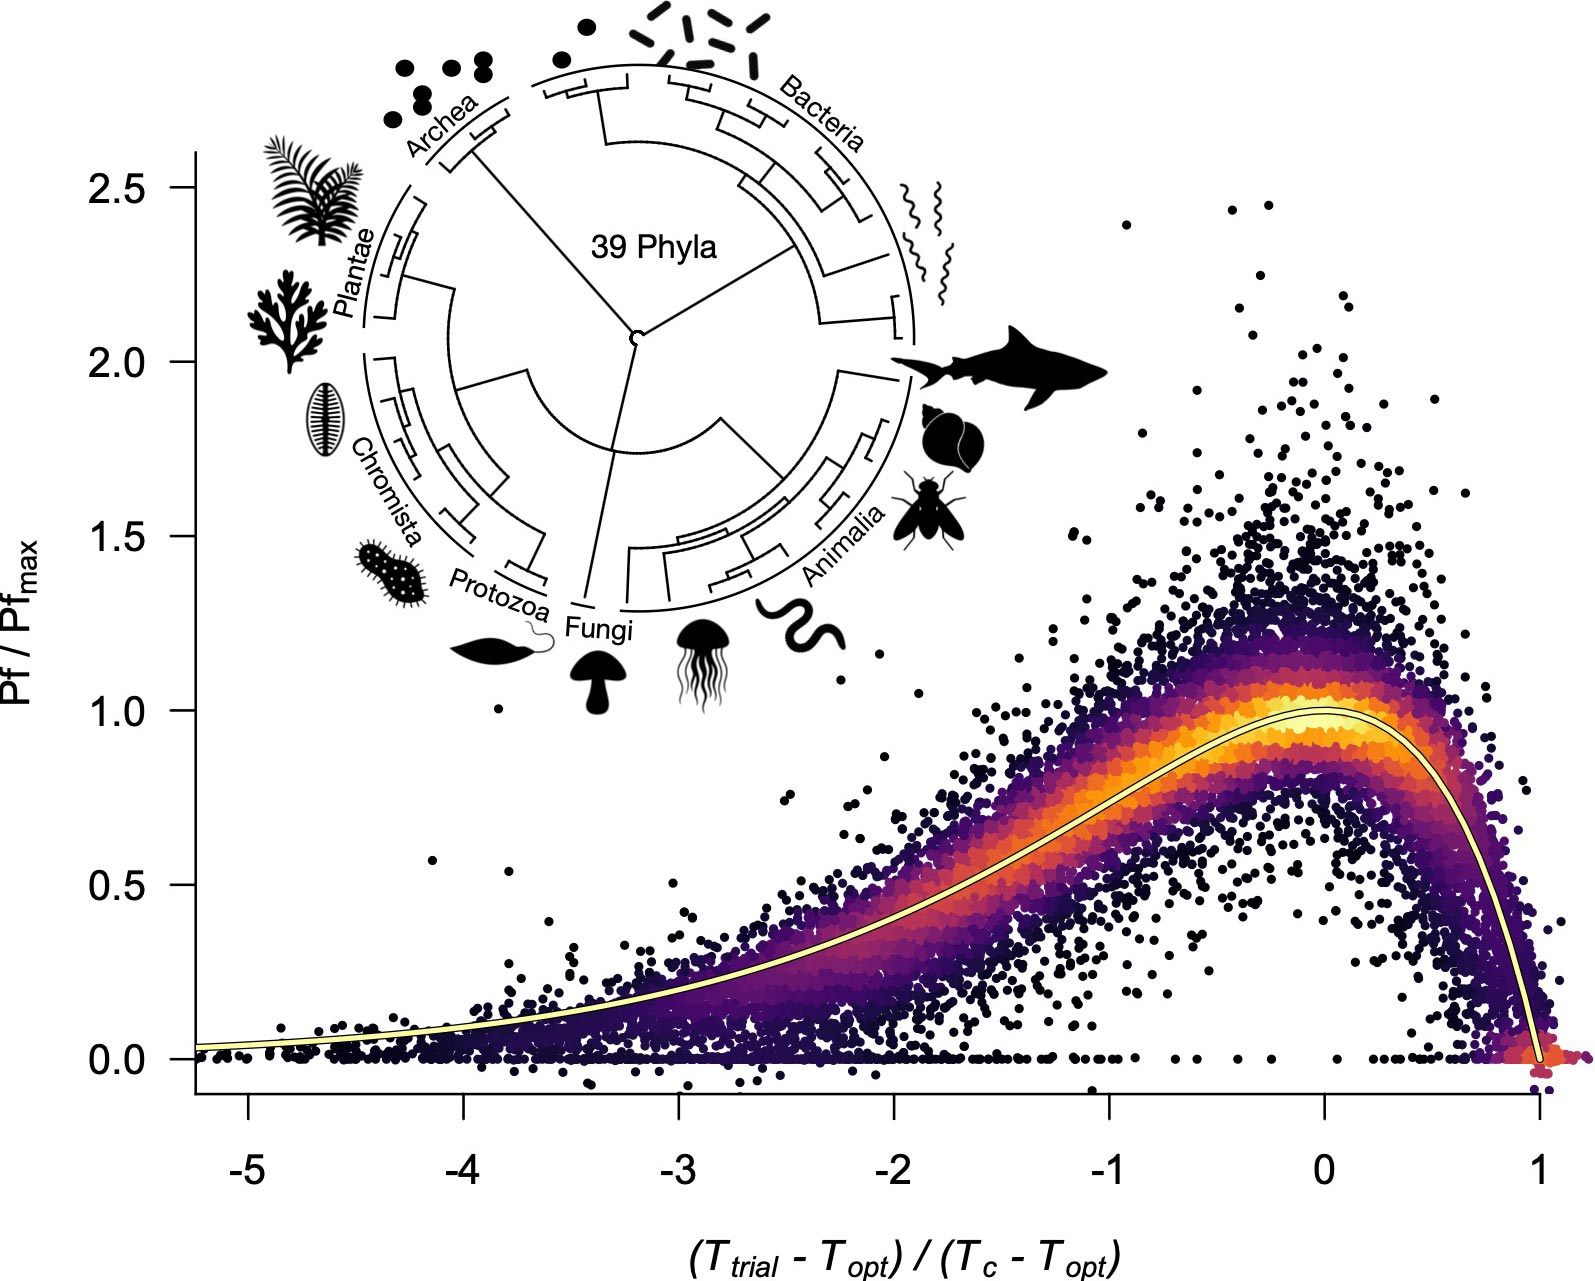
From lizards running on a treadmill, to sharks swimming in the ocean, and cell division rates in bacteria, the universal thermal performance curve applies to all species and dictates how they respond to temperature change. Once things get too hot, performance tails off rapidly. Data collapse, and models converge onto this Universal Thermal Performance Curve (UTPC), which only requires optimal and critical temperatures as parameters. Credit: Prof. Andrew Jackson, Trinity College Dublin
Evolution can shift, not escape
Andrew Jackson, Professor in Zoology in Trinity’s School of Natural Sciences, and co-author, said: “Across thousands of species and almost all groups of life including bacteria, plants, reptiles, fish, and insects, the shape of the curve that describes how performance changes with temperature is very similar. However, different species have very different optimal temperatures, ranging from 5 °C to 100 °C (41 °F to 212 °F), and their performance can vary a lot depending on the measure of performance being observed and the species in question.”
“That has led to countless variations on models being proposed to explain these differences. What we have shown here is that all the different curves are in fact the same exact curve, just stretched and shifted over different temperatures. And what’s more, we have shown that the optimal temperature and the critical maximum temperature at which death occurs are inextricably linked.”
“Whatever the species, it simply must have a smaller temperature range at which life is viable once temperatures shift above the optimum.”
A benchmark for a warming world
Senior author, Dr. Nicholas Payne, from Trinity’s School of Natural Sciences, added: “These results have sprung forward from an in-depth analysis of over 2,500 different thermal performance curves, which comprise a tremendous variety of different performance measures for a similarly tremendous variety of different species – from bacteria to plants, and from lizards to insects.”
“This means the pattern holds for species in all major groups that have diverged massively as the tree of life has grown throughout billions of years of evolution. Despite this rich diversity of life, our study shows basically all life forms remain remarkably constrained by this ‘rule’ on how temperature influences their ability to function. The best evolution has managed is to move this curve around – life hasn’t found a way to deviate from this one very specific thermal performance shape.”
“The next step is to use this model as something of a benchmark to see if there are any species or systems we can find that may, subtly, break away from this pattern. If we find any, we will be excited to ask why and how they do it – especially given forecasts of how our climate is likely to keep warming in the next decades.”
Reference: “A universal thermal performance curve arises in biology and ecology” by Jean-François Arnoldi, Andrew L. Jackson, Ignacio Peralta-Maraver and Nicholas L. Payne, 22 October 2025, Proceedings of the National Academy of Sciences.
DOI: 10.1073/pnas.2513099122
This work was supported by Research Ireland and a Marie Sklodowska-Curie Postdoctoral Fellow grant.
Never miss a breakthrough: Join the SciTechDaily newsletter.
Follow us on Google and Google News.
19 Comments
Fascinating article on the relationship between temperature as it changes and performance levels. I find people have very different to speeds of reaction to temperaturre. What i sense immediately another person may take a half hour until very uncomfortable. and take longer to recouperate. I’d like to see a study of how that interplays with performance, resilience etc. the slower to react may have a longer window of top performance. This may affect climate change era suitability
1 * Metabolism is expressed through a fixed equation containing a constant term of temperature in °Kelvin,for evolution with time.
2 * Evolution of different species with time,ìs represented through a curvature on the geo-surface.
Thus,the present universal rule relating temperature of environment to the activity of living organisms can be explained;optimum temperature of the organism with critical maximum temperature for life to sustain are being considered.
Ànyhow,the works of the authors to establishe rule-UTPC,by accomplishment of useful data and diagrams,is satisfactory and prized.
Though in the original work,constant term in the equation of metabolism is presumed to be connected with cosmic ray,a final conversion of this related to an equivalent temperature in °kelvin is viewed.
A paper from 2016 showed the same results for ALL life – bacteria, archaea, and eukarya, but not complex eukarya. Also usefully the biokinetic curve found in the this recent paper has been described empirically as a model by Ratkowsky and colleagues from… 1983 (the Ratkowsky Square root model) and there is R script for this model.
See:
Corkrey et al. 2016 A Biokinetic Spectrum published in PLos One
Ratkowsky et al. 1983 Journal of Bacteriology.
Also see the paper by Tom Ross on Bělehrádek-type models published in the Journal of Industrial Microbiology in 2018.
The concepts in this PNAS paper and the earlier literature is based on ideas going back a century.
Is there anything truly new under our G2V-type sun?
In my opinion, Life is a heat engine that works due to the temperature difference between the surface of Earth and the universe (Background Cosmic radiation). So there will be an optimum temperature for every form of life, the earliest forms of life having a relatively higher temperature.
What does this have to do with evolution?
People who have little to no education think that their opinions matter. That’s all.
People with little to no education like to make such pronouncements, and when others laugh at them, they think they are “ahead of their time.”
An upper limit to resiliance
I am not sure what new information comes from this. Life is fundamentally enzyme-driven – the reaction speed of its chemistry doesn’t work otherwise. Enzymes have different functional temperature ranges, outside of which they may hardly work at all. Adaptations to seasonal temperature change are largely a matter of changing the enzyme palette. So it’s self-evident that organisms only operate well in certain temperature ranges. Unless they are given time to adapt and re-tested, you can’t say anything at all about their ability to adapt to change. Discovering that enzyme kinetics are closely similar across their entire range in different species doesn’t seem to be much of a discovery.
Oh no! We’re all going to die!
🤣🤣🤣
Is there a reference for this article? I am interested in learning what specimens did not reach the optimal conditions, some graph lines do not appear to turn down.
Does this apply to water bear/tardigrade?
Performance appears to drop off in both directions, heat is fast, cold slower, the width of the curves to either side are so small it doesn’t matter. Snow Ball Earth is obviously much more deadly than the tropical Earth of past holocenes. Until climate scientists can explain why this holocene is so much cooler than past holocenes they have no credibility with me at all. Also, climate science has been predicting this Holocene will be warming all along, not much of a prediction considering heat island effects constantly increasing as our cities constantly grow, without any consideration for the bad architectural choices that create it, mean while the public says, “YUP, that’s global warming”, while the best climate scientists say, “That’s not climate!” If our holocene were the same as ALL past holocene we would have became, Tropical Earth, thousands of years ago,
bePerformance appears to drop off in both directions, heat is fast, cold slower, the width of the curves to either side are so small it doesn’t matter. Snow Ball Earth is obviously much more deadly than the tropical Earth of past holocenes. Until climate scientists can explain why this holocene is so much cooler than past holocenes they have no credibility with me at all. Also, climate science has been predicting this Holocene will be warming all along, not much of a prediction considering heat island effects constantly increasing as our cities constantly grow, without any consideration for the bad architectural choices that create it, meanwhile the public says, “YUP, that’s global warming”, while the best climate scientists say, “That’s not climate!” If our holocene were the same as ALL past holocene we would have became, Tropical Earth, thousands of years ago …
WHY IS OUR HOLOCENE SOO MUCH COLLER THAN NORMAL?
WHY IS OUR HOLOCENE SOO MUCH COLLER THAN NORMAL?
Performance appears to drop off in both directions, heat is fast, cold slower, the width of the curves to either side are so small it doesn’t matter. Snow Ball Earth is obviously much more deadly than the tropical Earth of past holocene. Until climate scientists can explain why this holocene is so much cooler than past holocene they have no credibility with me at all. Also, climate science has been predicting this Holocene will be warming all along, not much of a prediction considering heat island effects constantly increasing as our cities constantly grow, without any consideration for the bad architectural choices that create it, meanwhile the public says, “YUP, that’s global warming”, while the best climate scientists say, “That’s not climate!” If our holocene were the same as ALL past holocene we would have became, Tropical Earth, a few thousands of years ago.
When dinosaurs were around, there were no ice caps.
The blue-green algae poisoned the earth surface with O2. Thereby changing the chemistry and the possibility of life on the surface. The singel-celle life previous to this shift had a much slower metabolism, but did they have the same heat limit curve?