New research finds most U.S. COVID-19 infections went uncounted, highlighting the value of smarter data models for understanding pandemics.
Government officials and policymakers have tried to use numbers to grasp COVID-19’s impact. Figures like the number of hospitalizations or deaths reflect part of this burden. Each datapoint tells only part of the story. But no one figure describes the true pervasiveness of the novel coronavirus by revealing the number of people actually infected at a given time — an important figure to help scientists understand if herd immunity can be reached, even with vaccinations.
Now, two University of Washington scientists have developed a statistical framework that incorporates key COVID-19 data — such as case counts and deaths due to COVID-19 — to model the true prevalence of this disease in the United States and individual states. Their approach, published the week of July 26 in the Proceedings of the National Academy of Sciences, projects that in the U.S. as many as 60% of COVID-19 cases went undetected as of March 7, 2021, the last date for which the dataset they employed is available.
This framework could help officials determine the true burden of disease in their region — both diagnosed and undiagnosed — and direct resources accordingly, said the researchers.
Combining Data Sources to Reduce Bias
“There are all sorts of different data sources we can draw on to understand the COVID-19 pandemic — the number of hospitalizations in a state, or the number of tests that come back positive. But each source of data has its own flaws that would give a biased picture of what’s really going on,” said senior author Adrian Raftery, a UW professor of sociology and of statistics. “What we wanted to do is to develop a framework that corrects the flaws in multiple data sources and draws on their strengths to give us an idea of COVID-19’s prevalence in a region, a state or the country as a whole.”
Data sources can be biased in different ways. For example, one widely cited COVID-19 statistic is the proportion of test results in a region or state that come back positive. But since access to tests, and a willingness to be tested, vary by location, that figure alone cannot provide a clear picture of COVID-19’s prevalence, said Raftery.
Other statistical methods often try to correct the bias in one data source to model the true prevalence of disease in a region. For their approach, Raftery and lead author Nicholas Irons, a UW doctoral student in statistics, incorporated three factors: the number of confirmed COVID-19 cases, the number of deaths due to COVID-19 and the number of COVID-19 tests administered each day as reported by the COVID Tracking Project. In addition, they incorporated results from random COVID-19 testing of Indiana and Ohio residents as an “anchor” for their method.
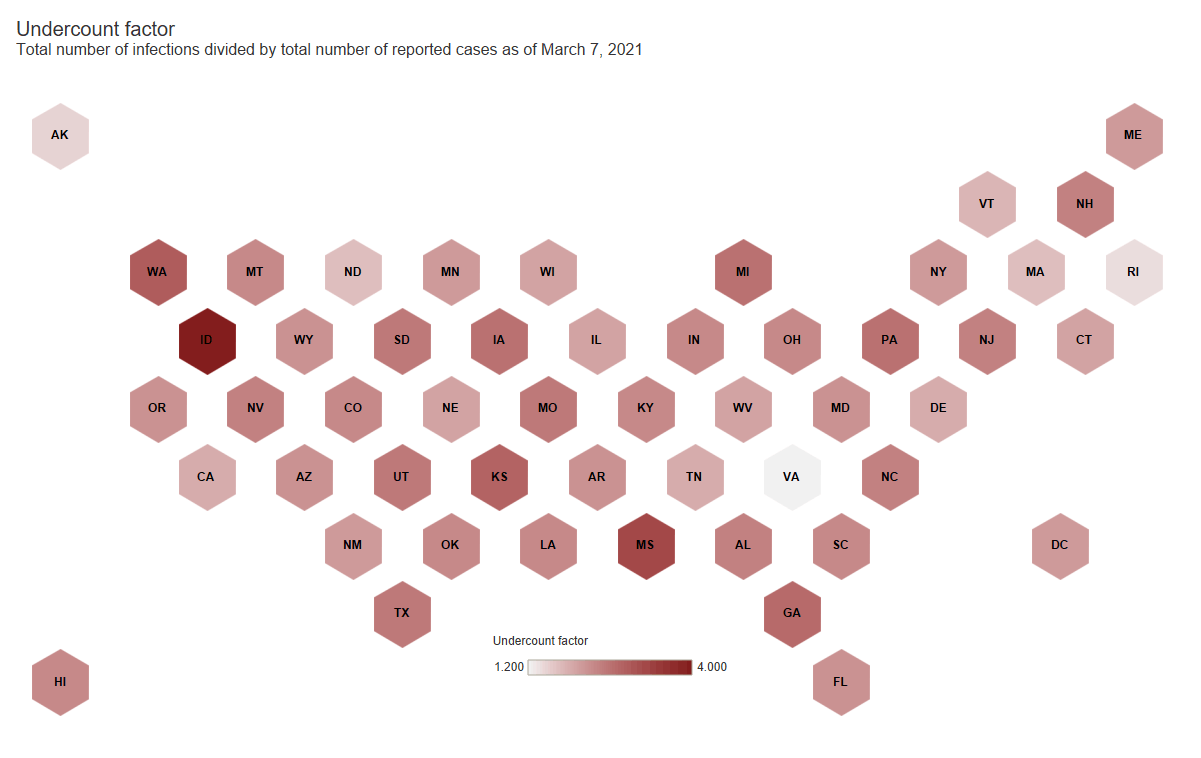
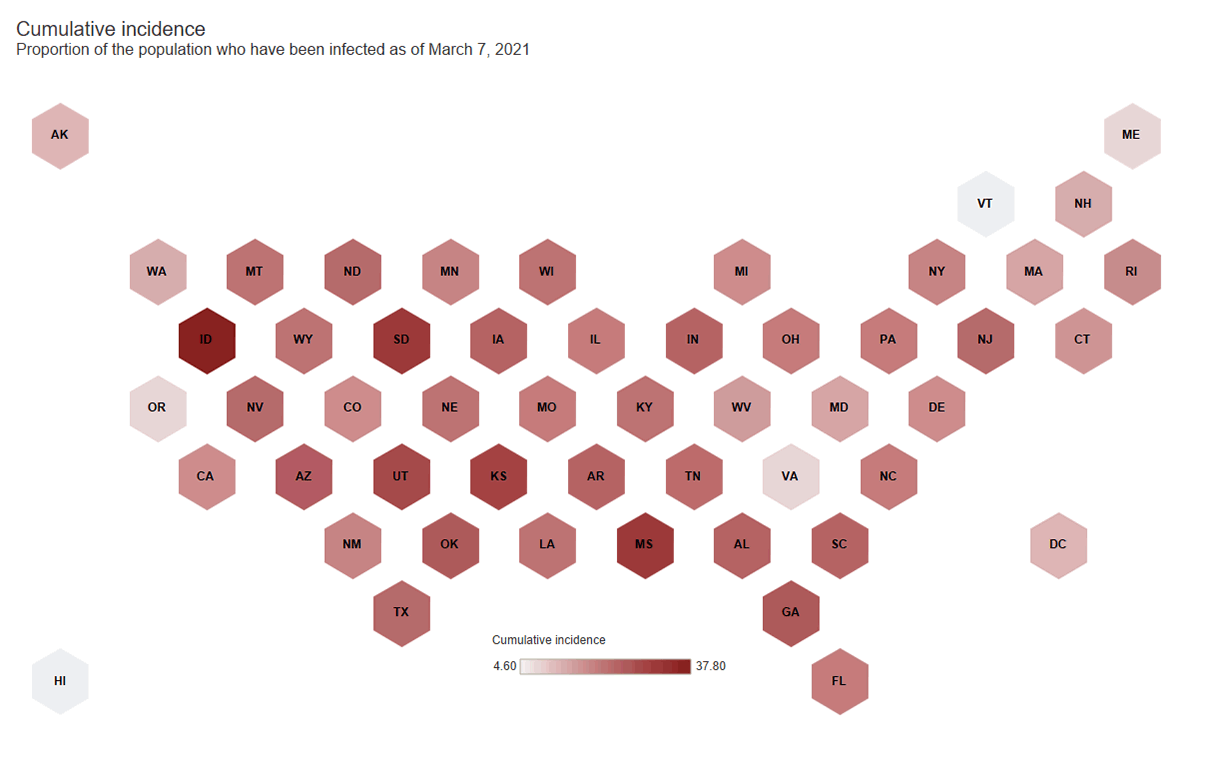
The researchers used their framework to model COVID-19 prevalence in the U.S. and each of the states up through March 7, 2021. On that date, according to their framework, an estimated 19.7% of U.S. residents, or about 65 million people, had been infected. This indicates that the U.S. is unlikely to reach herd immunity without its ongoing vaccination campaign, Raftery and Irons said. In addition, the U.S. had an undercount factor of 2.3, the researchers found, which means that only about 1 in 2.3 COVID-19 cases were being confirmed through testing. Put another way, some 60% of cases were not counted at all.
This COVID-19 undercount rate also varied widely by state, and could have multiple causes, according to Irons.
“It can depend on the severity of the pandemic and the amount of testing in that state,” said Irons. “If you have a state with severe pandemic but limited testing, the undercount can be very high, and you’re missing the vast majority of infections that are occurring. Or, you could have a situation where testing is widespread and the pandemic is not as severe. There, the undercount rate would be lower.”
In addition, the undercount factor fluctuated by state or region as the pandemic progressed due to differences in access to medical care among regions, changes in the availability of tests and other factors, Raftery said.
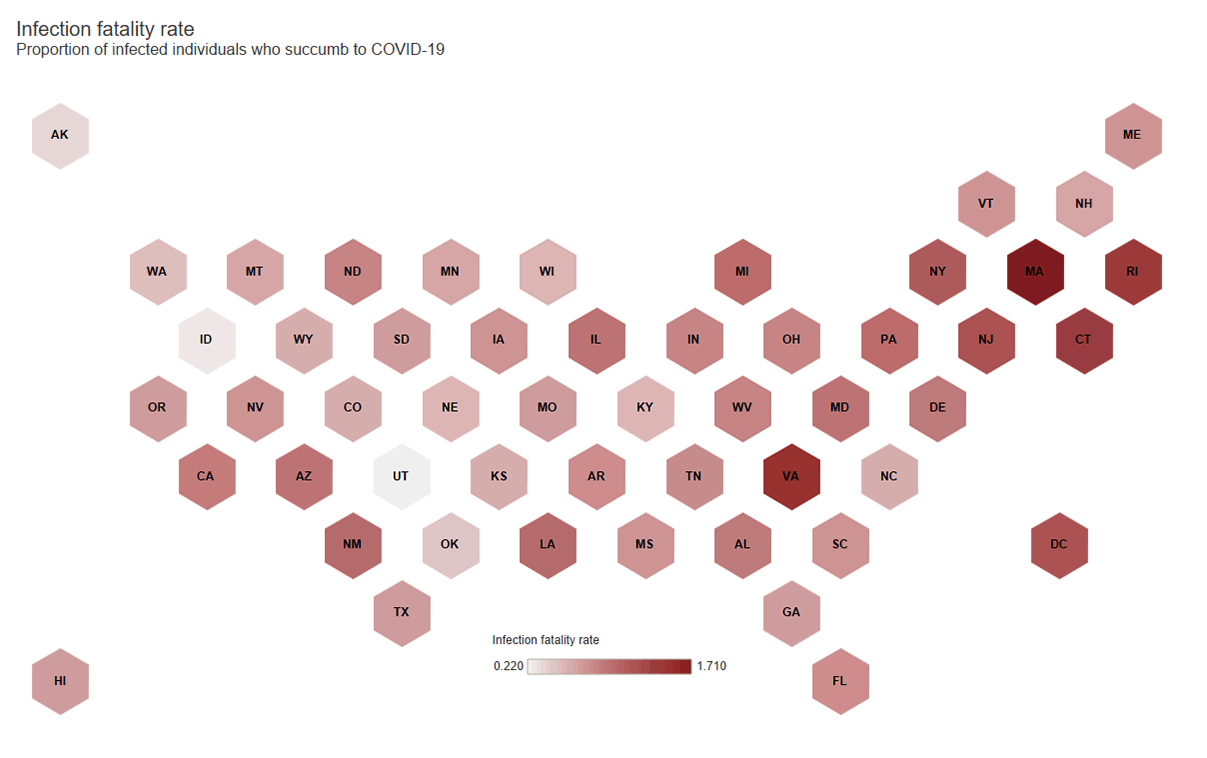
With the true prevalence of COVID-19, Raftery and Irons calculated other useful figures for states, such as the infection fatality rate, which is the percentage of infected people who had succumbed to COVID-19, as well as the cumulative incidence, which is the percentage of a state’s population who have had COVID-19.
A Tool for the Current and Future Pandemics
Ideally, regular random testing of individuals would show the level of infection in a state, region or even nationally, said Raftery. But in the COVID-19 pandemic, only Indiana and Ohio conducted random viral testing of residents, datasets that were critical in helping the researchers develop their framework. In the absence of widespread random testing, this new method could help officials assess the true burden of disease in this pandemic and the next one.
“We think this tool can make a difference by giving the people in charge a more accurate picture of how many people are infected, and what fraction of them are being missed by current testing and treatment efforts,” said Raftery.
LIST (below) of the COVID-19 infection fatality rate, cumulative incidence and undercount factors (respectively) for U.S. states and Washington, D.C., as of March 7, 2021. Figures are the posterior median, with the 95% confidence intervals indicated in parentheses. Credit: Irons and Raftery, PNAS, 2021.
State/Territory: Infection Fatality Rate, Cumulative Incidence, Undercount Factor
Alabama: 0.90% (0.70-1.15), 24.0% (18.8-30.6), 2.4 (1.8-3.0)
Alaska: 0.35% (0.28-0.43), 11.8% (10.1-14.2), 1.5 (1.3-1.8)
Arizona: 0.93% (0.75-1.14), 24.5% (20.1-30.3), 2.2 (1.8-2.7)
Arkansas: 0.78% (0.64-0.95), 23.2% (19.2-28.4), 2.2 (1.8-2.7)
California: 0.88% (0.70-1.09), 16.9% (13.6-20.9), 1.9 (1.6-2.4)
Colorado: 0.60% (0.49-0.71), 17.2% (14.6-20.9), 2.3 (2.0-2.8)
Connecticut: 1.37% (1.10-1.70) 15.9% (12.9-19.9) 2.0 (1.6-2.5)
Delaware: 0.92% (0.74-1.13), 17.0% (14.0-21.0), 1.9 (1.6-2.3)
Florida: 0.78% (0.64-0.94), 19.5% (16.3-23.8), 2.2 (1.9-2.8)
Georgia: 0.67% (0.54-0.82), 25.9% (21.4-32.0), 2.7 (2.2-3.4)
Hawaii: 0.70% (0.54-0.91), 4.6% (3.6-5.8), 2.3 (1.8-2.9)
Idaho: 0.28% (0.23-0.33), 37.8% (32.1-45.9), 4.0 (3.4-4.8)
Illinois: 0.96% (0.78-1.16), 19.3% (16.1-23.7), 2.0 (1.7-2.5)
Indiana: 0.84% (0.70-1.00), 22.9% (19.2-27.6), 2.3 (1.9-2.8)
Iowa: 0.76% (0.61-0.97), 23.6% (18.7-29.5), 2.6 (2.1-3.3)
Kansas: 0.59% (0.47-0.75), 28.6% (22.6-36.1), 2.8 (2.2-3.5)
Kentucky: 0.53% (0.43-0.63), 21.4% (18.0-25.8), 2.3 (2.0-2.8)
Louisiana: 1.01% (0.82-1.22), 21.1% (17.5-26.1), 2.3 (1.9-2.8)
Maine: 0.73% (0.60-0.87), 7.3% (6.2-8.8), 2.1 (1.8-2.6)
Maryland: 0.94% (0.77-1.15), 13.9% (11.5-17.1), 2.2 (1.8-2.7)
Massachusetts: 1.71% (1.36-2.13), 14.4% (11.6-18.0), 1.7 (1.4-2.1)
Michigan: 1.00% (0.77-1.29), 17.1% (13.3-22.1), 2.6 (2.0-3.4)
Minnesota: 0.64% (0.52-0.76), 18.4% (15.4-22.4), 2.1 (1.8-2.6)
Mississippi: 0.74% (0.61-0.89), 31.6% (26.6-38.6), 3.2 (2.7-3.9)
Missouri: 0.69% (0.55-0.87), 19.6% (15.8-24.7), 2.5 (2.0-3.2)
Montana: 0.62% (0.50-0.75), 21.0% (17.5-25.5), 2.3 (1.9-2.8)
Nebraska: 0.53% (0.43-0.64), 21.1% (17.7-25.7), 2.0 (1.7-2.5)
Nevada: 0.73% (0.59-0.87), 22.5% (18.8-27.5), 2.4 (2.0-2.9)
New Hampshire: 0.66% (0.54-0.79), 13.4% (11.3-16.2), 2.4 (2.0-2.9)
New Jersey: 1.22% (0.97-1.53), 22.2% (17.7-28.0), 2.4 (1.9-3.1)
New Mexico: 1.01% (0.83-1.21) 18.6% (15.6-22.7) 2.1 (1.8-2.5)
New York: 1.12% (0.87-1.42), 18.6% (14.7-23.9), 2.1 (1.7-2.8)
North Carolina: 0.58% (0.48-0.68), 19.4% (16.5-23.4), 2.4 (2.0-2.8)
North Dakota:, 0.86% (0.71-1.03), 22.4% (19.0-27.1), 1.7 (1.4-2.0)
Ohio: 0.83% (0.68-1.03), 19.5% (15.9-23.7), 2.3 (1.9-2.9)
Oklahoma: 0.47% (0.38-0.56), 25.1% (21.1-30.6), 2.3 (1.9-2.8)
Oregon: 0.69% (0.55-0.85), 8.2% (6.7-10.0), 2.2 (1.8-2.8)
Pennsylvania: 1.00% (0.82-1.19), 19.4% (16.4-23.7), 2.6 (2.2-3.2)
Rhode Island: 1.41% (1.14-1.72), 17.4% (14.3-21.4), 1.4 (1.2-1.8)
South Carolina: 0.76% (0.63-0.91), 23.0% (19.4-28.0), 2.3 (1.9-2.8)
South Dakota: 0.68% (0.56-0.82), 31.2% (26.1-37.9), 2.5 (2.1-3.0)
Tennessee: 0.79% (0.64-0.97), 21.8% (17.7-26.9), 1.9 (1.6-2.4)
Texas: 0.70% (0.57-0.85), 22.7% (18.8-27.8), 2.5 (2.1-3.0)
Utah: 0.22% (0.18-0.26), 28.0% (23.8-33.7), 2.5 (2.1-3.0)
Vermont: 0.72% (0.57-0.92), 4.6% (3.8-5.6), 1.8 (1.5-2.2)
Virginia: 1.53% (1.09-2.36), 8.3% (5.5-11.7), 1.2 (0.8-1.7)
Washington: 0.51% (0.41-0.64), 12.9% (10.3-16.1), 2.9 (2.3-3.6)
West Virginia: 0.86% (0.71-1.01), 15.4% (13.2-18.5), 2.0 (1.8-2.5)
Wisconsin: 0.57% (0.46-0.69), 21.5% (17.9-26.6), 2.0 (1.7-2.5)
Wyoming: 0.58% (0.46-0.71), 21.0% (17.3-25.9), 2.2 (1.8-2.7)
Washington, D.C.: 1.19% (0.94-1.49), 12.2% (9.8-15.3), 2.1 (1.7-2.7)
Reference: “Estimating SARS-CoV-2 infections from deaths, confirmed cases, tests, and random surveys” by Nicholas J. Irons and Adrian E. Raftery, 26 July 2021, Proceedings of the National Academy of Sciences.
DOI: 10.1073/pnas.2103272118
The research was funded by the National Institutes of Health.
Never miss a breakthrough: Join the SciTechDaily newsletter.
Follow us on Google and Google News.