With oceans rising faster, NASA’s collaborative global sea level change website provides vital data for forecasting up to 2150 and guides international and governmental planning to mitigate climate change impacts.
Earth’s oceans are rising, posing significant challenges to coastal communities by disrupting livelihoods and damaging infrastructure. To help communities prepare for these changes, agencies and organizations worldwide are leveraging NASA’s critical data and insights.
Comprehensive Resource Development
NASA’s global sea level data is now accessible in the sea level section of the Earth Information Center. This resource was developed in collaboration with the U.S. Department of Defense, the World Bank, the U.S. Department of State, and the United Nations Development Programme.
The site provides projections of sea level rise through 2150 for coastlines worldwide and estimates the flooding risks that coastal regions may face over the next 30 years. These projections are based on data collected by NASA and its partners, advanced computer models of ice sheets and oceans, the latest sea level assessments from the Intergovernmental Panel on Climate Change, and other key scientific sources.
“NASA innovates for the benefit of humanity. Our cutting-edge instruments and data-driven information tools help communities and organizations respond to natural hazards and extreme weather, and inform critical coastal infrastructure planning decisions,” said Karen St. Germain, director of the Earth science division at NASA Headquarters in Washington.
Strategic Global Application
International organizations such as the World Bank will use the data from the global sea level change site for tasks including the creation of Climate Risk Profiles for countries especially vulnerable to sea level rise.
The Defense Department will continue to incorporate sea level rise data into its plans to anticipate and respond to hazards posed to its facilities by the effects of rising oceans. Similarly, the State Department uses the information for activities ranging from disaster preparedness to long-term adaptation planning to supporting partners around the world in related efforts.
“We are at a moment of truth in our fight against the climate crisis. The science is unequivocal and must serve as the bedrock upon which decision-making is built. With many communities around the world already facing severe impacts from sea-level rise, this new resource provides a vital tool to help them protect lives and livelihoods. It also illustrates what is at stake between a 1.5-degree-Celsius world and a current-policies trajectory for all coastal communities worldwide,” said Assistant Secretary-General Selwin Hart, special adviser to the United Nations secretary-general on climate action and just transition.
Evidence of Acceleration
NASA-led data analyses have revealed that between 1970 and 2023, 96% of countries with coastlines have experienced sea level rise. The rate of that global rise has also accelerated, more than doubling from 0.08 inches (0.21 centimeters) per year in 1993 to about 0.18 inches (0.45 centimeters) per year in 2023.
As the rate of sea level rise increases, millions of people could face the related effects sooner than previously projected, including larger storm surges, more saltwater intrusion into groundwater, and additional high-tide flood days — also known as nuisance floods or sunny day floods.
“This new platform shows the timing of future floods and the magnitude of rising waters in all coastal countries worldwide, connecting science and physics to impacts on people’s livelihoods and safety,” said Nadya Vinogradova Shiffer, director of the ocean physics program at NASA Headquarters in Washington.
Data released earlier this year found that Pacific Island nations will experience at least 6 inches (15 centimeters) of sea level rise in the next 30 years. The number of high-tide flood days will increase by an order of magnitude for nearly all Pacific Island nations by the 2050s.
“The data is clear: Sea levels are rising around the world, and they’re rising faster and faster,” said Ben Hamlington, a sea level researcher at NASA’s Jet Propulsion Laboratory in Southern California and head of the agency’s sea level change science team. “Having the best information to make decisions about how to plan for rising seas is more crucial than ever.”
Never miss a breakthrough: Join the SciTechDaily newsletter.
Follow us on Google and Google News.
12 Comments
The whole situation with sea level rise, and the claim of acceleration over recent years, is too complex to rely on just NASA arm waving. First of all, all extrapolation is fraught with risk because we are not in control of exogenous forcings. The leashes on the Black Swans are very long. Secondly, there are periodic influences on tide that have astronomical origins. And, it is difficult to disentangle the effects of local land subsidence from thermosteric expansion of water, which have different causes. (see https://scitechdaily.com/californias-farmland-is-sinking-faster-than-ever-can-we-stop-it/ )
You might find it enlightening to read https://wattsupwiththat.com/2024/08/11/variation-of-50-year-relative-sea-level-trends-northeast-united-states/
And, if you have some time on your hands, look at the graphs and read here: https://wattsupwiththat.com/2024/07/21/comparing-uah-temperatures-nasa-sea-levels-and-el-nino-la-nina-data/
Interesting web-site, that bottom one; full of stuff that would confuse the average man or woman in the street. The art of explaining things to we mere mortals is to explain things in everyday language, sort like we live of a spherical trampoline being bounced on by a bunch of kids at random intervals and thus rise in sea level is difficult to measure precisely. Is there indeed a golden spike at a point of absolutely no vertical movement of land during the last few hundred years and by which we can measure absolute rise in sea-level?
Allow me to reverse the Anthropogenic Global Heating discussion.
In 1944, the year production of antibiotics came on stream, global population was approx. 2.3 billion. In 2024 it is 8.16 billion which is the result of a steady (with minor blips) exponential growth in numbers.
In 1944, atmospheric CO2 content and that of other greenhouse gases was probably not being measured but Dr Google comes up with the astonishingly precise number of 310.2ppm CO2; let’s agree on something between 305 and 315 ppm for sake of argument. It is now 425ppm. As measured since 1944 that has been an exponential increase.
Since 1944 we have seen H sapiens burn ever-increasing amounts of hydrocarbons to obtain energy for an increasingly technologically complex world civilisation. Burning hydrocarbons produces CO2etcetc. One of those hydrocarbons is natural gas, basically methane and mining and transport of methane is not without leakage, and likewise coal, although statistically that may be small beer.
So, CO2 and other stuff being greenhouse gases, why should Anthropogenic Global Heating not be occurring?
If it is occurring (and the odds are that it is, as based on the above facts), what really matters is the rate at which it is occurring, which may be arguable and probably is, but the precautionary principle needs to be applied to what we do globally lest we get our feet wet as our house built on sand by the sea should fall about our ears.
You asked, “So, CO2 and other stuff being greenhouse gases, why should Anthropogenic Global Heating not be occurring?”
There are two parts to an answer to your question: An examination of the seasonal CO2 changes at a monthly temporal resolution strongly suggests that the seasonal changes are driven by biogenic forces. Also, despite sizeable reductions in anthropogenic CO2 in 2020, there was no discernible difference in the slope or peak of the seasonal ramp-up of CO2. That is difficult to explain unless temperature changes are controlling biological activity, which isn’t much of a stretch.
The other part to the answer is that the singular fact that so-called greenhouse gases is used as the explanation for warming but ignores the observation that most feedback loops in nature tend to be negative feedback loops. Therefore, one has to look at the net effect of all the forcings and feedbacks to understand what is happening. General Circulation Models attempt to do that, but after about 40 years are still running warm compared to actual measurements, and precipitation forecasts perform even more poorly.
Name one common human endeavor that faithfully adheres to the Precautionary Principle. Chauncey Starr demonstrated that people consistently were willing to take chances in direct proportion (actually on a log-log graph) to their perceived benefit from the activity.
“Name one common human endeavor that faithfully adheres to the Precautionary Principle. ”
Vaccination. Although these days there are enough people around who refuse to consider that it actually does work for the majority of the vaccinated. Some folk have bad reactions to vaccines, but that is a minority. However, H sapiens is indeed collectively daft in just about all fields of endeavour, otherwise we wouldn’t fight wars and build houses on sand dunes for the sea-view, irrespective of ideas about AGH.
Thanks for the previous two paragraphs. However, I still view the increase in global CO2, human population and energy use as linked and not just coincidence; perhaps time will tell, and I will be very happy to be proved wrong by events, if I live long enough.
The Precautionary Principle is a recommended course of action for a possible threat for which there is inconclusive evidence that it is actually a threat, let alone what the probability is. Despite many people rationalizing their refusal to be vaccinated, there is plenty of evidence that, while there may be some issues, vaccines have proven to be beneficial and most of the resistance is irrational. Most notably, the extinction of smallpox and polio. Vaccination, therefore, doesn’t meet the definition of the PP.
Curses! So the Precautionary Principle should apply to global warming threats, for which perhaps there is inconclusive evidence that it is actually a threat, let alone a probability.
Therefore:1) those who don’t consider that the evidence for AGH is sound or “in” should respect the Precautionary Principle and should offer their support to we “believers”and; 2) we ”believers” shouldn’t bother buying electric cars, but continue to drive our gas-guzzling V8.
There is some twisted logic in that!
My point was that while the Precautionary Principle is advocated by some as a ‘rational’ approach to dealing with unknowns, there really isn’t anyone who actually practices it, unless the cost is close to zero. That would be in the category of reactions to superstitions, such as not stepping on a crack in the sidewalk by shortening one’s stride for one step or throwing salt over one’s shoulder. In the real world that people live in, they are generally unwilling to pay more than a token. The recommendations for preventing anthropogenic global warming typically have substantial costs associated with activities that haven’t been shown can be prevented, as I showed with the analysis of CO2 reductions during the peak of the COVID pandemic.
I was in a rush last night because it was bedtime in my time zone, therefore, I left out two additional points.
El Nino years have an anomalous seasonal ramp-up related to the years being unusually warm. That is, anthro’ CO2 cannot be causing El Ninos, so the warm El Ninos must be causing the CO2 increase. Secondly, I believe it is the Law Dome C (Antarctica) ice core that strongly suggests that CO2 changes follow the changes in temperature by several hundred years.
That is not to say that there aren’t feedback loops with CO2 causing some warming, but on the whole, it appears to me that the Carbon Cycle is driven dominantly by biogenic forcing such that warming is the principle driver of increasing CO2.
Thanks again: it sort of reminds me of a cat chasing its tail. Although cat and tail both happened together, which to some extent is your point.
It is a difficult line to walk between not writing over the heads of one’s audience, and simplifying the discussion so much that people get the wrong impression, which I think happens with most of the NASA press releases on climatology.
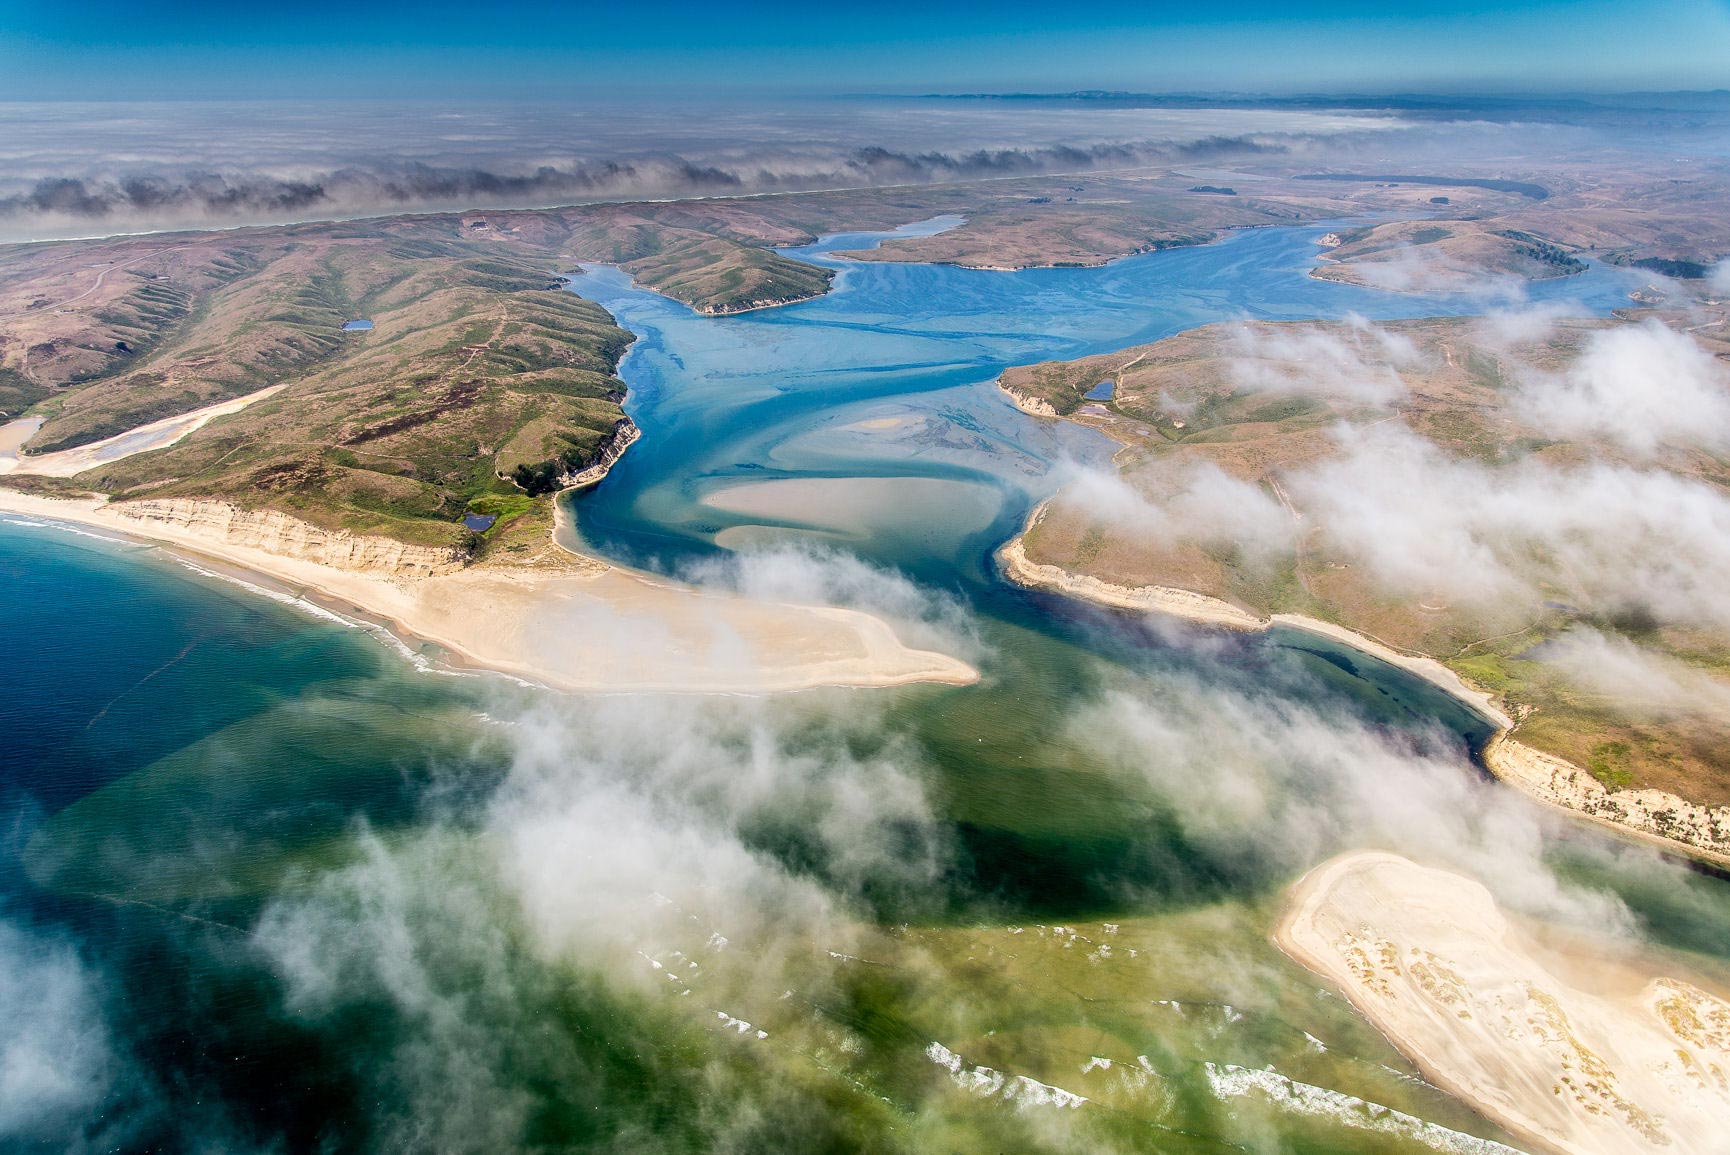
Interesting photo; San Andreas Fault in the background and what appears to be an aggrading river to the left side. My guess is that bit of land in the foreground could be rising. OK; that sand-spit is ripening for some expensive Real Estate development…………..
In reality that apparently aggrading river indicates that land is sinking relative to sea-level. However, the Real Estate mob will sell anything……it’s a prime site for a marina, sheltered waters ect.