
The Historic Extremity of the Event Serves as a Warning for Other Regions
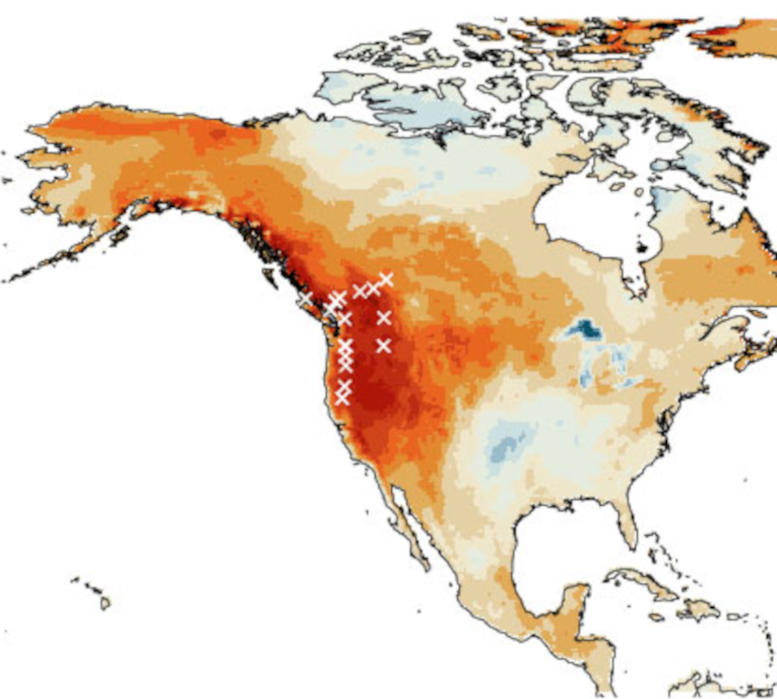
During the summer of 2021, an unprecendented heatwave swept across western North America, affecting regions from British Columbia to Washington, Oregon, and beyond into other interior areas that typically experience a mild climate. Temperatures shattered records in many locations, resulting in widespread wildfires and the tragic loss of at least 1,400 lives. While scientists have attributed this event primarily to human-caused climate change, labeling it as unprecedented, it is difficult to determine with certainty if it truly had no prior occurrence due to limited weather data that only dates back to the last century.
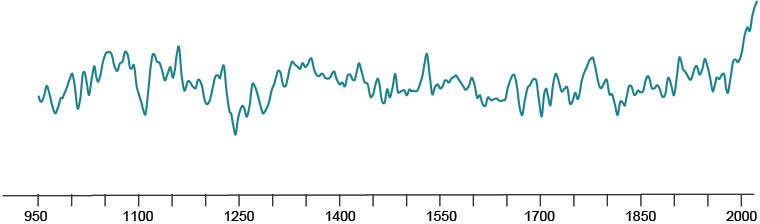
According to a recent study, based on the analysis of tree rings from the region, the 2021 heatwave was almost certainly the most severe in the past thousand years. The findings, which were published in the journal Climate and Atmospheric Science, established a yearly record of summer average temperatures starting from 950 AD. The research revealed numerous summers with abnormal high temperatures, many of which occurred in multi-year warm spells. However, the study highlights that the last 40 years, due to human-induced global warming, have been the hottest, with the summer of 2021 being the warmest of all.
“It’s not that the Pacific Northwest has never before experienced waves of high temperature. But with climate change, their magnitude is much hotter, and they have a much greater impact on the community,” said lead author Karen Heeter, a postdoctoral researcher at Columbia University’s Lamont-Doherty Earth Observatory. “Being able to look at the past and compare that with climate models, and come to similar conclusions, there’s a lot of power in that.”
Comparing Modern and Medieval Temperature Extremes
The tree-ring reconstruction and modern temperature readings show that 1979-2021 saw a sustained period of hot summers unrivaled for the last 1,000-plus years. Most of the hottest years have occurred since 2000. The second-warmest period, indicated by the tree rings, was 1028-1096—at the height of the so-called Medieval Climate Anomaly, when a natural warming trend is thought to have taken hold across large parts of the planet. Another notable hot span during the Medieval Climate Anomaly ran from 1319 to 1307. But even these periods were considerably cooler than temperatures in recent decades.
The 2021 heat wave spanned a several weeks from late June to mid-July. While the researchers did not try to pick out such short periods in the rings, they say average seasonal temperatures are a good proxy for such events. Summer 2021 held the annual record, at 18.9 degrees Centigrade, or about 66 degrees Fahrenheit. By contrast, the hottest summer in prehistoric times was in 1080, at 16.9 degrees C, or 62.4 F.
This perhaps does not sound very impressive—until you consider that due in part to the near-complete human destruction of ancient trees in the lowlands, the researchers used mainly samples collected at mountain elevations above 10,000 feet. Here, temperatures are drastically lower than in the populous lowlands; there is often still snow cover in June. “You have to think about it in the broader context,” said Heeter; one can reasonably add a few tens of degrees for places like Seattle and Portland, she noted. According to the tree rings, the 2021 seasonal temperature spike was nearly 3 degrees F greater than any annual spike shown by tree rings during the Medieval period.
Heeter and her husband and a few colleagues collected about half of the samples for the study during the summers of 2020 and 2021, from high-elevation sites in national forests and parks. She got a personal taste of the 2021 heat wave as she sweltered in 105-degree indoor temperatures in her un-air-conditioned apartment in Moscow, Idaho. She feared going into the field until later in the season, since many target forests or ones near them were on fire, and in some cases, she was blocked from entering by evacuation orders.
To obtain data, the team bored out straw-size samples that provided cross sections of rings from about 600 old conifers in northern Idaho and the Cascade ranges of Oregon and Washington. (The coring process does not hurt the trees.) Their oldest sample came from a mountain hemlock near Oregon’s Crater Lake, which took root in the 1300s. They supplemented these with samples taken in the 1990s by other Lamont-Doherty researchers, mostly in British Columbia. The oldest of these was from a Douglas fir on Vancouver Island, dating to the year 950. The area has since been clear-cut by loggers.
Innovative Techniques for Unlocking Climate Data
Most conventional tree-ring studies focus on ring widths, with wider annual rings generally indicating wetter years. To measure temperature, Heeter and her colleagues instead used a relatively new technique called blue intensity. This involves shining visible light onto a high-resolution scan of each ring, and measuring how much of the blue spectrum is reflected back. Trees generally build thicker cell walls in hotter temperatures, increasing the density of the ring. Denser rings reflect less blue light, and this can be translated into temperature.

Another recent Lamont-Doherty study attributed the extremity of the 2021 heat wave to progressively heightening temperatures caused by humans, combined with shorter-term atmospheric patterns that may or may not have been driven by human-driven climate change. That study suggested that by 2050, such heat waves may hit every 10 years. The new one, which used different models to make forecasts, estimates a 50/50 chance of recurrence each year by 2050.
Preparing for a Hotter Future
With a climate that is usually quite moderate, the region is poorly prepared to cope with such events. For one thing, like Heeter, few people have air conditioning—possibly one reason for the high mortality rate in 2021. “We can use the long-term record to prepare ourselves,” said Heeter. “For instance, maybe it’s not realistic to put air conditioning everywhere, but communities could create refuges where people could go when these things happen again.”
“The unprecedented nature of summer 2021 temperatures across [the study area] suggests that no region is impervious to the economic and biological impacts of increasing summer temperatures,” the authors write. This suggests, they say, that “communities across the world that have not been historically exposed to extreme heat are likely to experience [greater] morbidity and mortality.”
Reference: “Unprecedented 21st century heat across the Pacific Northwest of North America” by Karen J. Heeter, Grant L. Harley, John T. Abatzoglou, Kevin J. Anchukaitis, Edward R. Cook, Bethany L. Coulthard, Laura A. Dye and Inga K. Homfeld, 17 February 2023, npj Climate and Atmospheric Science.
DOI: 10.1038/s41612-023-00340-3
Never miss a breakthrough: Join the SciTechDaily newsletter.
Follow us on Google and Google News.
2 Comments
“But with climate change, their magnitude is much hotter, …”
Just how hot is “much hotter?” Where is the temperature scale for the Summer anomalies in the illustrated time series, and where are the error bars?
It is poor practice to splice measurements (even anomalies) from different climate zones. That is, Vancouver Island would be expected to not only be cooler, but to have less seasonal variation because of its coastal marine climate. It is a classic case of comparing apples and pomegranates. It is also poor practice to compare inherently smoothed proxy measurements to instrumental measurements. One can always expect instrumental measurements to have spikes that aren’t caught by proxies, even when the correlation coefficient is high. At the very least, instrumental data should be delineated with a different color on the graph, or vertical boundary lines, and similarly, data from different climate zones should be clearly marked with different colors on the graph.
“The 2021 heat wave spanned a [sic] several weeks from late June to mid-July. While the researchers did not try to pick out such short periods in the rings, they say average seasonal temperatures are a good proxy for such events.”
If the assumption of average seasonal temperatures being a good proxy for short-duration heat waves is valid, why are the notorious 1930s heat waves not prominent?
https://wattsupwiththat.com/2019/09/06/the-gestalt-of-heat-waves/
“That study suggested that by 2050, such heat waves may hit every 10 years.”
What is the uncertainty envelope for that nominal estimate? From the actual paper, “… 2021 summer average temperatures have a probability estimate of 0.004%, although substantial uncertainty exists for this estimate due to the short duration of instrumental data.” Just what does “substantial” mean. Why not provide the numeric uncertainty?
I’m disappointed that the reviewers for this peer-reviewed article didn’t ask these same questions.
My 9th science students would have done a better job with that graph.
Title?
Description?
Units?
Y-axis?
Are those averages?