Human-driven global warming is advancing rapidly, highlighting an urgent need for action. As COP28 approaches, scientists stress the importance of up-to-date climate data for policymakers. To address information gaps between IPCC reports, researchers have developed the “Indicators of Global Climate Change” platform, providing annual updates on key climate metrics.
According to 50 leading scientists, human-caused global warming has continued to increase at an “unprecedented rate” since the last major assessment of the climate system published two years ago.
One of the researchers said the analysis was a “timely wake-up call” underscoring the current lack of adequate and prompt climate action. This message emerges just as climate specialists gather in Bonn, preparing for the major COP28 climate conference set to take place in the UAE this December. The conference will feature an evaluation of our progress towards achieving the goal of limiting global warming to 1.5°C by 2050.
Given the speed at which the global climate system is changing, the scientists argue that policymakers, climate negotiators, and civil society groups need to have access to up-to-date and robust scientific evidence on which to base decisions.
The authoritative source of scientific information on the state of the climate is the UN’s Intergovernmental Panel on Climate Change (IPCC) but the turnaround time for its major assessments is five or ten years, and that creates an “information gap,” particularly when climate indicators are changing rapidly.
In an initiative being led by the University of Leeds, the scientists have developed an open data, open science platform – the Indicators of Global Climate Change and website. It will update information on key climate indicators every year.
Critical Decade for Climate Change
The Indicators of Global Climate Change Project is being coordinated by Professor Piers Forster, Director of the Priestley Centre for Climate Futures at Leeds. He said: “This is the critical decade for climate change.
“Decisions made now will have an impact on how much temperatures will rise and the degree and severity of impacts we will see as a result.
“Long-term warming rates are currently at a long-term high, caused by highest-ever levels of greenhouse gas emissions. But there is evidence that the rate of increase in greenhouse gas emissions has slowed.
“We need to be nimble-footed in the face of climate change. We need to change policy and approaches in light of the latest evidence about the state of the climate system. Time is no longer on our side. Access to up-to-date information is vitally important.”
Writing in the journal Earth System Science Data, the scientists have revealed how key indicators have changed since the publication of the IPCC’s Sixth Assessment Working Group 1 report in 2021- which produced the key data that fed into the subsequent IPCC Sixth Synthesis Report.
What the Updated Indicators Show
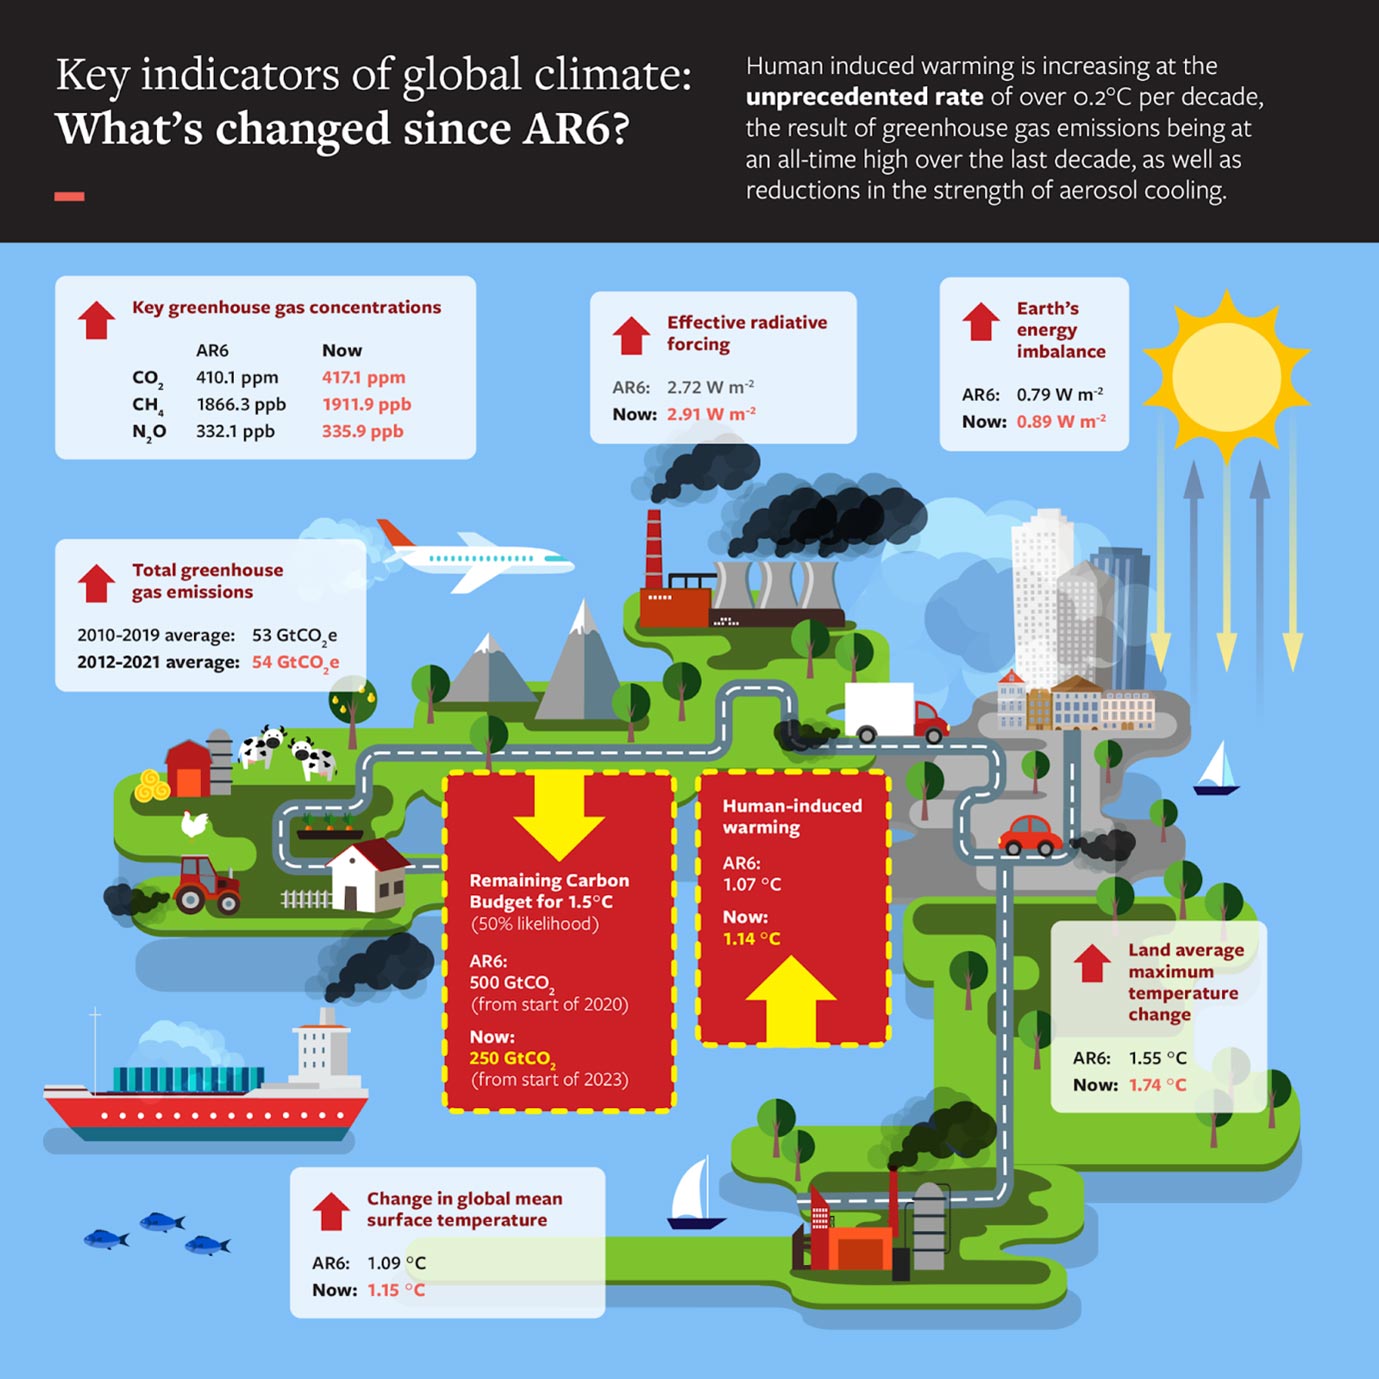
Human-induced warming, largely caused by the burning of fossil fuels, reached an average of 1.14°C for the most recent decade (2013 to 2022) above pre-industrial levels. This is up from 1.07°C between 2010 and 2019.
Human-induced warming is now increasing at a pace of over 0.2°C per decade.
The analysis also found that greenhouse gas emissions were “at an all-time high,” with human activity resulting in the equivalent of 54 (+/-5.3) gigatonnes (or billion metric tonnes) of carbon dioxide being released into the atmosphere on average every year over the last decade (2012-2021).
There has been a positive move away from burning coal, yet this has come at a short-term cost in that it has added to global warming by reducing particulate pollution in the air, which has a cooling effect.
‘Indicators Critical To Address Climate Crisis’
Professor Maisa Rojas Corradi, Minister of the Environment in Chile, IPCC author and a scientist involved in this study, said: “An annual update of key indicators of global change is critical in helping the international community and countries to keep the urgency of addressing the climate crisis at the top of the agenda and for evidence-based decision-making.
“In line with the “ratchet-mechanism” of increasing ambition envisioned by the Paris Agreement, we need scientific information about emissions, concentration, and temperature as often as possible to keep international climate negotiations up to date and to be able to adjust and if necessary correct national policies.
“In the case of Chile, we have a climate change law that aims at aligning government-wide policies with climate action.”
Remaining Carbon Budget
One of the major findings of the analysis is the rate of decline in what is known as the remaining carbon budget, an estimate of how much carbon that can be released into the atmosphere to give a 50% chance of keeping global temperature rise within 1.5°C.
In 2020, the IPCC calculated the remaining carbon budget was around 500 gigatonnes of carbon dioxide. By the start of 2023, the figure was roughly half that at around 250 gigatonnes of carbon dioxide.
The reduction in the estimated remaining carbon budget is due to a combination of continued emissions since 2020 and updated estimates of human-induced warming.
Professor Forster said: “Even though we are not yet at 1.5°C warming, the carbon budget will likely be exhausted in only a few years as we have a triple whammy of heating from very high CO2 emissions, heating from increases in other GHG emissions and heating from reductions in pollution.
“If we don’t want to see the 1.5°C goal disappearing in our rearview mirror, the world must work much harder and urgently at bringing emissions down.
“Our aim is for this project to help the key players urgently make that important work happen with up-to-date and timely data at their fingertips.”
Dr. Valérie Masson-Delmotte, from the Université Paris Saclay who co-chaired Working Group 1 of the IPCC’s Sixth Assessment report and was involved in the climate indicators project, said: “This robust update shows intensifying heating of our climate driven by human activities. It is a timely wake-up call for the 2023 global stocktake of the Paris Agreement – the pace and scale of climate action is not sufficient to limit the escalation of climate-related risks.”
As recent IPCC reports have conclusively shown, with every further increment of global warming, the frequency and intensity of climate extremes, including hot extremes, heavy rainfall, and agricultural droughts, increases.
The Indicators of Global Climate Change will have annually updated information on greenhouse gas emissions, human-induced global warming, and the remaining carbon budget.
The website extends a successful climate dashboard called the Climate Change Tracker which was created by software developers who took ideas from the finance industry on how to present complex information to the public.
What the Analysis Revealed
| Climate Indicator | Sixth Assessment Report (AR6) | Latest value |
| Greenhouse gas emissions (decadal average) | 53 GtCO2e (2010-2019) | 54 Gt CO2e (2012-2021) |
| Human-induced warming since preindustrial times | 1.07°C | 1.14°C |
| Remaining carbon budget (1.5C, 50% chance) | 500 GtCO2 | About 250 GtCO2 and very uncertain |
Headline results from the paper Indicators of Global Climate Change 2022: Annual update of large-scale indicators of the state of the climate system and the human influence. “AR6” refers to approximately 2019 and “Now” refers to 2022. The AR6 period decadal average greenhouse gas emissions are our re-evaluated assessment for 2010-2019.
Reference: “Indicators of Global Climate Change 2022: annual update of large-scale indicators of the state of the climate system and human influence” by Piers M. Forster, Christopher J. Smith, Tristram Walsh, William F. Lamb, Robin Lamboll, Mathias Hauser, Aurélien Ribes, Debbie Rosen, Nathan Gillett, Matthew D. Palmer, Joeri Rogelj, Karina von Schuckmann, Sonia I. Seneviratne, Blair Trewin, Xuebin Zhang, Myles Allen, Robbie Andrew, Arlene Birt, Alex Borger, Tim Boyer, Jiddu A. Broersma, Lijing Cheng, Frank Dentener, Pierre Friedlingstein, José M. Gutiérrez, Johannes Gütschow, Bradley Hall, Masayoshi Ishii, Stuart Jenkins, Xin Lan, June-Yi Lee, Colin Morice, Christopher Kadow, John Kennedy, Rachel Killick, Jan C. Minx, Vaishali Naik, Glen P. Peters, Anna Pirani, Julia Pongratz, Carl-Friedrich Schleussner, Sophie Szopa, Peter Thorne, Robert Rohde, Maisa Rojas Corradi, Dominik Schumacher, Russell Vose, Kirsten Zickfeld, Valérie Masson-Delmotte and Panmao Zhai, 8 June 2023, Earth System Science Data.
DOI: 10.5194/essd-15-2295-2023
Funding: EU Horizon 2020 Research and Innovation Programme, NERC/IIASA, ERC-2020-SyG “GENIE”
Never miss a breakthrough: Join the SciTechDaily newsletter.
Follow us on Google and Google News.
10 Comments
Well… congratulations, SKIPPY. You are only four decades late on the “insight”. You might also take a look at the Sun, next time you come out of your burrow.
The UN needs to convene and agree that we will grow hemp in every available space. Hemp absorbs more carbon than any other living thing on this planet. We can talk about trees, sure. But we don’t have enough TIME for trees. Plant hemp and don’t stop planting hemp until we have climate change under control. Maybe we can genetically modify hemp so that it can live on saltwater.
Anything trees can do, hemp can do better.
But don’t take my word for it, I’m just a guy on the Internet.
“Hemp absorbs more carbon than any other living THING on this planet.”
Compared to marine calcifiers? How does it compare to bamboo, which can grow 3 feet per day and is recognized as the fastest growing plant on Earth? It sounds to me like you have a hidden agenda.
I really don’t know why we try, to get the great money machine to consider slowing down to change, it’s out of our hands unless all humanity wasn’t stuck on power hungry over all. Only you and your actions of some simple self control can change the outcome.
“…, human-caused global warming has continued to increase at an ‘unprecedented rate’ since the last major assessment of the climate system published two years ago.”
First of all, one cannot logically compare modern instrumental measurements of temperature with estimates derived from proxies because the proxies have high uncertainties resulting from less than perfect correlation with temperature, and the rate of change is dependent on estimates of past time. The time estimates have uncertainties related to the local rate of deposition and particle size of the sediments that have buried the proxies. The farther back in time one goes, the greater the absolute uncertainty of the time, even with a constant percentage error. It is likely that the Paleocene-Eocene Thermal Maximum had a higher rate of warming than what we are currently experiencing, but we don’t really know with high accuracy or precision. Thus, it is disingenuous to make claims of “unprecedented” without specifying temporal boundaries for the claim.
Secondly, as shown by Monckton (2023), there has been no statistically-significant global warming for about 8 years.
https://wattsupwiththat.com/2023/06/03/the-new-pause-feels-the-influence-of-the-coming-el-nino/
Thirdly, it is meaningless to make claims about two-year changes when the year-to-year changes are much larger than the apparent long-term rate of change, and climate is defined as a long-term (such as 30 years) average. At the very least, one should only rely on moving averages with a window of several years.
When a claim cannot be defended logically, it should be obvious that the claimant is not being objective. Any conclusions they reach should be examined very carefully. There are many scary claims made, but most are unsupported by data or logic.
“Human-induced warming, largely caused by the burning of fossil fuels, reached an average of 1.14°C for the most recent decade (2013 to 2022) above pre-industrial levels. This is up from 1.07°C between 2010 and 2019.
Human-induced warming is now increasing at a pace of over 0.2°C per decade.”
Somebody needs to brush up on their arithmetic. The acceleration of warming for the last four years is 0.07°C per decade, not 0.2°C per decade — it isn’t even a round-up error, and the significance of the digits in the hundredths position is questionable.
The use of the terms “human caused” or “human induced” makes it appear that humans are solely responsible for the claimed 1.14°C average decadal increase. Estimates vary widely from less than half the increase to 110%. It seems to me that without some reasonable explanation of why natural variability should suddenly disappear during the Industrial Age, humans are only, at best, contributors and not the cause.
“But there is evidence that the rate of increase in greenhouse gas emissions has slowed.”
Indeed! During the COVID pandemic shutdowns in 2020, anthropogenic CO2 emissions decreased an average of about 10% for the year; individual months, such as April, saw decreases over 18%. Yet, the seasonal increase during the 2019 Winter and 2020 Spring, and the annual high in May, was indistinguishable from 2019 and 2021. Yet, 2020 was warmer than either 2019 or 2021. Rather than anthropogenic CO2 emissions being responsible for warming, there appears to be an inverse relationship for those three years. What’s wrong with this picture?
No treaty restrained the nation with the highest alltime emission rate in human history, China, who will surpass its predecessor in total emissions in under 3.5 decades, what the US emitted over 250 years.
Clyde Spencer’s comments are spot on. See Steven E.Koonin’s booke “Unsettled “ for more details. Unwarranted Climate Change claims are undermining the credibility of science.