Scientists’ annual checkup on Earth’s carbon cycle found that burning oil, coal, and natural gas is impeding progress to limit climate change.
Carbon dioxide emissions from fossil fuels rose again in 2023, reaching record levels, according to estimates from an international team of scientists. The continued rise in emissions from the burning of oil, coal, and natural gas is impeding progress to limit global warming, the scientists said.
Global Carbon Budget Assessment
The finding is part of an annual checkup on Earth’s carbon cycle called the Global Carbon Budget. In this annual assessment, scientists quantify how much carbon was added to the atmosphere from burning fossil fuels and land-use change, and how much carbon was removed from the atmosphere and stored on land and in the ocean.
Scientists’ early analysis of 2023 data shows that emissions from fossil fuels rose 1.1 percent in 2023 compared to 2022 levels, bringing total fossil emissions in 2023 to 36.8 billion metric tons of carbon dioxide. When including other sources—such as deforestation and the extreme wildfire season in Canada—total emissions in 2023 were estimated to be 40.9 billion metric tons. Both 2023 and 2022 saw record increases in carbon dioxide from fossil fuels, according to the analysis.
Climate Impact and Research Findings
“Emissions are heading the wrong direction that we need to limit global warming,” said Ben Poulter, a co-author of the report and scientist at NASA’s Goddard Space Flight Center. The concentration of carbon dioxide in the atmosphere has increased from approximately 278 parts per million in 1750, the beginning of the industrial era, to 420 parts per million in 2023.
The rise in heat-trapping carbon dioxide—and other greenhouse gases—is the primary reason for the planet’s soaring temperatures. The global surface temperature in 2023 was 1.2 degrees Celsius (2.1 degrees Fahrenheit) warmer than the average for NASA’s baseline period (1951-1980), making it the hottest year on record.
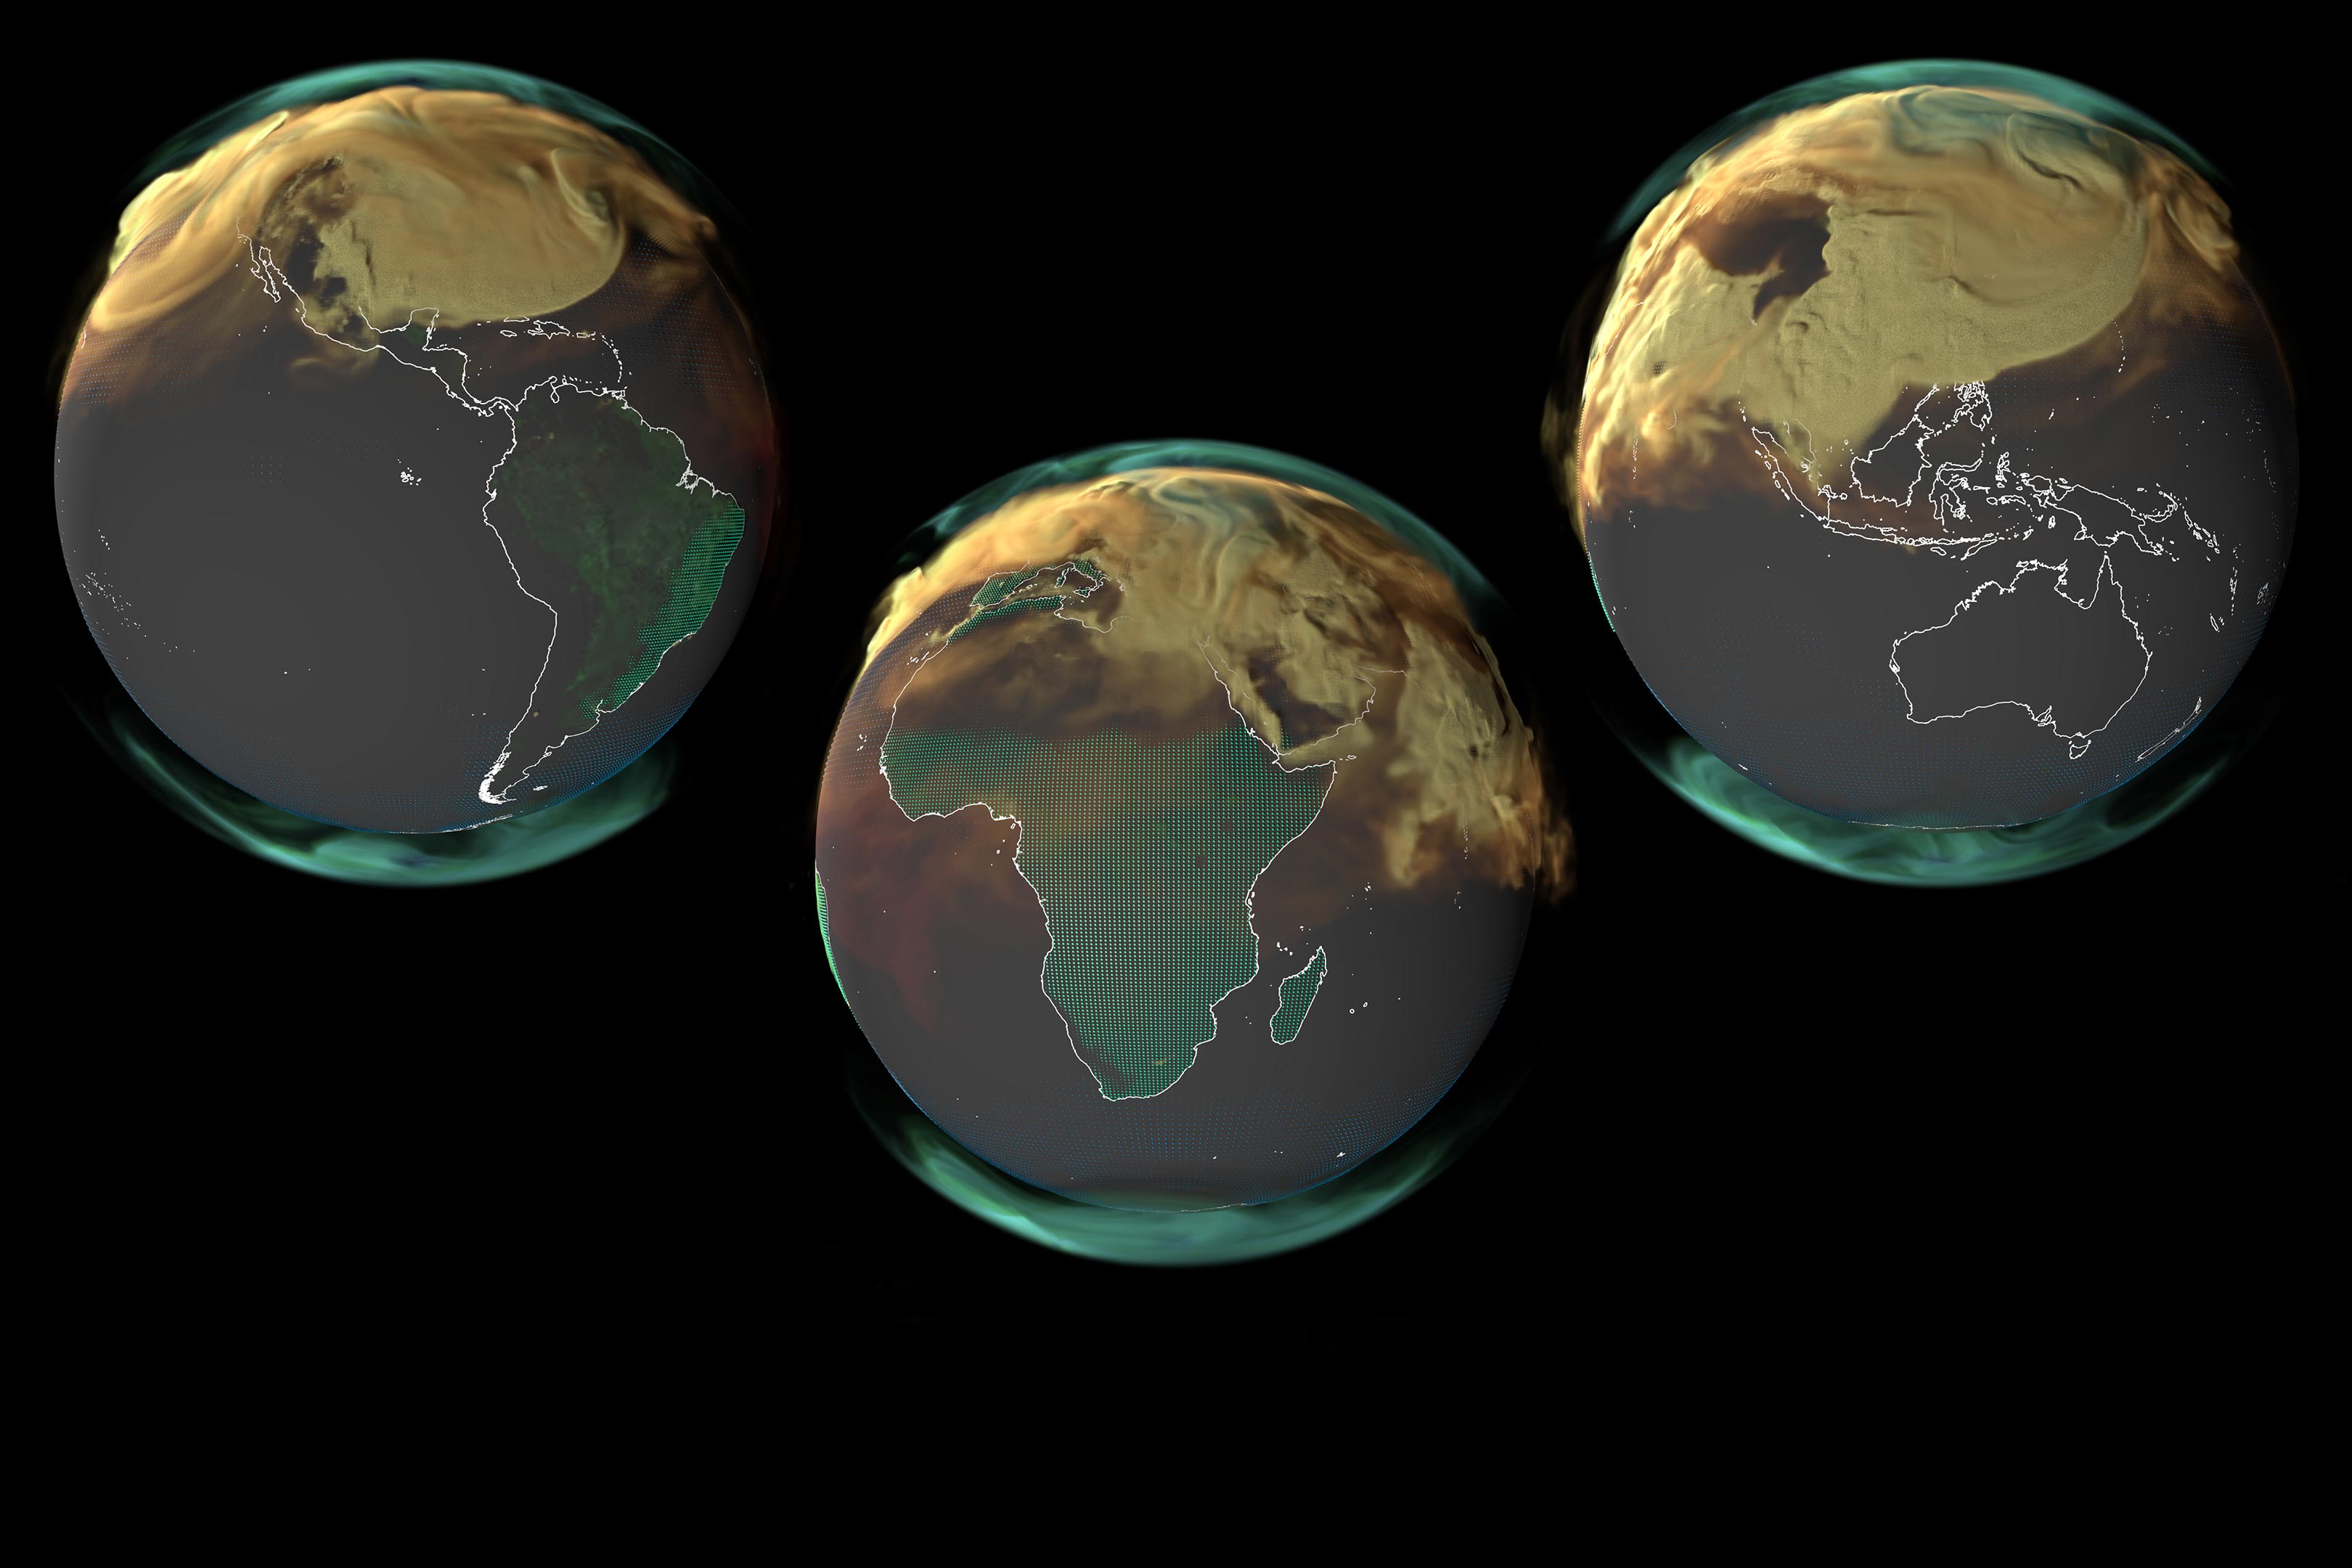
The visualizations above shows the flow of carbon dioxide into, around, and out of Earth’s atmosphere over the course of 2021 (the most recent full year of available data). They rely on NASA’s Goddard Earth Observing System (GEOS), a modeling and data assimilation system used for studying the Earth’s weather and climate. To depict where carbon is being emitted or taken up, researchers used data on vegetation, human population density, and the location of wildfires, power plants, roads, railways, and other infrastructure.
The carbon dioxide shown in the visualizations comes from four major sources: fossil fuels (yellow), burning biomass (red), land ecosystems (green), and the ocean (blue). Though the land and ocean are both carbon sinks—which means they store more carbon than they emit by removing carbon dioxide from the atmosphere—they can be sources at certain times and places. The green and blue dots represent carbon that was absorbed by the land and ocean.
Ocean and Land Absorption
“Amazingly, the ocean and land continue to absorb about half of the carbon we emit,” Poulter said. “Only about 44 percent of emissions stay in the atmosphere each year, slowing the rate of climate change, but causing ocean acidification and altering how land ecosystems function.”
The proportion of carbon dioxide that stays in the atmosphere, known as the airborne fraction, has remained remarkably stable over the past 60 years, even with the continued increase in human-caused emissions. But scientists question whether and for how long that stability will continue.
A NOAA-led study published in 2023 analyzed carbon storage in the ocean over two decades and found evidence that this carbon sink may be losing some of its storage capacity. They speculate that the ocean has slowed its absorption because it has already accumulated substantial amounts of carbon dioxide. And changes in global ocean circulation may be decreasing the amount of carbon that is transferred from surface waters to the ocean floor, where it can be stored for hundreds of years.
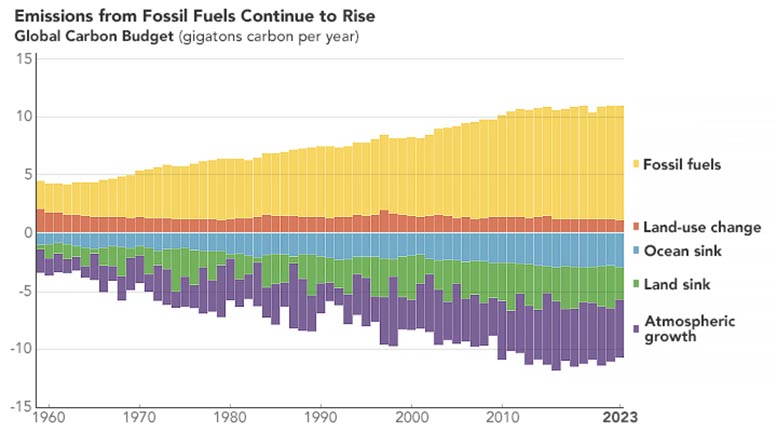
The chart above shows the combined components of the global carbon cycle from 1960 to 2023. It shows how much carbon is being emitted from fossil fuels (yellow) and land use change (orange), and how much is taken up by the atmosphere (purple), ocean (blue), or land (green).
Global Carbon Cycle and Emissions Trends
The Global Carbon Budget relied on several data sources to develop a complete picture of Earth’s carbon cycle. The primary sources were inventories of emissions collected by governments and energy agencies. Satellite data from NASA’s OCO-2 (Orbiting Carbon Observatory-2) instrument was also used to estimate the flux of carbon between the land and atmosphere.
According to the report, carbon dioxide emissions are falling a bit in some regions, including Europe and the United States, but still rising globally. The countries with the largest increase in emissions in 2023 were India and China.
In December 2015, delegates from 196 countries negotiated the Paris Agreement, which called for holding the global average temperature to “well below 2 degrees Celsius above pre-industrial levels,” while “pursuing efforts to limit the temperature increase to 1.5°C.” The Global Carbon Budget team also analyzed the remaining carbon budget before emissions could push the planet past 1.5 degrees. They estimate at the current emissions level, “there is a 50 percent chance global warming will exceed 1.5°C consistently in about seven years.”
NASA and other U.S. federal agencies regularly collect data on greenhouse gas concentrations and emissions, such as those in the visualizations above. These data are now available at the recently launched U.S. Greenhouse Gas Center, a multi-agency effort that consolidates information from observations and models, with a goal of providing decision-makers with one location for data and analysis.
NASA Earth Observatory chart by Michala Garrison, using data from Friedlingstein, Pierre, et al. (2023). Image and video by Andrew J. Christensen and Mark SubbaRao, courtesy of NASA’s Scientific Visualization Studio and adapted for NASA Earth Observatory, using data from NASA’s Global Modeling and Assimilation Office.
Never miss a breakthrough: Join the SciTechDaily newsletter.
Follow us on Google and Google News.
9 Comments
“Only about 44 percent of emissions stay in the atmosphere each year, slowing the rate of climate change, but causing ocean acidification …”
How much has the average ocean pH declined in the most recent year(s) for which measurements are available, compared to the temperature baseline period of 1951 through 1980? Assertions in science, without the supporting measurement numbers, are pseudo-science akin to the closing arguments of a trial lawyer where objections to statements are not allowed.
Clyde.. there is no one value for the pH of the oceans. It varies widely depending on location and depth. Nor, of course have the oceans ever been acid…pH below 7.0. Less alkaline might be better, but less scary.
I’m aware that there are also diurnal and seasonal changes in pH. However, it is commonly reported that the average surface pH in the open ocean has declined by 0.1 pH unit in the last century. We are better able to measure pH in recent years, particularly since the launch of the Argo drifting buoys. The historical measurements have been dismissed as being unreliable, and the present claim of the 0.1 pH decline is based on a computer model that claims the average pH a century ago to have been 8.2, which is alkaline. I was curious if anyone could recommend a paper that addressed the recent measured pH levels to see if the claim quoted above, about so-called acidification, is being verified.
“The concentration of carbon dioxide in the atmosphere has increased from approximately 278 parts per million in 1750, the beginning of the industrial era, to 420 parts per million in 2023.”
If the CO2 concentration in 1750 is only known approximately, why is it characterized with the same number of significant figures as the modern instrumental measurements?
Why does the areal distribution of carbon dioxide look so different in the original map released at the 2014 AGU meeting ( https://www.eike-klima-energie.eu/wp-content/uploads/2020/06/mainco2mappia18934-1536×864.jpg ) compared to more recent maps such as Figure 6 (SON) at https://www.tandfonline.com/doi/full/10.1080/20964471.2022.2033149 ? It appears to be an issue of more than just a compression of colors by smaller range. In any event, the limited range of colors suppresses the patterns of the CO2 distribution.
[I would have preferred to cite the full resolution 2014 map at Earth Magazine; however, I received a “403 Forbidden” notice when I attempted to view it, apparently because AGI suspended publication in 2019. Coincidentally, all the early OCO-2 maps have been removed from the NASA OCO-2 website. What that is all about, I don’t know. However, it would seem more appropriate to issue a corrigendum if errors were found, rather than just remove them without comment.]
It should not be a surprise that atmospheric CO2 reaches a new level every year simply because the Earth’s population does also. There is an almost perfect correlation between Mauna Loa CO2 and population si nce 1959. More importantly if we are to make the transition to renewables and EVs fossil fuels will continue to be required for all of the conventional transportation involved. Solar and wind farm projects don’t install themselves, nor do EVs. There are no substitutes for gasolines and biofuels in transportation. This means urgent reductions in CO2 emissions is counterproductive. We can’t have it both ways.
“There is an almost perfect correlation between Mauna Loa CO2 and population since 1959.”
However, it may be spurious. Consider that warming (and CO2) is generally good for plants and people. With more food, more children survive to reproductive age and produce more children. The COVID shutdowns in 2020 resulted in monthly declines in anthropogenic CO2, reaching as much as 14-18% in April, and an average of about 10% for the year. The monthly average CO2 concentrations clearly reveal the seasonal variations. The Fall-Spring ramp-up phase reaches a normalized peak in May, comparable to 2019 and 2021; indeed, 2020 is almost identical to the other two years. That is to say, a reduction in anthropogenic emissions produced no perceptible difference in the rate of increase or peak CO2, or annual temperatures. That is not what one would expect if CO2 is driving temperatures, or anthropogenic activities are driving CO2.
You might find the hard data in the following links to be of interest:
https://wattsupwiththat.com/2016/02/26/analysis-of-the-relationship-between-land-air-temperatures-and-atmospheric-carbon-dioxide-concentrations/
https://wattsupwiththat.com/2021/06/11/contribution-of-anthropogenic-co2-emissions-to-changes-in-atmospheric-concentrations/
https://wattsupwiththat.com/2022/03/22/anthropogenic-co2-and-the-expected-results-from-eliminating-it/
” The global surface temperature in 2023 was 1.2 degrees Celsius (2.1 degrees Fahrenheit) warmer than the average for NASA’s baseline period (1951-1980)”
NASA’s 1951-1980 baseline temperature was 59°F…15°C. i.2°C above that would be 16.2°C or 61.1°F.
Interesting that NOAA doesn’t agree. Their 20th century average is 14.0°C…57.0°F That’s one degree C. cooler than NASA. One of the two has to be wrong?
With more food, more children survive to reproductive age and produce more children.
Antibiotics? UN health-care programs? Greater use of vaccination? Better care for mothers? All post-1945 when the population growth began accelerating.