Capacity to monitor emissions to increase a hundredfold in the next three years.
Countries that signed up to the 2015 Paris Agreement have committed themselves to keep the rise in average global temperature ‘well below’ 2 °C. Every five years, they are to issue so-called ‘nationally determined contributions’ (NDCs), describing their actions to reduce greenhouse gas (GHG) emissions and adapt to climate change impacts.
Therefore, countries will need to track their carbon emissions, not only at a national level, but also at the scale of individual ‘super-emitters’ such as power plants, megacities, refineries, and giant factories. These ‘super-emitters’ are together responsible for nearly half of humanity’s total output of GHGs.
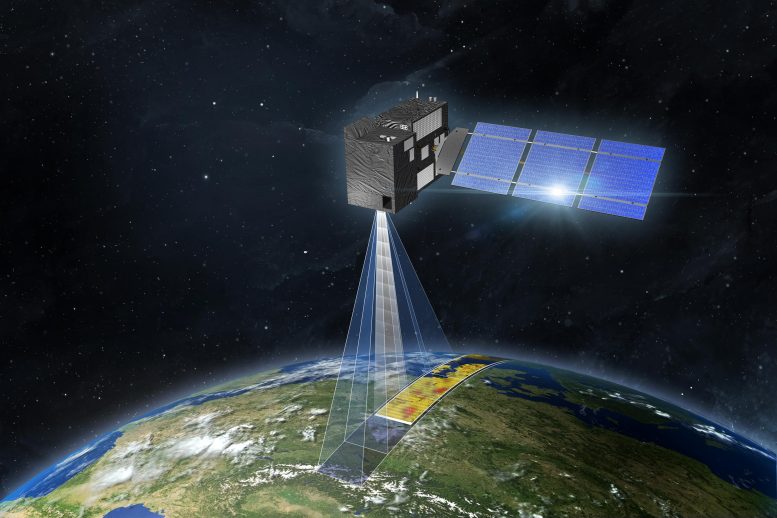
In late 2025 or 2026, the EU plans to launch its ‘CO2M’ (Copernicus Anthropogenic CO2 Monitoring Mission) pair of satellites, whose job will be to help with this.
Important Proof-of-Principle for CO2M
But now, scientists have shown that such tracking-at-the-source is already possible, even with existing satellites, for ‘super-emitters’ like the Belchatów power plant in Poland. For this proof-of-principle, they used five years of measurements from NASA’s satellite ‘Orbiting Carbon Observatory 2’ (OCO-2; launched in 2014) and the instrument OCO-3, attached since 2019 to the International Space Station (ISS).
This success is an important achievement, as the OCO missions were designed to measure carbon emissions at much larger spatial scales.
“Here we show for the first time that it’s already possible to measure changes in CO2 emissions from a large power plant, with observations from existing CO2-tracking satellites,” said Dr. Ray Nassar, an atmospheric scientist at Environment and Climate Change Canada, Toronto. He is the study’s first author, published in the journal Frontiers in Remote Sensing.
Largest Power Plant in Europe
The Belchatów lignite-fired (brown coal) power plant is the largest thermal power station in Europe and the fifth largest in the world. Here, units are sometimes decommissioned and new ones put in service, while more often, units shut down temporarily for maintenance. To be of use, satellites and instruments like OCO-2 and OCO-3 should immediately detect changes in CO2 emissions due to these changes in operation — and here, Nassar and colleagues show for the first time that they can.
CO2 is emitted by the 300-meter-high (1000-foot-high) stacks at Belchatów and carried by the wind in the form of an invisible plume, approximately 10-50 km (6-31 mile) long and 550 meters (1800 feet) above Earth. OCO-2, which orbits the Earth at an altitude of 705 km (438 miles), passes every 16 days close by or directly over Belchatów. OCO-3 orbits at an altitude of 420 km and passes over or near Belchatów more frequently. OCO-3 has the added capability to scan back and forth across a region, giving better local coverage or a wider view.
Not Every Flyby or Overpass Is Suitable
Satellites can assess the CO2 ‘enhancement’ — extra CO2 emitted by a source — only in the absence of clouds and when the plume doesn’t pass over large water bodies or mountains. They measure ‘XCO2’, the average CO2 concentration across a column directly below, subtracting the current background value (locally, on average 415 ppm) around the plume.
Together, OCO-2 and OCO-3 yielded 10 suitable datasets about the CO2 plume above Belchatów between 2017 and 2022.
Excellent Agreement Between Observed and Predicted Data
The researchers compared the measurements from space to estimates for Belchatów’s emissions, based on its known daily power generation output. The measurements turned out to closely track the daily predictions. This proves that even today, existing satellites can track emissions in close-to-real time for installations like Belchatów. For example, OCO-2 detected a pronounced but transient dip in emissions from Belchatów between June and September 2021, due to shutdowns for maintenance.
All Clear for CO2M
The results are promising: they indicate that CO2M, with a joint spatial coverage about a hundred times greater than OCO-2 and OCO-3, will be able to deliver on future needs.
“The capacity to get the most precise information about CO2 emissions from ‘super-emitters’, such as the Belchatów power plant, across the globe will boost transparency in carbon accounting and hopefully, it will ultimately help to reduce these emissions,” said Nassar.
“This future capacity will lead to improved CO2 emission information at the scale of countries, cities or individual facilities, enhancing transparency under the Paris Agreement and supporting efforts to reduce emissions causing climate change.”
Reference: “Tracking CO2 emission reductions from space: A case study at Europe’s largest fossil fuel power plant” by Ray Nassar, Omid Moeini, Jon-Paul Mastrogiacomo, Christopher W. O’Dell, Robert R. Nelson, Matthäus Kiel, Abhishek Chatterjee, Annmarie Eldering and David Crisp, 28 October 2022, Frontiers in Remote Sensing.
DOI: 10.3389/frsen.2022.1028240
Funding: Jet Propulsion Laboratory, NASA Headquarters
Never miss a breakthrough: Join the SciTechDaily newsletter.
Follow us on Google and Google News.
1 Comment
“To be of use, satellites and instruments like OCO-2 and OCO-3 should immediately detect changes in CO2 emissions due to these changes in operation,…”
This begs the question of just what is meant by, “to be of use.” During the pandemic shutdowns of 2020, estimates are that anthropogenic CO2 emissions declined an average of 10% for the year, with individual monthly declines of over 18% (April). Yet, there were no measurable declines in the rate of increase, the annual peak value, or the net annual increase of the atmospheric concentration. The shape of the 2020 seasonal concentrations (monthly data) is indistinguishable from that of 2019. The atmospheric CO2 concentration only seems to be correlated with El Niño events.
https://wattsupwiththat.com/2021/06/11/contribution-of-anthropogenic-co2-emissions-to-changes-in-atmospheric-concentrations/
Interestingly, the atmospheric concentrations of other anthropogenic gases show distinct declines. Therefore, I’m compelled to ask of what use these measurements will be when there doesn’t seem to be any predictive or even explanatory power to them.