A new, comprehensive analysis of satellite data finds more Greenland ice lost than previously estimated and that the majority of glaciers on the landmass have retreated significantly.
The Greenland Ice Sheet has shed about one-fifth more ice mass in the past four decades than previously estimated, researchers at NASA’s Jet Propulsion Laboratory in Southern California reported in a new paper. The majority of glaciers on the landmass have retreated significantly, and icebergs are falling into the ocean at an accelerating rate. This additional ice loss has had only an indirect impact on sea levels, but could hold implications for ocean circulation in the future.
Published in Nature on January 17, the analysis offers a comprehensive look at retreat around the edges of the entire ice sheet from 1985 to 2022, drawing from nearly a quarter million pieces of satellite data on glacier positions. Of the 207 glaciers in the study, 179 retreated significantly since 1985, 27 held steady, and one advanced slightly.
Most of the ice loss came from below sea level, in fjords on Greenland’s periphery. Once occupied by ancient glacial ice, many of these deep coastal valleys have filled with seawater – meaning the ice that broke off made little net contribution to sea level. But the loss likely accelerated the movement of ice flowing down from higher elevations, which in turn added to sea level rise.
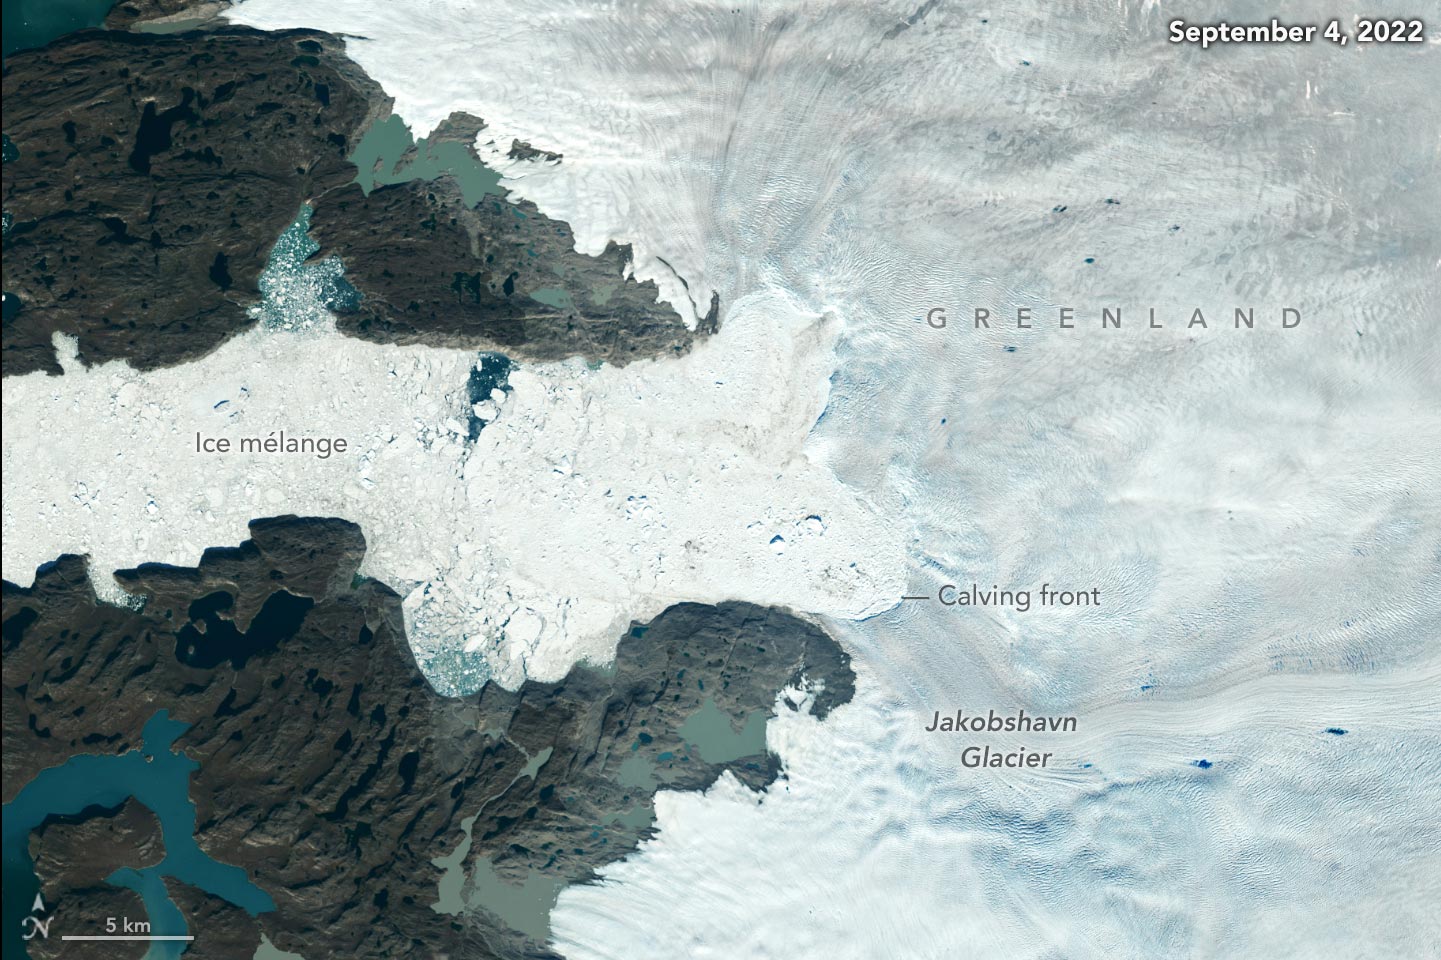
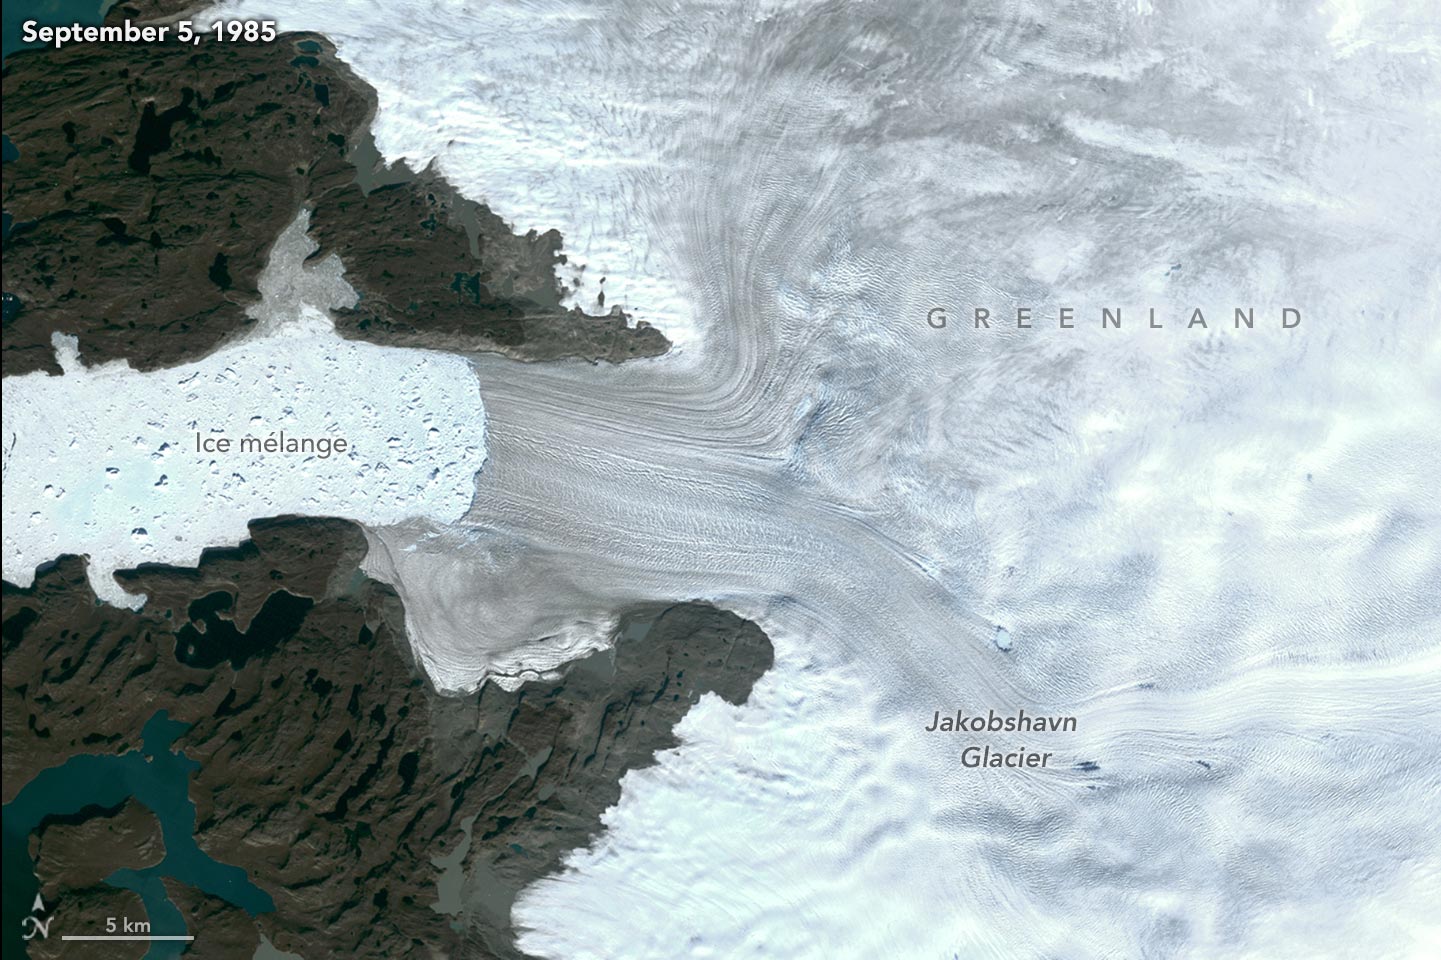
“When the ice at the end of a glacier calves and retreats, it’s like pulling the plug out of the fjord, which lets ice drain into the ocean faster,” said Chad Greene, a glacier scientist at JPL and the study’s lead author.
Accounting for Glacial Retreat
For decades researchers have studied the Greenland Ice Sheet’s direct contributions to global sea level rise through ice flow and melting. Scientists participating in the international Ice sheet Mass Balance Inter-comparison Exercise (IMBIE) estimated that the ice sheet had lost 5,390 billion tons (4,890 billion metric tons) between 1992 and 2020, adding about 0.531 inches (13.5 millimeters) to global mean sea level, according to the Intergovernmental Panel on Climate Change.
But the IMBIE measurements do not account for ice lost due to the retreat of terminal glaciers along the edges of Greenland. (These glacier edges were already in the water, whether submerged or floating.) The new study quantifies this amount: For the 1985 to 2022 period in the new paper, the ice sheet was estimated to have lost about 1,140 billion tons (1,034 billion metric tons) – 21% more mass lost than in the IMBIE assessment.
Although it doesn’t add to sea levels, the additional ice represents a significant influx of fresh water to the ocean. Recent studies have suggested that changes in the salinity of the North Atlantic Ocean from melting icebergs could weaken the Atlantic Meridional Overturning Circulation, part of the global “conveyor belt” of currents that transport heat and salt around the ocean. This could influence weather patterns worldwide, as well as affect ecosystems, the authors said.
The oceans play a significant role in absorbing greenhouse gases, like carbon dioxide, and heat from the atmosphere. This absorption can help mitigate the early effects of human-emissions of carbon dioxide. The Atlantic Meridional Overturning Circulation acts as a conveyor belt of ocean water from Florida to Greenland. Along the journey north, water near the surface absorbs greenhouse gases, which sink down as the water cools near Greenland. In this way, the ocean effectively buries the gases deep below the surface. Credit: NASA’s Goddard Space Flight Center
A Comprehensive View of Glacial Retreat
Icebergs have tumbled from Greenland’s glaciers for thousands of years as part of a natural cycle that typically balanced glacier growth in the winter with melting and retreat in the summer. The new study finds that ice retreat has far outpaced growth throughout the 21st century.
The researchers also found that Greenland’s ice extent remained relatively steady from 1985 to 2000, then started a marked recession that continues to this day.
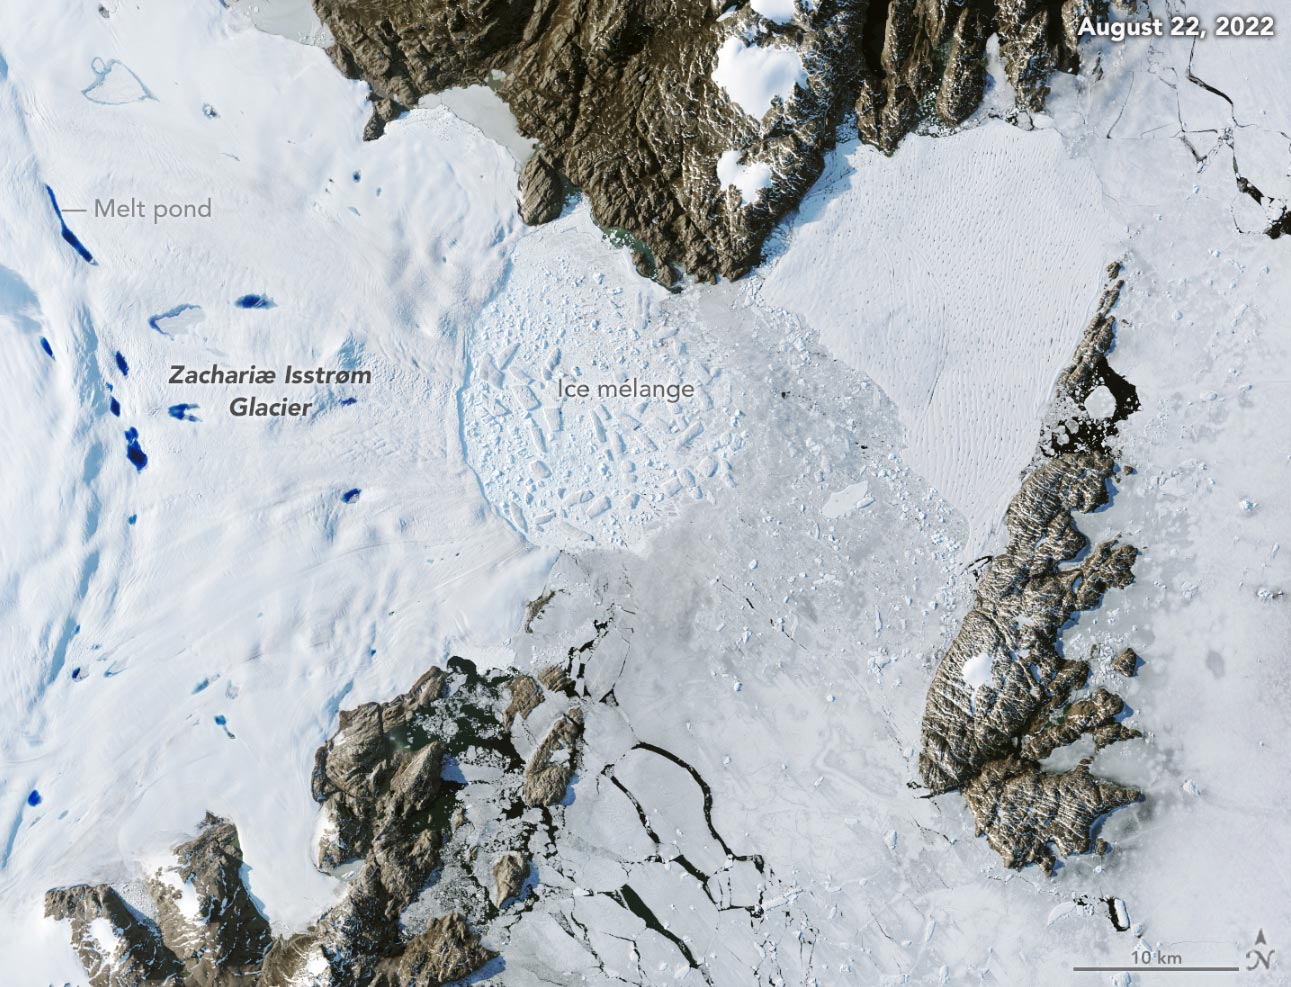
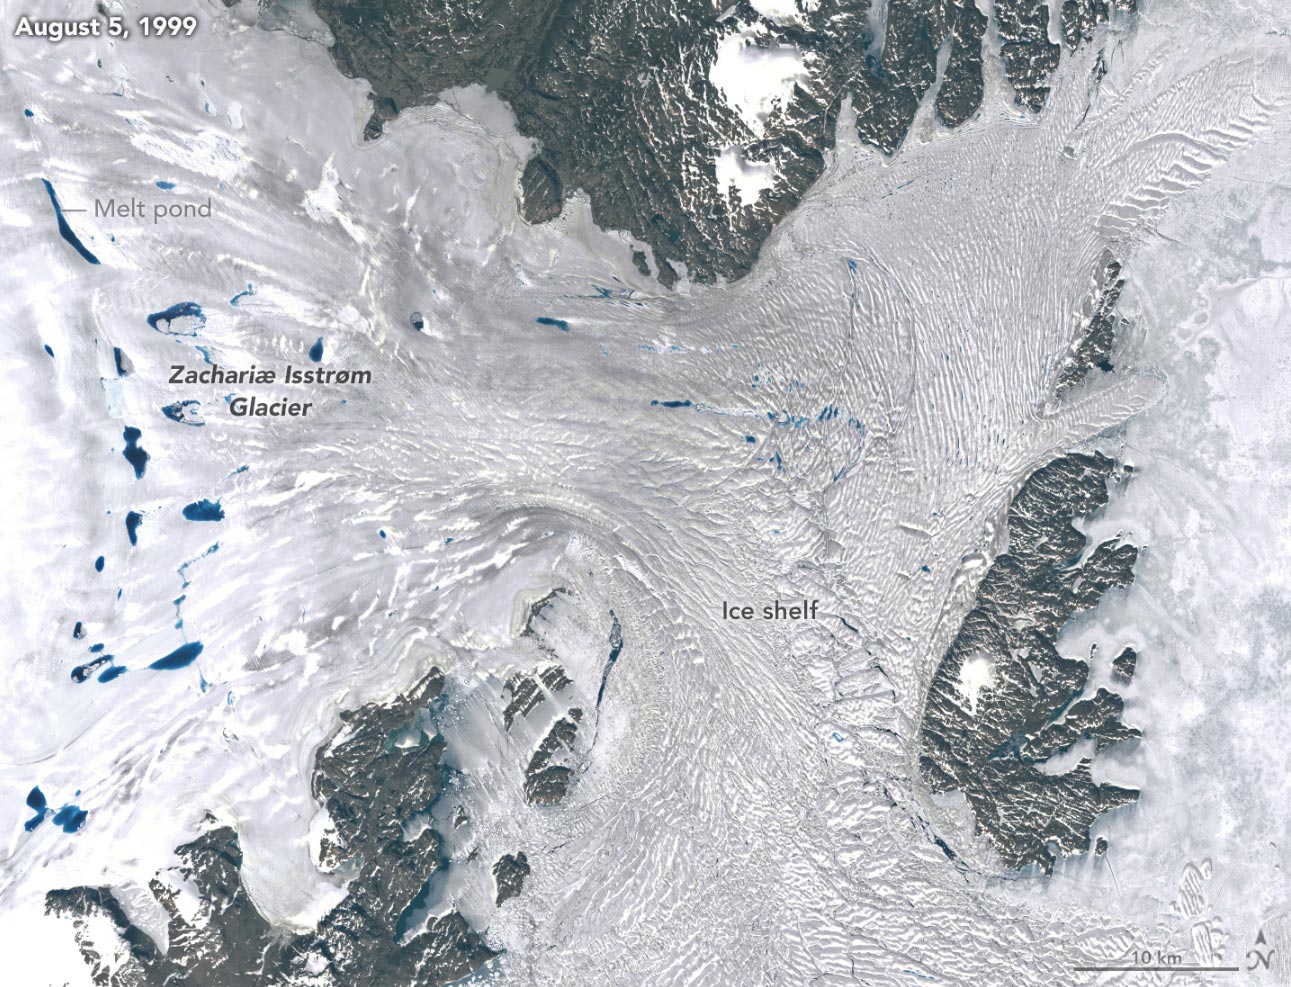
The data showed a glacier in northeast Greenland called Zachariae Isstrom lost the most ice, dropping 176 billion tons (160 billion metric tons) of mass due to retreat. It was followed by Jakobshavn Isbrae on the western coast, which lost an estimated 97 billion tons (88 billion metric tons), and Humboldt Gletscher in the northwest, which lost 96 billion tons (87 billion metric tons).
Only one glacier, Qajuuttap Sermia in southern Greenland, experienced any growth over the study period, but its gains were too small to offset the losses from other glaciers.
The researchers also found that glaciers with the largest seasonal fluctuations in the position of their ice front experienced the greatest overall retreat. The correlation suggests the glaciers that are most sensitive to warming each summer will be most impacted by climate change in the coming decades.
The discovery of a large-scale pattern of glacier retreat and its link to glacier sensitivity on seasonal time scales was the result of a big-data synthesis that looks at all parts of the ice sheet over time, said JPL cryosphere scientist Alex Gardner, a co-author of the paper. Scientists drew from five publicly available datasets that cumulatively tracked the month-to-month positions of 236,328 glacier edges as detected, either manually or by computer algorithms, in images collected by optical and radar satellites.
“Previously, we had bits and pieces – lots of local studies,” Gardner said. “But what this study offers is a systematic and comprehensive view that has led to some pretty significant insights that we didn’t have about the ice sheet before.”
Reference: “Ubiquitous acceleration in Greenland Ice Sheet calving from 1985 to 2022” by Chad A. Greene, Alex S. Gardner, Michael Wood and Joshua K. Cuzzone, 17 January 2024, Nature.
DOI: 10.1038/s41586-023-06863-2
Never miss a breakthrough: Join the SciTechDaily newsletter.
Follow us on Google and Google News.
4 Comments
“The Greenland Ice Sheet has shed about one-fifth [~20%] more ice mass in the past four decades than previously estimated, …”
From the abstract for this paper, “…, since 1985, the Greenland Ice Sheet (GrIS) has lost … 1,034 ± 120 Gt of ice lost to retreat.” That uncertainty of 120 Gt amounts to about ±12% of the nominal estimate of the loss. The stated “about one-fifth” implies the actual number has been rounded; the abstract says “by as much as 20%,” implying it may be greater. However, What is the point of providing nominal estimates, and an uncertainty to two significant figures, when the percentage impact is reduced to one significant figure without associated error bars? Perhaps this reduction in precision is a result of using different periods of time for the analysis compared to others, who considered Greenland as a whole.
From one of their references (Otosaka, et al., 2023), “In Greenland, the rate of mass loss is 169±9 Gt yr−1 between 1992 and 2020, but there are large inter-annual variations in mass balance, with mass loss ranging from 86 Gt yr−1 in 2017 to 444 Gt yr−1 in 2019 due to large variability in surface mass balance.
Basically, the numbers claimed by this new paper don’t seem to add up, and their use of significant figures and error bars is sloppy compared to their cited reference. I’m not about to chase down all the details. However, I’m not impressed by the quality of the work. But, then it is the NASA Jet Propulsion Laboratory that is doing glaciology. Perhaps they should stick to their original charter.
“This additional ice loss has had only an indirect impact on sea levels, but COULD hold implications for ocean circulation in the future.”
The facts to support this conjecture are not in evidence.
The real estate values of coastal properties like Obama’s ocean front mansions are better indicators of objective reality. Climate and disease are tools to create fear so politicians and their backers can gain power.
Call me when Manhattan goes under water.