Carbon dioxide has not been as high as today’s concentrations in 14 million years thanks to fossil fuel emissions now warming the planet.
Today atmospheric carbon dioxide is at its highest level in at least several million years thanks to widespread combustion of fossil fuels by humans over the past couple of centuries.
But where does 419 parts per million (ppm)—the current concentration of the greenhouse gas in the atmosphere—fit in Earth’s history?
That’s a question an international community of scientists, featuring key contributions by University of Utah geologists, is sorting out by examining a plethora of markers in the geologic record that offer clues about the contents of ancient atmospheres. Their initial study was published recently in the journal Science, reconstructing CO2 concentrations going back through the Cenozoic, the era that began with the demise dinosaurs and rise of mammals 66 million years ago.
Glaciers contain air bubbles, providing scientists direct evidence of CO2 levels going back 800,000 years, according to U geology professor Gabe Bowen, one of the study’s corresponding authors. But this record does not extend very deep into the geological past.
“Once you lose the ice cores, you lose direct evidence. You no longer have samples of atmospheric gas that you can analyze,” Bowen said. “So you have to rely on indirect evidence, what we call proxies. And those proxies are tough to work with because they are indirect.”
“Proxies” in the Geologic Record
These proxies include isotopes in minerals, the morphology of fossilized leaves and other lines of geological evidence that reflect atmospheric chemistry. One of the proxies stems from the foundational discoveries of U geologist Thure Cerling, himself a co-author on the new study, whose past research determined carbon isotopes in ancient soils are indicative of past CO2 levels.
But the strength of these proxies vary and most cover narrow slices of the past. The research team, called the Cenozoic CO2 Proxy Integration Project, or CenCO2PIP, and organized by Columbia University climate scientist Bärbel Hönisch, set out to evaluate, categorize and integrate available proxies to create a high-fidelity record of atmospheric CO2.
“This represents some of the most inclusive and statistically refined approaches to interpreting CO2 over the last 66 million years,” said co-author Dustin Harper, a U postdoctoral researcher in Bowen’s lab. “Some of the new takeaways are we’re able to combine multiple proxies from different archives of sediment, whether that’s in the ocean or on land, and that really hasn’t been done at this scale.”
The new research is a community effort involving some 90 scientists from 16 countries. Funded by dozens of grants from multiple agencies, the group hopes to eventually reconstruct the CO2 record back 540 million years to the dawn of complex life.
At the start of the Industrial Revolution—when humans began burning to coal, then oil and gas to fuel their economies—atmospheric CO2 was around 280 ppm. The heat-trapping gas is released into the air when these fossil fuels burn.
Looking forward, concentrations are expected to climb up to 600 to 1,000 ppm by the year 2100, depending on the rate of future emissions. It is not clear exactly how these future levels will influence the climate.
But having a reliable map of past CO2 levels could help scientists more accurately predict what future climates may look like, according to U biology professor William Anderegg, director the U’s Wilkes Center for Climate & Policy.
“This is an incredibly important synthesis and has implications for future climate change as well, particularly the key processes and components of the Earth system that we need to understand to project the speed and magnitude of climate change,” Anderegg said.
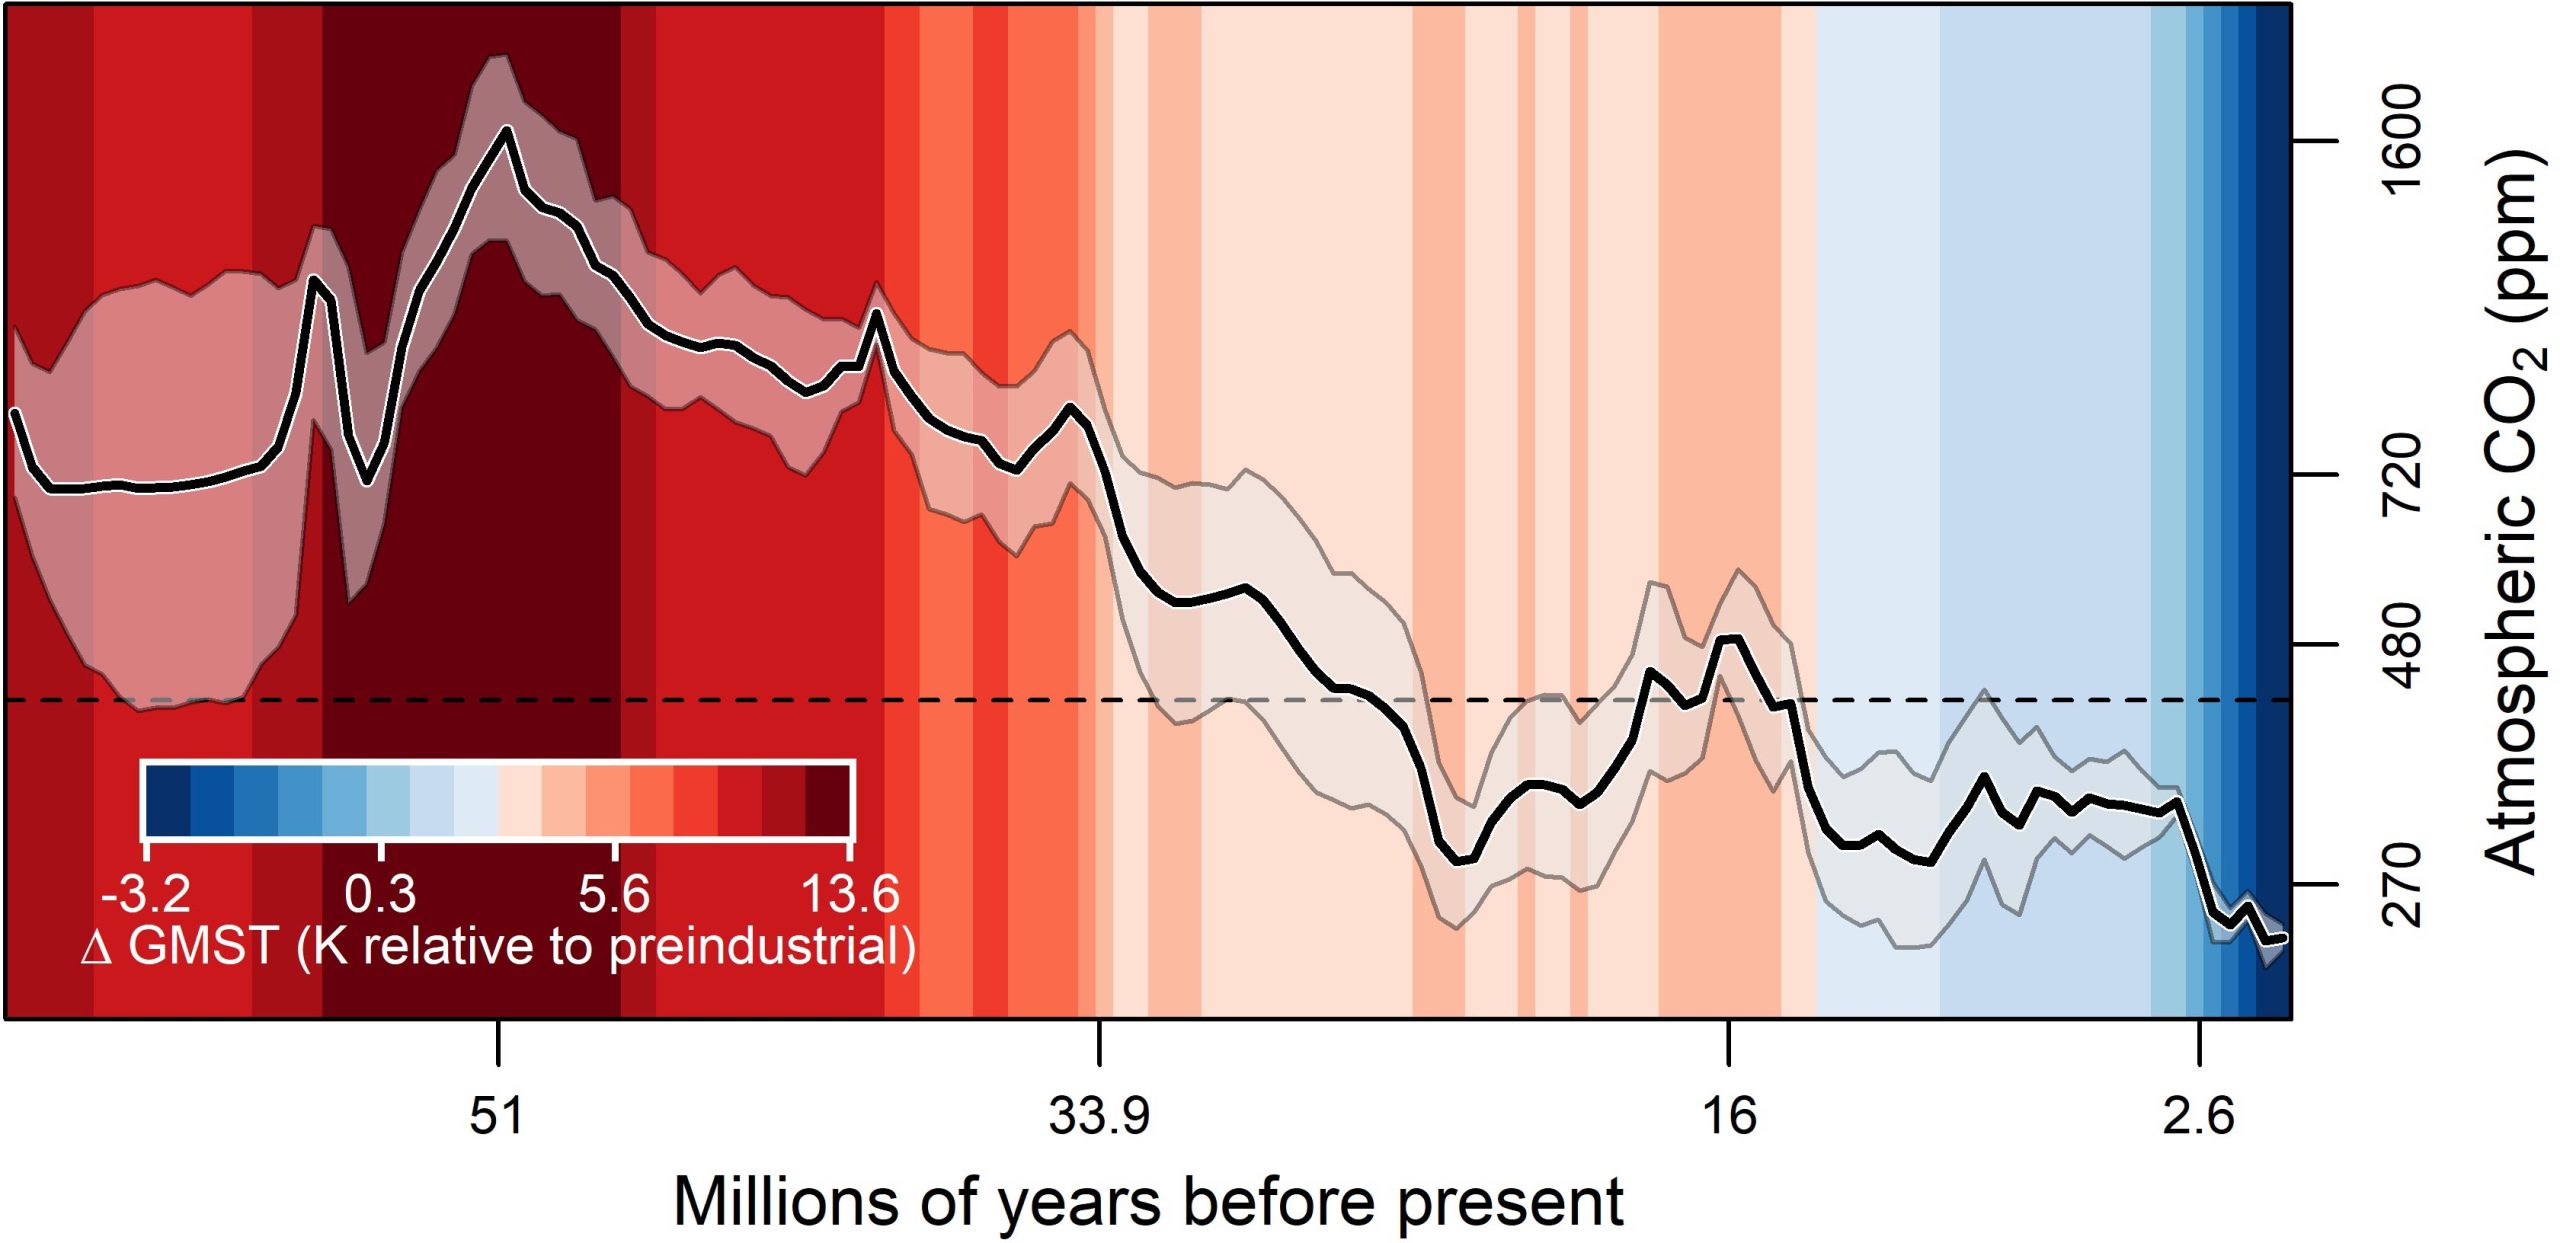
Today’s 419 ppm Is the Highest CO2 in 14 Million Years
At times in the past when Earth was a far warmer place, levels of CO2 were much higher than now. Still, the 419 ppm recorded today represents a steep and perhaps dangerous spike and is unprecedented in recent geologic history.
“By 8 million years before present, there’s maybe a 5% chance that CO2 levels were higher than today,” Bowen said, “but really we have to go back 14 million years before we see levels we think were like today.”
In other words, human activity has significantly altered the atmosphere within the span of a few generations. As a result, climate systems around the globe are showing alarming signs of disruption, such as powerful storms, prolonged drought, deadly heat waves, and ocean acidification.
A solid understanding of atmospheric CO2 variation through geological time is also essential to deciphering and learning from various features of Earth’s history. Changes in atmospheric CO2 and climate likely contributed to mass extinctions, as well as evolutionary innovations.
During the Cenozoic, for example, long-term declines in CO2 and associated climate cooling may have driven changes to plant physiology, species competition and dominance, which in turn impacted mammalian evolution.
“A more refined understanding of past trends in CO2 is therefore central to understanding how modern species and ecosystems arose and may fare in the future,” the study states.
Reference: “Toward a Cenozoic history of atmospheric CO2” by The Cenozoic CO2 Proxy Integration Project (CenCO2PIP) Consortium*†, Bärbel Hönisch, Dana L. Royer, Daniel O. Breecker, Pratigya J. Polissar, Gabriel J. Bowen, Michael J. Henehan, Ying Cui, Margret Steinthorsdottir, Jennifer C. McElwain, Matthew J. Kohn, Ann Pearson, Samuel R. Phelps, Kevin T. Uno, Andy Ridgwell, Eleni Anagnostou, Jacqueline Austermann, Marcus P. S. Badger, Richard S. Barclay, Peter K. Bijl, Thomas B. Chalk, Christopher R. Scotese, Elwyn de la Vega, Robert M. DeConto, Kelsey A. Dyez, Vicki Ferrini, Peter J. Franks, Claudia F. Giulivi, Marcus Gutjahr, Dustin T. Harper, Laura L. Haynes, Matthew Huber, Kathryn E. Snell, Benjamin A. Keisling, Wilfried Konrad, Tim K. Lowenstein, Alberto Malinverno, Maxence Guillermic, Luz María Mejía, Joseph N. Milligan, John J. Morton, Lee Nordt, Ross Whiteford, Anita Roth-Nebelsick, Jeremy K. C. Rugenstein, Morgan F. Schaller, Nathan D. Sheldon, Sindia Sosdian, Elise B. Wilkes, Caitlyn R. Witkowski, Yi Ge Zhang, Lloyd Anderson, David J. Beerling, Clara Bolton, Thure E. Cerling, Jennifer M. Cotton, Jiawei Da, Douglas D. Ekart, Gavin L. Foster, David R. Greenwood, Ethan G. Hyland, Elliot A. Jagniecki, John P. Jasper, Jennifer B. Kowalczyk, Lutz Kunzmann, Wolfram M. Kürschner, Charles E. Lawrence, Caroline H. Lear, Miguel A. Martínez-Botí, Daniel P. Maxbauer, Paolo Montagna, B. David A. Naafs, James W. B. Rae, Markus Raitzsch, Gregory J. Retallack, Simon J. Ring, Osamu Seki, Julio Sepúlveda, Ashish Sinha, Tekie F. Tesfamichael, Aradhna Tripati, Johan van der Burgh, Jimin Yu, James C. Zachos and Laiming Zhang, 8 December 2023, Science.
DOI: 10.1126/science.adi5177
Never miss a breakthrough: Join the SciTechDaily newsletter.
Follow us on Google and Google News.
12 Comments
“Some of the new takeaways are we’re able to combine multiple proxies from different archives of sediment, whether that’s in the ocean or on land, and that really hasn’t been done at this scale.”
One can expect that sediment from the deep oceans, below the mixing layer, is going to provide CO2 estimates higher than from the air above land.
“… and climate likely contributed to mass extinctions, as well as evolutionary innovations.”
There is no mention of how Plate Tectonics, particularly orogeny associated with subduction, and erosion leading to peneplanation, create and subsequently destroy climate zones that provide ecological niches for life to adapt to. With so many co-authors, surely there is room for a paleontologist or specialist in Earth history.
It’s remarkable that after all of that geological and geochemical history of increasing atmospheric CO2 and carbon burial, the total NET warming of the globe is still less than or close to only one degree C. above what it was pre-industrially.
Please think of a heavy flywheel. Initially you get it scarsly moving but when you get it moving, it will be almost impossible to stop. In the chart, that jump from low 270 to current 419 ppm level is so sharp it is almost impossible to notice, but since carbon emissions have continued for over hundreds of years, we start to see the effect. Our flywheel – Earth atmosphere – is speeding-up. Not remarkable, just plain Physics and Math behind what is happening now.
Sharp or not, the NET result is still less than or very close to only one degree C above what to was in 1880. Hardly evidence to support the idea that there is a crisis.
Not true. Actual warming is 2.0-2.2 deg C right now. This is measured from 1770, when humans first began to burn coal. The IPCC moved up the baseline from which global warming is measured from 1770 to 1920. This was to appease the politicians and the fossil fuel industry. Simply put, this was an act of deception to mislead the public. Truth is, humans are in deep trouble and we are lucky if a single human being remains on Earth by 2030. Do the deep research for yourself. It is far worse than what is being reported in the media. Soon they won’t be able to lie about actual climate change and its catastrophic implications anymore.
I have done the “deep research” and I’m not inclined to make assertions that cannot be supported, and would have no way of actually knowing, unlike you. 2030 is 6 years away. We went almost 9 years, from 2014 to 2023, with no statistically significant warming; previously, it was an even longer period. It appears that the lower tropospheric warming resulting from the current El Nino, peaked two months ago. Based on past behavior, we can expect that there will be a rapid drop in temperatures over a period of several months before the temperatures start their post-El Nino dance up and down with no statistically significant warming.
There is no reason to believe that things will be any different than the previous post-El Ninos. Therefore, it is highly improbable that human life will be extinguished from global warming in the next half-dozen years. You are giving too much credence to AOC and Greta and need to do your own research, which it appears you have not.
Not true? NOAA reports it every year. And as of 2021 the global average anomaly was plus 0.84°C. Where is your source?
Please read the NOAA definition. That very NOAA report says +0,84oC above the _20th century average_! From the pre industrial times we are 2 to 2,2oC like Robert correctly pointed out. In sub artic regions that temp rise is much higher, +4oC or more.
To what do you attribute the ~1.4 deg C increase (2.2-0.8) prior to the 20th Century when CO2 didn’t really start to increase noticeably until about the 1940s? Might it have been a rebound from the Little Ice Age? If so, then it is not appropriate to engage in hand-wringing about anthropogenic CO2 driving an unprecedented warming.
“The IPCC moved up the baseline from which global warming is measured from 1770 to 1920.”
From the IPCC report, “Impacts of 1.5°C Global Warming on Natural and Human Systems,” Chapter 3, 24 May 2022, they say, “The increase in global mean surface temperature (GMST), which reached 0.87°C in 2006–2015 relative to 1850–1900,…” It appears that little that you claimed about the IPCC can be verified. Do you have a source for your claims?
I’m waiting for you to provide a source to support your claim about “1920” and purposeful “deception.” Lacking that source would suggest that it is you who are engaging in purposeful “deception.”
Not near record high. CO2 has nothing to do with temperatures. We are near record low global temps.