Researchers work to map shallow waters with freely available data and cloud computing.
The shallow waters around islands and continental coastlines are important for human activities and for the health of many marine species. Yet these areas are constantly evolving and notoriously challenging and time-intensive to map. For several years, remote sensing scientists have worked to change that paradigm. A recent study led by NASA-funded researchers shows how it might be done with freely available satellite data and cloud computing.
For centuries, marine surveyors relied on shipborne tools—first sounding lines, then sonar—to decipher the depth and shape of the seafloor, or bathymetry. Starting with U.S. Landsat satellites in the 1970s and more recently with European Sentinel satellites, researchers have been slowly developing ways to derive bathymetric information from satellite images.
Different wavelengths of light penetrate water to differing depths, with shorter wavelengths (such as blue and green) penetrating farther than longer wavelengths (near infrared, shortwave infrared). When water is clear and the seafloor is bright, scientists can estimate depth by measuring the amount of reflectance observed by a satellite and then modeling how far the light should penetrate.
ICESat-2: Enhancing Bathymetric Mapping
Remote sensing scientists have added a new tool for shallow seafloor mapping: the Advanced Topographic Laser Altimeter System (ATLAS) on NASA’s Ice, Cloud, and land Elevation Satellite 2 (ICESat-2). ATLAS is a photon-counting lidar that sends pulses of laser light toward Earth’s ice, land, and water surfaces and derives height from the amount of time it takes for photons to bounce back. In 2019, scientists Lori Magruder of the University of Texas at Austin and Chris Parrish of Oregon State University combined ICESat-2 measurements with ship-based sonar data to demonstrate how they could fill in gaps and improve precision in maps of coastal shallows.
In 2021, Nathan Thomas and Lola Fatoyinbo of NASA’s Goddard Space Flight Center, along with colleagues from three countries, took another step by mating ICESat-2 measurements with images from Copernicus Sentinel-2 to derive bathymetry at better resolution. The team mapped the shallows down a depth of 26 meters (85 feet) around Biscayne Bay in Florida, the Gulf of Chania in Crete, and the island of Bermuda.
Enhanced Resolution and Accuracy Over Traditional Maps
Thomas and colleagues compared their satellite-derived bathymetry with maps made from traditional topographic surveys, multibeam sonar, and nautical soundings. Their new maps had a resolution of 10 meters, improving upon the current 115-meter resolution dataset for Crete and the 30- to 90-meter datasets for Florida and Bermuda. The existing data for Florida and Bermuda are composites of lots of sources spanning 63 years, while the ICESat-2/Sentinel-2 maps offer a contemporary assessment of underwater structure.
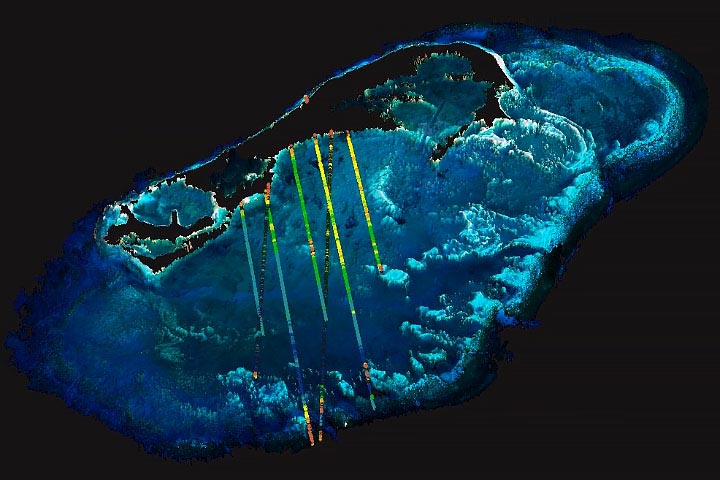
The image and animation on this page were built from the combined satellite data by study co-author David Lagomasino of East Carolina University. The visualization shows the shape of the seafloor around Bermuda based on observations made in 2020. The brighter the blue, the shallower the seafloor depth. The yellow, green, and orange stripes denote some of the overpasses by ICESat-2.
“Nearshore, shallow-water bathymetry is so important to both society and the natural environment, but openly available information on sub-aquatic structure is uncommon, particularly at high spatial resolutions,” said Thomas. “We were able to improve upon freely available datasets in both detail and imaging period with wall-to-wall maps of nearshore bathymetry at 10-meter resolution.”
A key part of the effort was the use of open-source data, cloud computing, and tools like Google Earth Engine. “As GEE is an open platform, it gives us a means through which we can share our approach,” Thomas noted. “Others can use our methods and code in a stable computing environment and repeat our work.”
For island nations and coastal states with limited funds and limited access to equipment, open-source, satellite-based bathymetric maps could be particularly useful. Reliable mapping is important for ship navigation, the development and protection of coastal infrastructure, the placement of aquaculture facilities, and monitoring of nearshore habitat. Even in more industrialized areas, satellite mapping could provide updated, cost-effective seafloor views in areas that change rapidly.
Animation and imagery by David Lagomasino/East Carolina University, using ICESat-2 and Sentinel-2 data from Thomas, N., et al. (2021).
Never miss a breakthrough: Join the SciTechDaily newsletter.
Follow us on Google and Google News.
1 Comment
The article speaks of resolution, presumably the horizontal width of individual pixels that make up the bathymetric map.
Strangely, what isn’t mentioned is the depth resolution and uncertainty range of the vertical measurements! There is no comparison offered between the different methods of measurement.