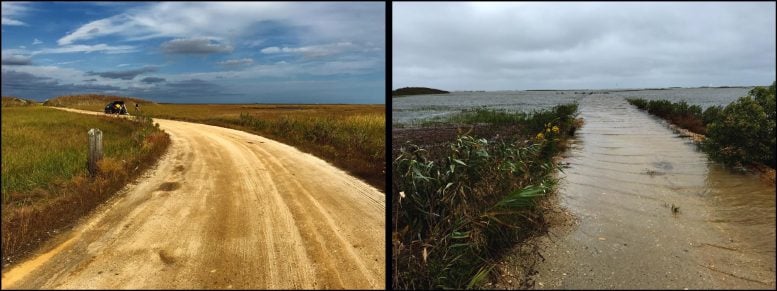
Sea-level rise leads to increased flooding at the Edwin B. Forsythe National Wildlife Refuge in New Jersey. The photos show approximately the same view in October (left) and September 2016. Both photos show the same round hill in the upper left corner. Credit: Jennifer S. Walker, Rutgers University
Global increase from melting ice and warming oceans is most significant change since 1800.
The rate of sea-level rise in the 20th century along much of the U.S. Atlantic coast was the fastest in 2,000 years, and southern New Jersey had the fastest rates, according to a Rutgers-led study.
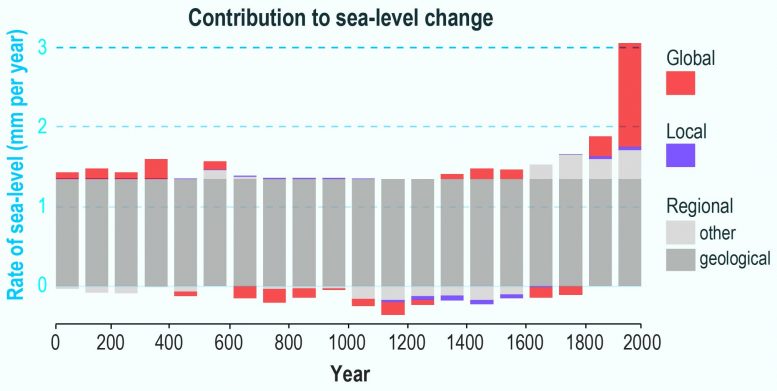
The global rise in sea-level from melting ice and warming oceans from 1900 to 2000 led to a rate that’s more than twice the average for the years 0 to 1800 – the most significant change, according to the study in the journal Nature Communications.
The study for the first time looked at the phenomena that contributed to sea-level change over 2,000 years at six sites along the coast (in Connecticut, New York City, New Jersey and North Carolina), using a sea-level budget. A budget enhances understanding of the processes driving sea-level change. The processes are global, regional (including geological, such as land subsidence) and local, such as groundwater withdrawal.
“Having a thorough understanding of sea-level change at sites over the long-term is imperative for regional and local planning and responding to future sea-level rise,” said lead author Jennifer S. Walker, a postdoctoral associate in the Department of Earth and Planetary Sciences in the School of Arts and Sciences at Rutgers University–New Brunswick. “By learning how different processes vary over time and contribute to sea-level change, we can more accurately estimate future contributions at specific sites.”

Sea-level budget for northern New Jersey over the last 2000 years. The contribution to sea-level change is divided into four components over time: global, local, and regional (geological and other). By the 20th century, the global contribution due to ice melt and warming oceans becomes equal to the regional geological contribution, for a total rate of sea-level rise of 3.1 mm per year, which is the fastest rate in the last 2000 years. Credit: Rutgers University/Earth Observatory of Singapore
Sea-level rise stemming from climate change threatens to permanently inundate low-lying islands, cities and lands. It also heightens their vulnerability to flooding and damage from coastal and other storms.
Most sea-level budget studies are global and limited to the 20th and 21st centuries. Rutgers-led researchers estimated sea-level budgets for longer timeframes over 2,000 years. The goal was to better understand how the processes driving sea-level have changed and could shape future change, and this sea-level budget method could be applied to other sites around the world.
Using a statistical model, scientists developed sea-level budgets for six sites, dividing sea-level records into global, regional and local components. They found that regional land subsidence – sinking of the land since the Laurentide ice sheet retreated thousands of years ago – dominates each site’s budget over the last 2,000 years. Other regional factors, such as ocean dynamics, and site-specific local processes, such as groundwater withdrawal that helps cause land to sink, contribute much less to each budget and vary over time and by location.
The total rate of sea-level rise for each of the six sites in the 20th century (ranging from 2.6 to 3.6 millimeters per year, or about 1 to 1.4 inches per decade) was the fastest in 2,000 years. Southern New Jersey had the fastest rates over the 2,000-year period: 1.6 millimeters a year (about 0.63 inches per decade) at Edwin Forsythe National Wildlife Refuge, Leeds Point, in Atlantic County and 1.5 millimeters a year (about 0.6 inches per decade) at Cape May Court House, Cape May County. Other sites included East River Marsh in Guilford, Connecticut; Pelham Bay, The Bronx, New York City; Cheesequake State Park in Old Bridge, New Jersey; and Roanoke Island in North Carolina.
Reference: “Common Era sea-level budgets along the U.S. Atlantic coast” by Jennifer S. Walker, Robert E. Kopp, Timothy A. Shaw, Niamh Cahill, Nicole S. Khan, Donald C. Barber, Erica L. Ashe, Matthew J. Brain, Jennifer L. Clear, D. Reide Corbett and Benjamin P. Horton, 23 March 2021, Nature Communications.
DOI: 10.1038/s41467-021-22079-2
Rutgers coauthors include Robert E. Kopp, a professor in the Department of Earth and Planetary Sciences in the School of Arts and Sciences at Rutgers University–New Brunswick and director of the Rutgers Institute of Earth, Ocean, and Atmospheric Sciences; and Erica L. Ashe, a post-doctoral scientist in the Department of Earth and Planetary Sciences. Scientists at Nanyang Technological University, Maynooth University, The University of Hong Kong, Bryn Mawr College, Durham University, Liverpool Hope University and East Carolina University contributed to the study.
Funding: David and Arleen McGlade Foundation, Cushman Foundation for Foraminiferal Research, U.S. National Science Foundation, Singapore Ministry of Education Academic Research Fund, National Research Foundation Singapore, Singapore Ministry of Education


The lead photo’s are (intentionally?) deceptive. The dry photo’ is a month later than the photo’ showing inundation. Obviously, some unusual event has cause a transient rise in the local sea level.
It is surprising to see a constant positive “geological” contribution to the claimed sea level rise because, for most of the cities mentioned, they are rebounding from depression by the overlying weight of ice during the last glaciation. Thus, the contribution would be negative. Some areas south of the leading-edge of the ice sheet actually bulged up during the last major glaciation, and are now subsiding — the opposite sense of isostatic rebound. Southern New Jersey may have been part of the forebulge. However, NY certainly was not! Modern coastal population growth has imposed demands on ground water supplies that have led to frequent subsidence as sediments collapse after water is withdrawn.
Assuming that the total rise in sea level is accurate, then it appears that the partitioning between isostatic rebound and subsidence has not been done properly.
However, the above assumption should not be accepted outright. It should be noted that the estimation of sea level rise derived entirely from tide gauges is smaller than the recent satellite estimates. Splicing time-series data from different technologies is fraught with problems. It should be obvious that the pre-satellite era data relied on tide gauges, or even worse, proxies. The tide gauge data have been spliced to modern satellite measurements, and adjusted with Argo buoy data to ‘correct’ for theoretical thermosteric volume increase. It is a classic example of comparing plums and apricots; hybridizing them leads to neither. Rather, one ends up with a pluot. Additionally, the resolution (or precision) of sea level height decreases the farther back in time one goes. Thus, it is not justified to make claims that current increases are unusual, or to imply that they won’t decrease as part of periodic changes over longer periods of time.
It seems that this article is conflating the natural effects of isostatic adjustment, exacerbated by human ground water withdrawal, with the different problem of melting glaciers and expansion of water as it warms. I’m not convinced that this “budget” approach is a significant contribution to our understanding of what is happening along the East Coast.