
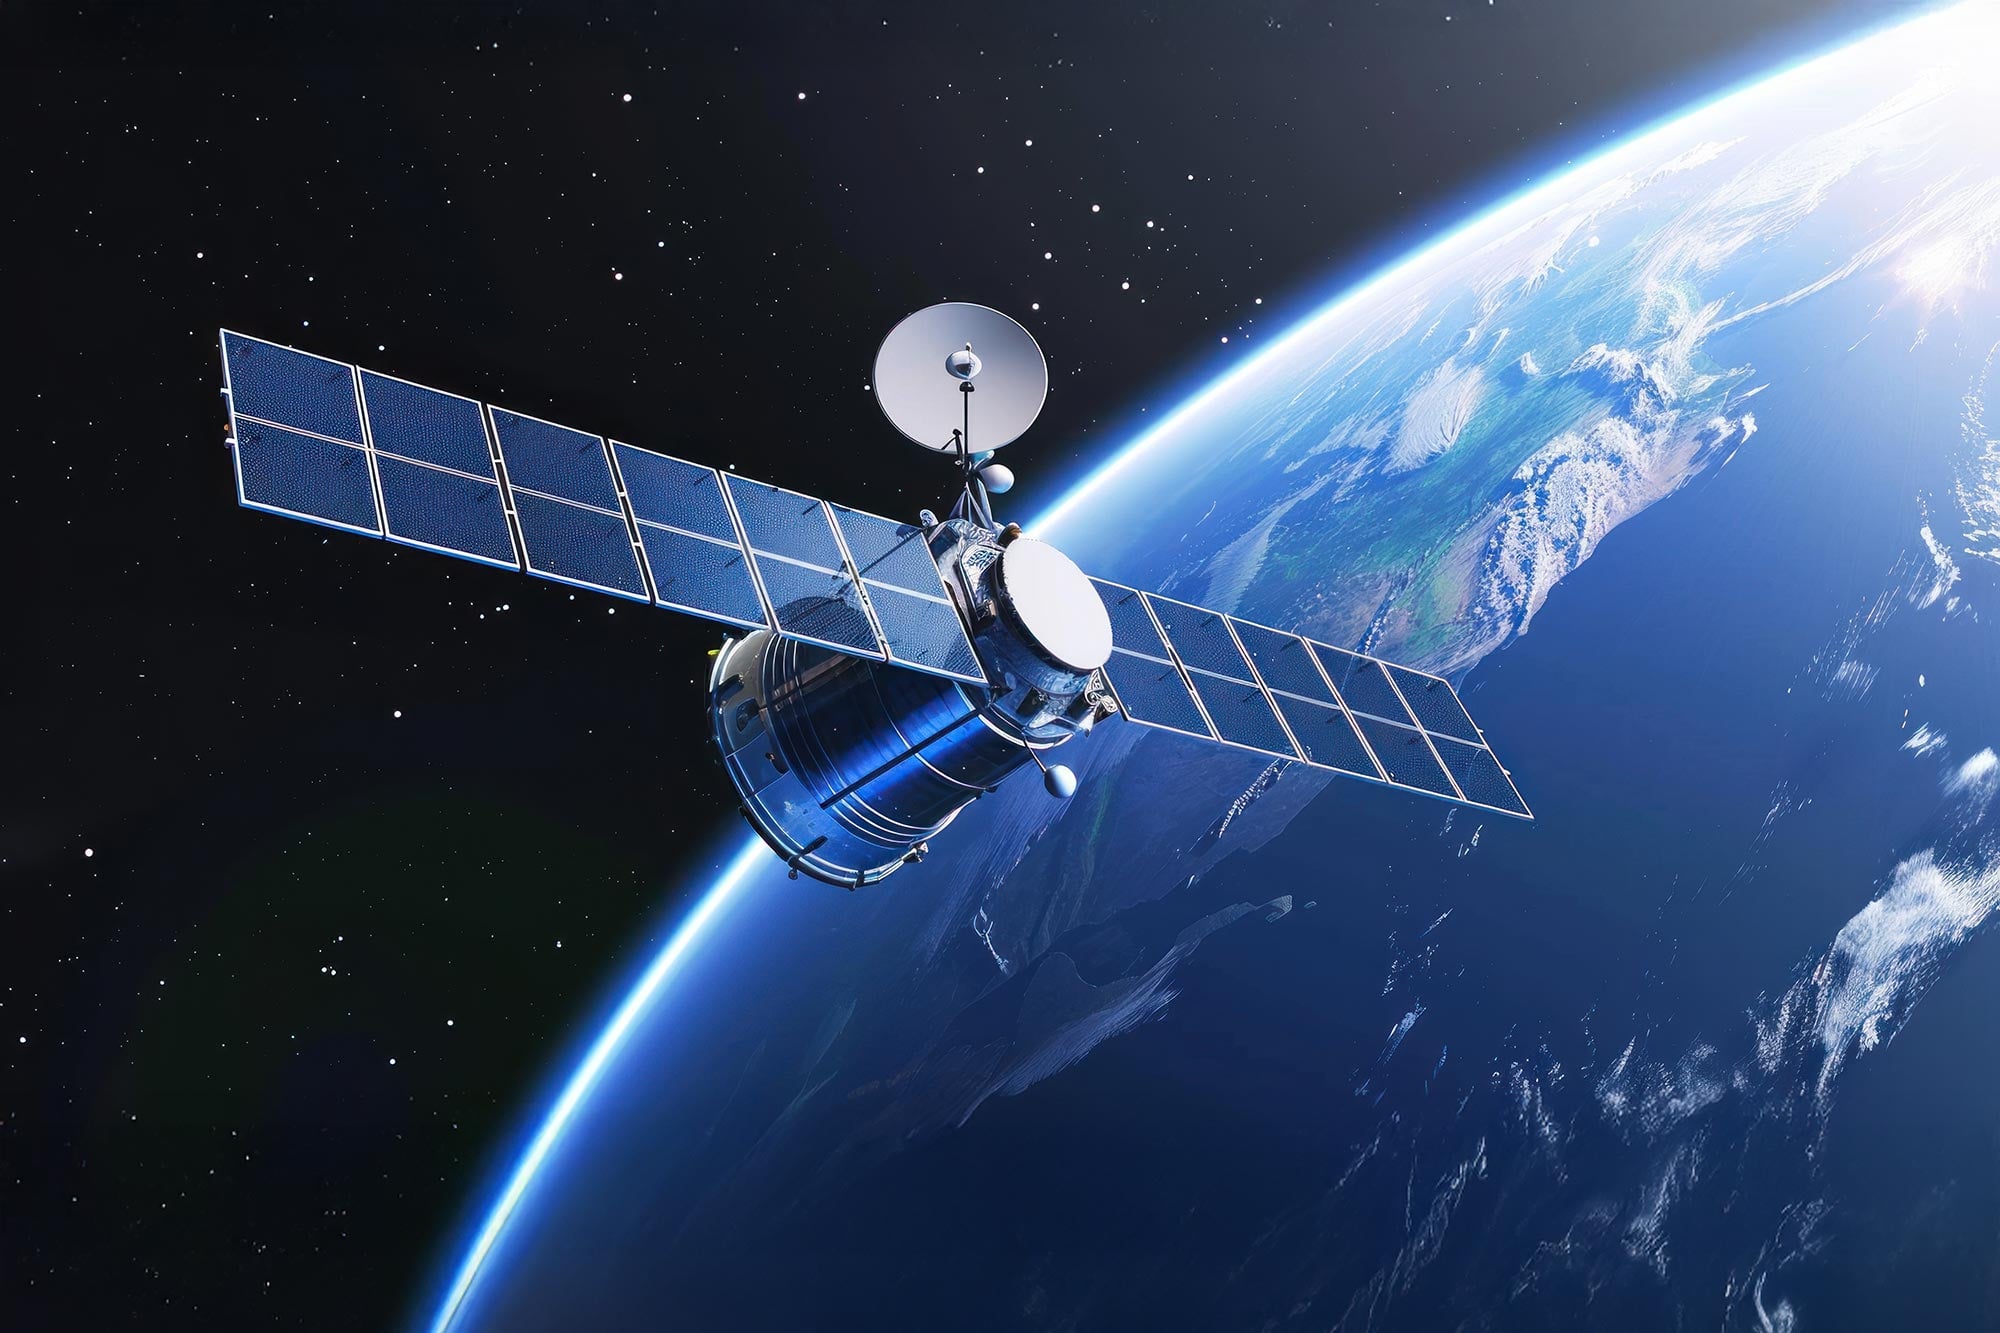
Satellites designed to provide internet service are now serving an unexpected second purpose: helping scientists map the nearly invisible atmosphere at the edge of space.
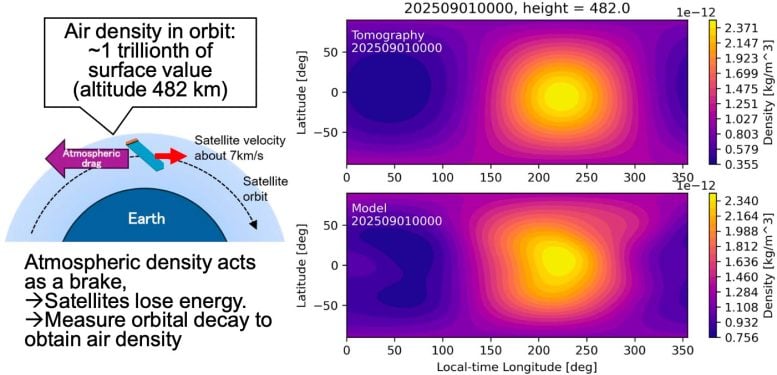
Researchers at Kyoto University have used orbital changes from about 1,200 Starlink satellites to map Earth’s thermosphere, a thin and difficult-to-observe region of the upper atmosphere. Their analysis produced the first tomographic map of its kind, revealing atmospheric density patterns roughly 482 kilometers (300 miles) above Earth. The study was published in Earth, Planets, and Space.
Although satellites in low Earth orbit travel through what appears to be empty space, traces of atmosphere remain even hundreds of kilometers above the surface. Collisions with these sparse particles create drag, slowly reducing a spacecraft’s speed and altitude.
That effect becomes more intense when solar activity heats and expands the upper atmosphere. Geomagnetic storms can rapidly increase atmospheric density at satellite altitudes, altering predicted orbits and raising the difficulty of collision avoidance.
Why Thermospheric Density Matters
Knowing how density varies across the thermosphere is therefore important for tracking satellites, forecasting reentries, planning maneuvers, and estimating the paths of space debris. Yet the region remains difficult to observe directly.
The thermosphere extends from about 100 to 1,000 kilometers (62 to 621 miles) above Earth. More than 99 percent of the upper atmosphere consists of electrically neutral gas in this region. By comparison, the electrically charged particles of the ionosphere account for less than 1 percent.
The ionosphere can be studied through its effects on radio signals. Neutral particles in the thermosphere leave a far weaker signature, so scientists often rely on specialized instruments, models, or measurements collected along individual satellite paths.
The Kyoto University team instead treated the Starlink constellation as a vast network of moving atmospheric sensors.
Turning Orbital Drag Into Atmospheric Data
As each satellite traveled through the thermosphere, drag caused it to lose a small amount of orbital energy. The researchers calculated these changes using publicly available, detailed orbital records known as ephemeris data. They then applied tomography, a mathematical method also used to reconstruct medical scans, to estimate how atmospheric density varied across different locations.
“This is a multidisciplinary study between space science and space engineering,” says corresponding author Mamoru Yamamoto. “Reading papers from both research fields, we realized that deeper dialogue between researchers from both fields is necessary.”
Combining measurements from hundreds of satellites allowed the researchers to produce a two-dimensional map of density across latitude and longitude. Most earlier spacecraft observations provided readings only along a satellite’s individual route, which is similar to learning about a landscape by following a single road.
Improving Space Weather and Orbital Safety
The new method offers a wider snapshot. Its results were highly consistent with density variations measured by the European Space Agency’s SWARM satellites, providing an independent check on the reconstruction.
The work expands on an earlier study by the same team that used publicly available Two-Line Element, or TLE, records to examine changes in thermospheric density over time and altitude. The latest research adds the horizontal dimension, revealing how density differs from one geographic region to another.
Future versions of the system could potentially track thermospheric density close to real time. Such maps could improve space weather forecasts, refine orbital predictions, and help operators respond more effectively when solar storms disturb the upper atmosphere.
Reference: “Tomography of thermospheric density from Starlink Ephemeris: initial report” by Mamoru Yamamoto, 30 July 2026, Earth, Planets and Space.
DOI: 10.1186/s40623-026-02509-5
This study was supported by the Japan Society for the Promotion of Science.
Never miss a breakthrough: Join the SciTechDaily newsletter.
Follow us on Google and Google News.