2023 set a new record for Earth’s highest average surface temperature, driven primarily by human activities. NASA and the U.S. are intensifying efforts to combat climate change through data accessibility and policy actions.
Earth’s average surface temperature in 2023 was the warmest on record, according to an analysis by NASA. Global temperatures last year were around 2.1 degrees Fahrenheit (1.2 degrees Celsius) above the average for NASA’s baseline period (1951-1980), scientists from NASA’s Goddard Institute for Space Studies (GISS) in New York reported.
NASA’s Response to the Climate Crisis
“NASA and NOAA’s global temperature report confirms what billions of people around the world experienced last year; we are facing a climate crisis,” said NASA Administrator Bill Nelson.
“From extreme heat, to wildfires, to rising sea levels, we can see our Earth is changing. There’s still more work to be done, but President Biden and communities across America are taking more action than ever to reduce climate risks and help communities become more resilient – and NASA will continue to use our vantage point of space to bring critical climate data back down to Earth that is understandable and accessible for all people. NASA and the Biden-Harris Administration are working to protect our home planet and its people, for this generation – and the next.”
2023: A Year of Extreme Heat
In 2023, hundreds of millions of people around the world experienced extreme heat, and each month from June through December set a global record for the respective month. July was the hottest month ever recorded. Overall, Earth was about 2.5 degrees Fahrenheit (or about 1.4 degrees Celsius) warmer in 2023 than the late 19th-century average, when modern record-keeping began.
2023 was Earth’s warmest year since modern record-keeping began around 1880, and the past 10 consecutive years have been the warmest 10 on record. How did NASA, a space agency, come to look at Earth’s temperature on the ground? And how do we measure global temperature? Credit: NASA/Kathleen Gaeta
“The exceptional warming that we’re experiencing is not something we’ve seen before in human history,” said Gavin Schmidt, director of GISS. “It’s driven primarily by our fossil fuel emissions, and we’re seeing the impacts in heat waves, intense rainfall, and coastal flooding.”
El Niño’s Influence and Volcanic Impacts
Though scientists have conclusive evidence that the planet’s long-term warming trend is driven by human activity, they still examine other phenomena that can affect yearly or multi-year changes in climate such as El Niño, aerosols and pollution, and volcanic eruptions.
Typically, the largest source of year-to-year variability is the El Niño – Southern Oscillation ocean climate pattern in the Pacific Ocean. The pattern has two phases – El Niño and La Niña – when sea surface temperatures along the equator switch between warmer, average, and cooler temperatures. From 2020-2022, the Pacific Ocean saw three consecutive La Niña events, which tend to cool global temperatures. In May 2023, the ocean transitioned from La Niña to El Niño, which often coincides with the hottest years on record.
However, the record temperatures in the second half of 2023 occurred before the peak of the current El Niño event. Scientists expect to see the biggest impacts of El Niño in February, March, and April.

Scientists have also investigated possible impacts from the January 2022 eruption of the Hunga Tonga-Hunga Ha’apai undersea volcano, which blasted water vapor and fine particles, or aerosols, into the stratosphere. A recent study found that the volcanic aerosols – by reflecting sunlight away from Earth’s surface – led to an overall slight cooling of less than 0.2 degrees Fahrenheit (or about 0.1 degrees Celsius) in the Southern Hemisphere following the eruption.
Continued Concern Over Rising Greenhouse Gases
“Even with occasional cooling factors like volcanoes or aerosols, we will continue to break records as long as greenhouse gas emissions keep going up,” Schmidt said. “And, unfortunately, we just set a new record for greenhouse gas emissions again this past year.”
“The record-setting year of 2023 underscores the significance of urgent and continued actions to address climate change,” said NASA Deputy Administrator Pam Melroy. “Recent legislation has delivered the U.S. government’s largest-ever climate investment, including billions to strengthen America’s resilience to the increasing impacts of the climate crisis. As an agency focused on studying our changing climate, NASA’s fleet of Earth observing satellites will continue to provide critical data of our home planet at scale to help all people make informed decisions.”
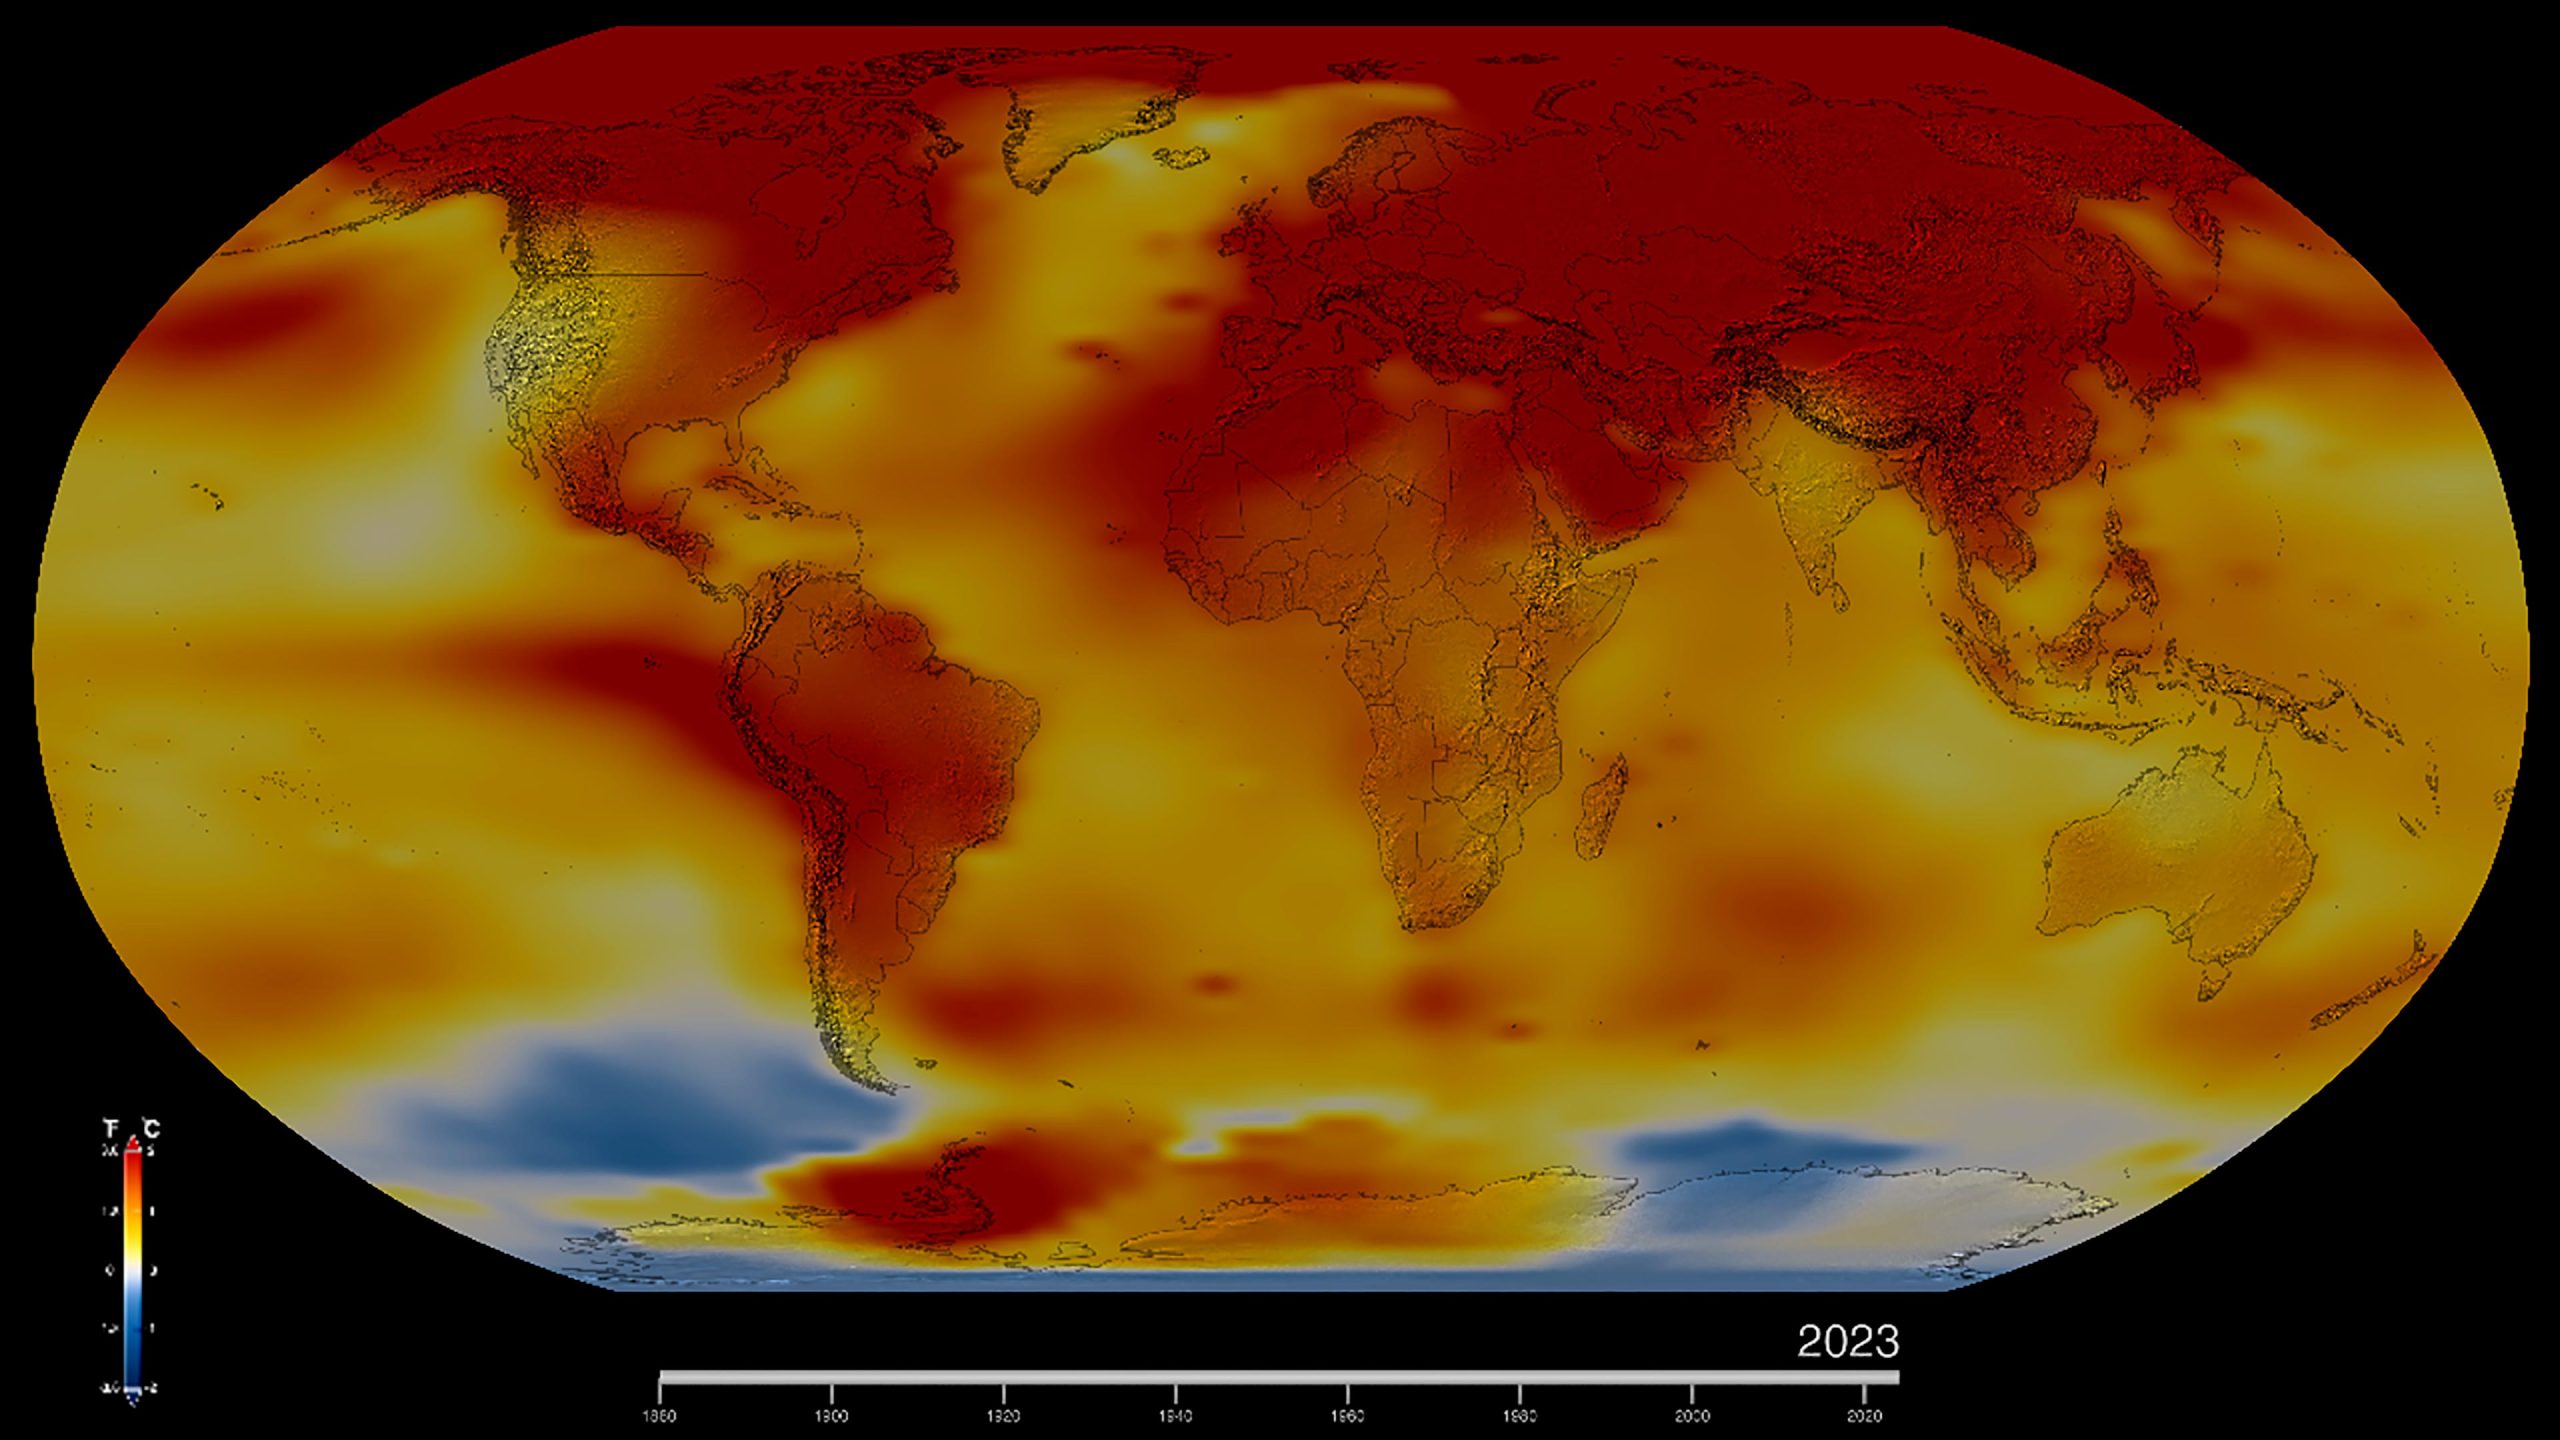
This color-coded map in Robinson projection displays a progression of changing global surface temperature anomalies. Normal temperatures are shown in white. Higher than normal temperatures are shown in red and lower-than-normal temperatures are shown in blue. Normal temperatures are calculated over the 30 year baseline period 1951-1980. The maps are averages over a running 24-month window. The final frame represents global temperature anomalies in 2023. Credit: NASA’s Scientific Visualization Studio
NASA’s Open Science Approach
NASA assembles its temperature record using surface air temperature data collected from tens of thousands of meteorological stations, as well as sea surface temperature data acquired by ship- and buoy-based instruments. This data is analyzed using methods that account for the varied spacing of temperature stations around the globe and for urban heating effects that could skew the calculations.
Independent analyses by NOAA and the Hadley Centre (part of the United Kingdom Met Office) concluded the global surface temperatures for 2023 were the highest since modern record-keeping began. These scientists use much of the same temperature data in their analyses but use different methodologies. Although rankings can differ slightly between the records, they are in broad agreement and show the same ongoing long-term warming in recent decades.
U.S. Efforts in Climate Data Accessibility
Building on a half-century of research, observations, and models, the Biden-Harris Administration including NASA and several federal partners recently launched the U.S. Greenhouse Gas Center to make critical climate data readily available to decision-makers and citizens. The center supports collaboration across U.S. government agencies and the non-profit and private sectors to make air-, ground-, and space-borne data and resources available online.
NASA’s full dataset of global surface temperatures through 2023, as well as details with code of how NASA scientists conducted the analysis, are publicly available from GISS. GISS is a NASA laboratory managed by the Earth Sciences Division of the agency’s Goddard Space Flight Center in Greenbelt, Maryland. The laboratory is affiliated with Columbia University’s Earth Institute and School of Engineering and Applied Science in New York.
Never miss a breakthrough: Join the SciTechDaily newsletter.
Follow us on Google and Google News.
5 Comments
The lede graphic, showing temperature anomalies, is a poor choice for non-specialists. It probably leaves readers with the false impression that Western Antarctica is as warm as Arabia.
Also, using the full gamut of spectral colors to show a very small range of anomalies makes the situation worse than what it actually is. If the colors had a range that was the same as the range of possible surface temperatures, the anomalies would look VERY different.
“…, we can see our Earth is changing. …, but President Biden and communities across America are taking more action than ever to reduce climate risks and help communities become more resilient – and NASA will continue to use our vantage point of space to bring critical climate data back down to Earth that is understandable and accessible for all people. NASA and the Biden-Harris Administration are working to protect our home planet and its people, for this generation – and the next.”
Here’s a man, Bill Nelson, who knows what side of his toast needs to be buttered. However, “change” is what Earth does. And that’s why paleontologists and historical geologists study the past — so that we have something to compare the present to and can make informed decisions about societal policies and not confuse all change with changes that are truly existential threats.
US Geological Survey geologist Charles Lyell famously said, “The present is the key to the past.” This concept of Uniformitarianism was subsequently championed by James Hutton. In the same sense, the past and present are the key to the future.
NASA and the USGS, however, have succumbed to mission creep and politicization. Therefore, their motives and claims have become suspect. Politicization of science leads to making our vision of the future murkier rather than clearer.
“The record-setting year of 2023 underscores the significance of urgent and continued actions to address climate change,” said NASA Deputy Administrator Pam Melroy. “Recent legislation has delivered the U.S. government’s largest-ever climate investment, including billions to strengthen America’s resilience to the increasing impacts of the climate crisis. As an AGENCY FOCUSED ON STUDYING OUR CHANGING CLIMATE, NASA’s fleet of Earth observing satellites will continue to provide critical data of our home planet at scale to help all people make informed decisions.”
This illustrates my claim about “mission creep” for NASA. Its original charter was quite different:
(c) The aeronautical and space activities of the United States shall be conducted so as to contribute materially to one or more of the following objectives:
(1) The expansion of human knowledge of phenomena in the atmosphere and space;
(2) The improvement of the usefulness, performance, speed, safety, and efficiency of aeronautical and space vehicles;
(3) The development and operation of vehicles capable of carrying instruments, equipment, supplies and living organisms through space;
(4) The establishment of long-range studies of the potential benefits to be gained from, the opportunities for, and the problems involved in the utilization of aeronautical and space activities for peaceful and scientific purposes.
The above is from the original (unamended) National Aeronautics and Space Act of 1958. Monitoring climate is probably a better fit under the purview of NOAA and/or the USGS. In looking for the original Space Act, I came across some websites authored by the NASA. They mention the Landsat series of satellites and take full credit for something that was championed by the director of the USGS. The USGS provided functional specifications, and from the original launch of the Earth Resources Technology Satellite (Landsat 1) in 1972, to the present Landsat 9, has provided the archiving and processing of all Landsat imagery; they also developed computer algorithms to extract information from the multispectral sensors. NASA doesn’t even demonstrate the professional courtesy to give credit where credit is due. That speaks to its politicization.
The mission creep and focus on climate helps explain why NASA is having difficulty adhering to the budget and time table of returning to the moon, after an absence of 50 years.
“NASA Analysis Confirms 2023 as Warmest Year on Record”
And those records go back about 150 years on a 4.5 billion year old planet. Statistically insignificant. It doesn’t even warrant a blip on the geological time scale radar.
Well, civilization, as we know it, has only been around for 12,000 years or so. That is also only a blip on a 4.5 billion year time-scale. Personally, I would prefer to maintain our planet so that we, all the flora, and all the fauna could continue to live here. So far, we’ve done a lousy job. We even left so much space junk around the planet that it takes a lot of extra effort to navigate around it.