The increase in tritium concentration caused by Fukushima discharge over a decade.
Macroscopic and microscopic simulations of Fukushima nuclear accident contaminated water discharge.
On August 26, 2021, the Japanese Cabinet passed a bill to discharge treated Fukushima nuclear accident contaminated water into the Pacific Ocean to alleviate the problem of nuclear wastewater storage. However, large amounts of radionuclides can affect marine biological chains when inhaled by marine life and adversely influence marine fisheries and human health. The global effects of Fukushima discharge, which will last 30-40 years, remain unknown. Thus, identifying the diffusion process of radioactive water in oceans is critical.
To solve this problem, a team from Tsinghua University, China, developed analysis models from both macroscopic and microscopic perspectives, to simulate the diffusing process of the nuclear elements. The former one focuses on the overall distribution of pollutants, while the latter focuses on the behavior of individual pollutants.
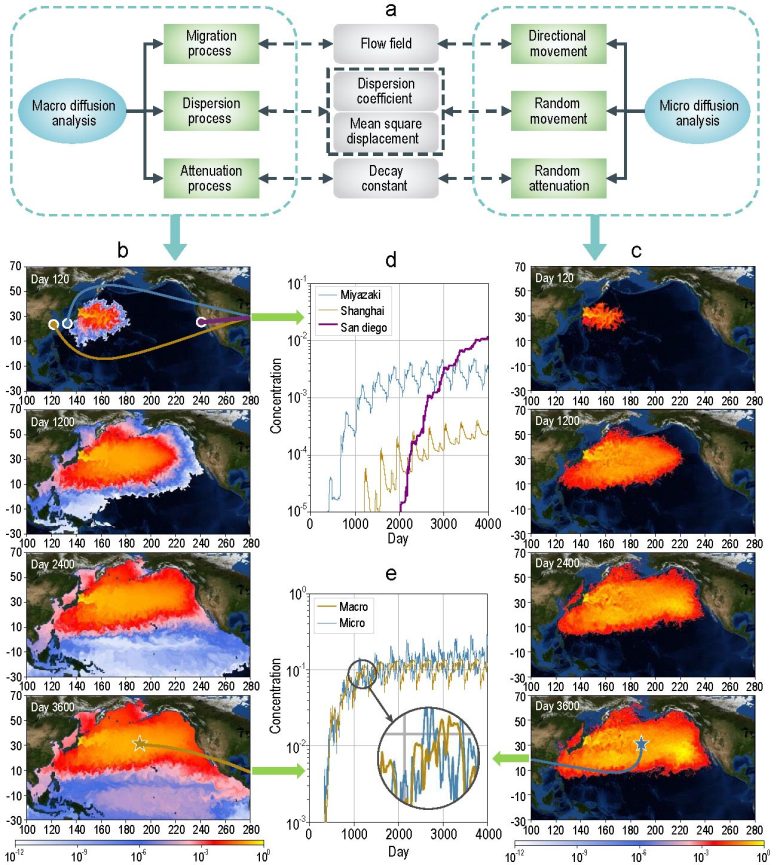
Macro simulation results (Figure b) revealed that in the early stages of pollutant discharge, the polluted area increases rapidly, reaching 30° of latitude × 40° of longitude within 120 days. Due to ocean currents, the pollutant diffusion speed is considerably higher in the latitude direction than that in the longitude direction.
In 1200 days, the pollutants will cover almost the whole North Pacific region, reaching as far as the coast of North America to the east, and the Australia to the south. The pollutants will then spread rapidly to the South Pacific Ocean, under the influence of the equatorial current along the Panama Canal. The Indian Ocean will also be influenced, due to the waters infilling from north of Australia, in 2400 days. On day 3600, the pollutants will cover almost the entire Pacific Ocean.
Notably, although the contaminated water is discharged near the Japanese island, the contamination center (represented by yellow and red in Fig. b and c) will over time move eastward along the 35°N latitude line.

(a) Sub-processes of macroscopic and microscopic diffusion analyses and their relationships. Results of (b) macroscopic and (c) microscopic diffusion analyses for 1 unit relative concentration of approximately 29Bq/m3. (d) Variations in the pollutant concentration in the waters near the three coastal cities. (e) Comparison of the pollutant concentration curves by macro and micro methods. Credit: ©Science China Press
The team plotted the pollutant concentrations in adjacent waters of Miyazaki, Shanghai, and San Diego, all near 30°N, as shown in Figure d. Miyazaki gets polluted first, followed by Shanghai and San Diego, in order of their distances from Fukushima. According to the trend of the three curves, the pollutant concentration in each region increases rapidly at the beginning before stabilization. Although San Diego is the last city among the three to be affected, the steady-state concentration of pollutants in its adjacent waters is even higher than that near Miyazaki.
The differences in pollutant concentrations near Miyazaki, Shanghai, and San Diego result from the strong ocean current near Japan. Specifically, Fukushima is located at the confluence of Kuroshio (northward) and Oyashio (southward). Therefore, most pollutants do not migrate towards north and south along the land edges but spread eastward with the North Pacific west wind drift. In the early stage of treated water discharge, its impact on coastal Asia should be focused on. However, at a subsequent stage, the high concentration of nuclear elements near North America will definitely become a concern.
Reference: “Discharge of treated Fukushima nuclear accident contaminated water: macroscopic and microscopic simulations” by Yi Liu, Xue-Qing Guo, Sun-Wei Li, Jian-Min Zhang and Zhen-Zhong Hu 2021, 26 November 2021, National Science Review.
DOI: 10.1093/nsr/nwab209


Interesting, although this is a simulation. Has anyone sampled the ocean water?
No, the concentrations are to low to measure directly. Tritium occurs naturally when cosmic rays strike nitrogen and it is to diluted you detect anywhere but near the site.
Clean ocean by 2030? they better get to it!
China has been raging about the IAEA recommended solution that Japan agreed to adopt. They don’t even realize that the current flows away from Japan and not towards China. I would not trust any Chinese simulation of alleged tritium discharge since they really are not allowed to think for themselves, just attach their alleged scientific credentials to the result. Fukushima, just like Chinese and other nuclear power plants with access to water that eventually reaches the ocean discharged tritium every year that the plant was operating, but no one made any big deal of that then since all nuclear plants did it. The discharge will take place over about 30 years and the amount discharged will never exceed the annual discharge amount while the plant was generating electricity. The full particulars are here – https://www.iaea.org/communication-dated-13-april-2021-from-the-permanent-mission-of-japan-to-the-agency – read them and learn – the editors of this site should never have picked this simulation which popped out in Images when I Googled City of Fukushima Radiation Measurement. This is almost as bad as the false use of the NOAA tsunami spread map to show spread of radiation (not radioactive contaminants – they always use radiation to scare people) from Fukushima which also shows up in the image search, but both of those links debunk the lie and don’t spread it like this one does.