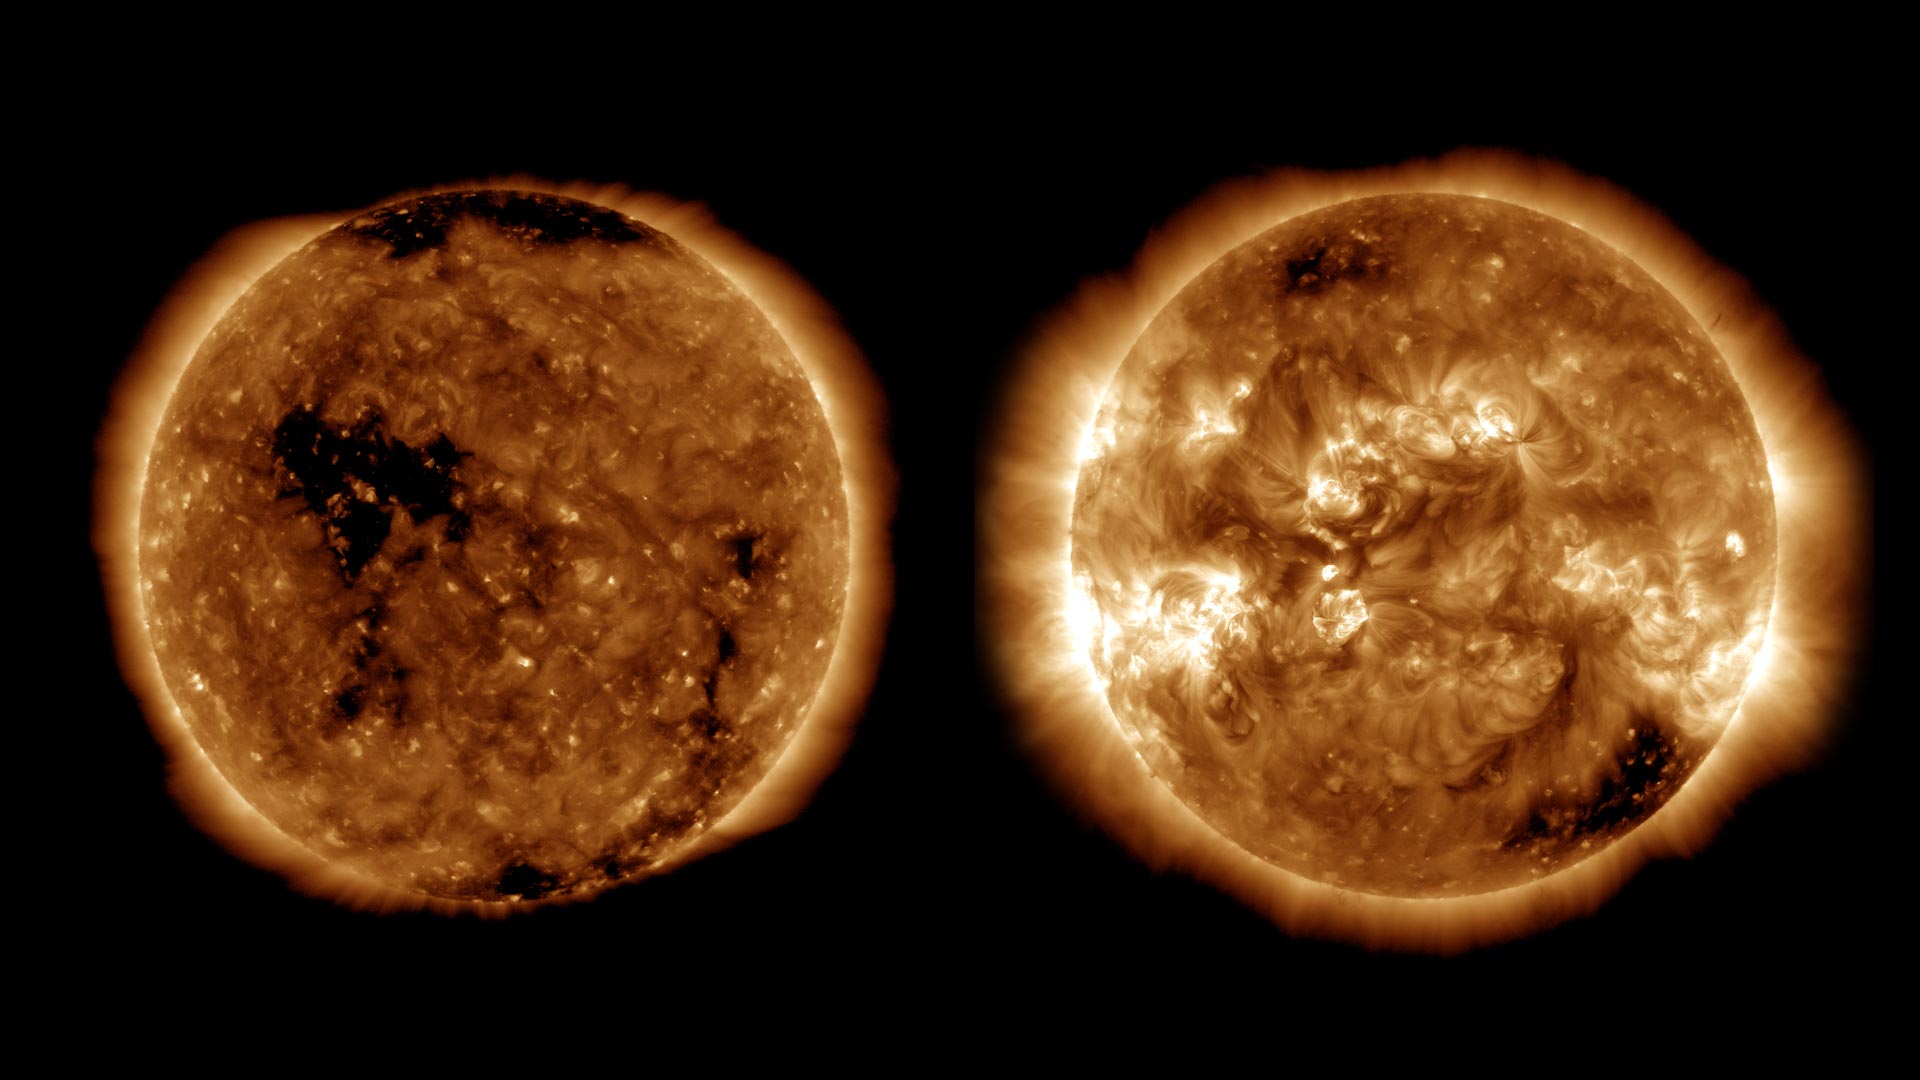
Understanding the Sun’s behavior is an important part of life in our solar system. Scientists use several indicators to track solar cycle progress. Credit: NASA’s Goddard Space Flight Center
Every morning, astronomer Steve Padilla takes a short walk from his home to the base of a tower that soars 150 feet (45 meters) above the ground. Tucked in the San Gabriel Mountains, about an hour’s drive north from Los Angeles, the Mount Wilson Observatory has long been a home for space science — it’s Padilla’s home too, one of the perks to his work as Mount Wilson’s Sun observer. Mount Wilson has several solar system sentinels; the telescope perched at the top of this tower keeps constant watch on the Sun. Observers study the Sun closely, so we can better understand the life and activity of our star.
Padilla boards the outdoor elevator. He clips himself to a safety harness, which is attached to the open-air cab, the same one used every day since the telescope went into operation in 1912 (the cables have since been replaced).
“It can be a little scary on windy days,” Padilla said.
At the top, Padilla adjusts a set of mirrors that projects an image of the Sun into an observing room far below. Back on the ground, he uses an array of pencils, varying in graphite weight, to sketch the dark spots mottling the face of the Sun. This daily chore is the foundation of the sunspot number, our longest record of solar activity. Humans have observed sunspots — dark blotches that arise from strong magnetic activity — for more than 1,000 years, and tracked them in detail since the invention of the telescope, for the past 400. Even with the modern-day host of spacecraft studying the Sun, taking the time to draw sunspots remains the chief way they’re counted. Surveying sunspots is the most basic of ways we study how solar activity rises and falls over time, and it’s the basis of how we track the solar cycle.
Sunspot number over the past five solar cycles. Scientists use sunspots to track solar cycle progress; the dark spots are associated with solar activity, often as the origins for giant explosions — such as solar flares or coronal mass ejections — which can spew light, energy, and solar material out into space. The panel consulted monthly updates in sunspot number data from the World Data Center for the Sunspot Index and Long-term Solar Observations, at the Royal Observatory of Belgium in Brussels, which tracks sunspots and pinpoints the highs and lows of the solar cycle. Credit: SILSO data/image, Royal Observatory of Belgium, Brussels
Sunspots correspond with the Sun’s natural 11-year cycle, in which the Sun shifts from relatively calm to stormy. At its most active, called solar maximum, the Sun is freckled with sunspots and its magnetic poles reverse. (On Earth, that would be like if the North and South Poles flip-flopped every decade.) During solar minimum, sunspots are few and far between. Often, the Sun is as blank and featureless as an egg yolk.
Understanding the Sun’s behavior is an important part of life in our solar system. The Sun’s powerful outbursts can disturb the satellites and communications signals traveling around Earth, or one day, Artemis astronauts exploring distant worlds. NASA scientists study the solar cycle so we can better predict solar activity. As of 2020, the Sun has begun to shake off the sleep of minimum, which occurred in December 2019. Solar Cycle 25 is underway, and scientists are eager for another chance to put their understanding of solar cycle signs to the test.
“The most important thing to remember with predictions is, you’re going to be wrong,” said Dean Pesnell, a solar cycle expert at NASA’s Goddard Space Flight Center in Greenbelt, Maryland. “You’re never going to be perfect. It’s what you learn from that, that allows you to make progress in your predictions.”
During drowsy solar minimum, Padilla observed more spotless days. “There are no spots to draw, so I just have a paper with nothing on it,” he said. Even the absence of sunspots is a useful observation: Tallying up spotless days is one indicator that the Sun’s mood is shifting toward minimum. (Instead of sunspots, dark coronal holes cloud the Sun’s poles at minimum.) On the other hand, in solar maximum, hundreds of spots can form at once. Some drawings can take several hours to complete.
Sunspot drawings from SILSO at the Royal Observatory of Belgium. Surveying sunspots with daily hand-drawn drawings is the most basic of ways we study how solar activity rises and falls over time, and it’s the basis of how we track the solar cycle. Credit: SILSO/Royal Observatory of Belgium
“The Sun has its own pace that we cannot speed up,” said Frédéric Clette, director of the World Data Center for the Sunspot Index and Long-term Solar Observations, or SILSO, at the Royal Observatory of Belgium in Brussels, which tracks sunspots and pinpoints the solar cycle’s highs and lows. “Sometimes, we have a hard time tempering the impatience of people who expect to know overnight if the Sun is truly waking up again.”
Around the world, observers conduct daily sunspot censuses. They draw the Sun at the same time each day, using the same tools for consistency. Together, their observations make up the international sunspot number, a complex task run by SILSO. Some 80 stations around the world contribute their data. Exactly how many stations are included in each day’s count depends on a number of factors like weather (clouds and high winds obscure view of the Sun), or maybe a solar observer has a last-minute appointment.
Despite the interference of daily life, these manual surveys are still the most reliable, long-term record of sunspots we have.
“Satellites can do a lot of things better than a drawing by hand,” said Olivier Lemaître, a Royal Observatory of Belgium solar observer. “But consider a satellite with a 10- to 15-year lifespan — that’s just one solar cycle. You can’t compare it to anything else outside that lifespan.”
But long-term studies are the backbone of solar cycle science. With extensive historical records, scientists can trace the arc of decades-long patterns in the Sun’s behavior. When it comes to counting sunspots, it’s not so much about the accuracy or resolution of the observations as the consistency of the data itself. Even while their city was shut down due to the coronavirus pandemic, an observer from the Royal Observatory team made their way each day to the telescope tower, to keep the record intact.
Lemaître approaches each sunspot drawing methodically, outlining a family of sunspots before shading in finer details. The delicate pencil work belies the powerful explosions sunspots can unleash.
Sunspots arise from clusters of intense magnetic energy. Buoyed by their magnetic force, they rise through churning solar material like a grain of rice in a boiling pot. Sunspots appear darker because they’re cooler than their surroundings; the magnetic knot at their core keeps energy from radiating out past the Sun’s surface. When enough magnetic energy builds over the sunspot, a powerful eruption can burst free — like an exploding soda bottle — spewing light and solar matter.
If they happen to be facing Earth, these solar storms can disrupt satellites, astronauts, and communications signals like radio or GPS. Earth’s upper atmosphere might expand in response, slowing satellites in orbit the way gravel roads slow down cars, eroding satellites’ lifetimes. Although changes on the Sun aren’t usually visible to us without the help of scientific instruments, they impact the space around Earth and other planets.
Chasing solar minimum
Deep inside the Sun, electrified gases flow in currents that generate the Sun’s magnetic field, which fuels its mighty outbursts. During solar minimum, the Sun’s magnetic field is relaxed. At the height of the solar cycle, it’s a tangled mess of magnetic field lines. Understanding this flow, called the dynamo, is key in the effort to predict what the Sun will do next.
Since 1989, the Solar Cycle Prediction Panel — an international panel of experts sponsored by NASA and NOAA, the National Oceanic and Atmospheric Administration — has met each decade to make their prediction for the next solar cycle. The prediction includes the sunspot number at maximum and the cycle’s expected start and peak. The effort requires assessing many different models and navigating many personalities.
“We each have our favorite predictions, or the ones we have the most confidence in,” said Lisa Upton, a solar physicist at Space Systems Research Corporation in Westminster, Colorado, and prediction panel co-chair. “Our duty is to come to a consensus. If we take all of our opinions and models, where is the most overlap, and where can we agree the solar cycle is going to land?”
Scientists are always chasing solar minimum, but they can only recognize it in hindsight. Since minimum is defined by the lowest number of sunspots in a solar cycle, scientists have to see the numbers steadily rise before determining when they were at the bottom.
To complicate things, solar cycles often overlap. As one cycle transitions to the next, both old and new sunspots emerge on the Sun at once. Sunspots often appear in groups, which are like magnets, each with a positive and negative end. As the Sun’s magnetic field slowly flips, so does the polarity of sunspot groups. Where one cycle’s sunspots drift across the Sun with their positive end in the lead, the next cycle’s spots walk negative foot first. On top of that, sunspots in the Sun’s two hemispheres also have opposite orientations.
Each sunspot’s unique magnetic signature makes it possible to determine which cycle produced it — the old one or the new. When the Sun stirs from solar minimum, besides counting the sunspots, scientists want to make sure all the spots rising to the surface are actually new.
“I just caution people, because as excited as we are for the new cycle to come, we have to wait until we actually reach minimum,” Upton said. “It can be six to eight months past minimum before we can say minimum has actually occurred.” Indeed, not until September 2020 did scientists confirm the Sun reached solar minimum in December 2019.
Invisible indicators
Besides sunspots, other indicators can signal when the Sun is reaching its low. If the Sun’s magnetic field were a jigsaw puzzle, one piece is still missing: the magnetic field at the poles. Although scientists can’t measure the polar magnetic field as accurately as other parts of the Sun, estimates provide clues. (Soon, ESA, the European Space Agency, and NASA’s Solar Orbiter will send new images of the Sun’s poles.) In previous cycles, scientists have noticed the strength of the polar magnetic field during solar minimum hints at the intensity of the next maximum. When the poles are weak, the next maximum is weak, and vice versa.
The past few cycles, the strength of the magnetic field at the Sun’s poles has steadily declined; so too has the sunspot number. Now, the poles are roughly as strong as they were at the same point in the last cycle, Cycle 24.
“This is the big test for our models — whether Cycle 25 will play out about the same as Cycle 24,” Pesnell said.
Another indicator of solar cycle progress comes from outside the solar system. Cosmic rays are high-energy particle fragments, the rubble from exploded stars in distant galaxies. During solar maximum, the Sun’s strong magnetic field envelops our solar system in a magnetic cocoon that is difficult for cosmic rays to infiltrate. In off-peak years, the number of cosmic rays in the solar system climbs as more and more make it past the quiet Sun. By tracking cosmic rays both in space and on the ground, scientists have yet another measure of the solar cycle.
While minimum may lack the fireworks of solar maximum, it’s useful for scientists. They make their forecasts, and wait to see how their estimates play out. Some consider it a time to return to the basics.
“In solar minimum, you can ask more difficult questions than at maximum,” Pesnell said.
One area of solar study, called helioseismology, involves scientists collecting soundwaves from inside the Sun, as a way of probing the elusive dynamo. During solar minimum, they don’t have to worry about soundwaves bouncing off the sunspots and active regions characteristic of solar maximum. When sunspots disappear from view, scientists have a chance to finetune their models — without all the solar drama.
Never miss a breakthrough: Join the SciTechDaily newsletter.
Follow us on Google and Google News.