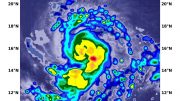
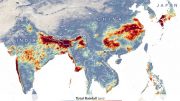
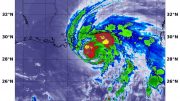
The below animation shows surface rainfall estimates from NASA’s IMERG multi-satellite precipitation product for the week starting on February 22, 2022 at 0000 UTC and ending on February 28, 2022 at 2330 UTC. Areas shaded in blue and yellow show three-hour average snapshots of IMERG rain rates every half-hour overlaid on cloudiness (shown in white/gray) based on geosynchronous satellite infrared observations. Below the rain rates and cloudiness data, IMERG rainfall accumulations are shown in green and purple. Tropical Cyclone Anika’s track is shown with a gray line based on data from the U.S. Navy-Air Force Joint Typhoon Warning Center (JTWC).
IMERG shows Anika’s clockwise circulation and some of the rainbands responsible for bringing rainfall further inland as well as Anika’s relatively slow forward speed along the coast that resulted in estimated rainfall totals of over 250 mm (~10 inches) over parts of the northwest coast of Australia. On the southeast coast, IMERG shows the persistence of the heavy rains around Brisbane that resulted in estimated rain totals in excess of 500 mm (~20 inches) with locally higher amounts reported by individual stations.
Credit: Animation by Jason West (NASA GSFC / Adnet), produced by Ryan Fitzgibbons (NASA GSFC / KBRwyle)
Be the first to comment on "NASA’s IMERG Catches Australian “Rain Bomb”"