At the heart of understanding our space environment is the knowledge that conditions throughout space — from the Sun to the atmospheres of planets to the radiation environment in deep space — are connected.
Studying this connection — a field of science called heliophysics — is a complex task: Researchers track sudden eruptions of material, radiation, and particles against the background of the ubiquitous outflow of solar material.
A confluence of events in early 2020 created a nearly ideal space-based laboratory, combining the alignment of some of humanity’s best observatories — including Parker Solar Probe, during its fourth solar flyby — with a quiet period in the Sun’s activity, when it’s easiest to study those background conditions. These conditions provided a unique opportunity for scientists to study how the Sun influences conditions at points throughout space, with multiple angles of observation and at different distances from the Sun.
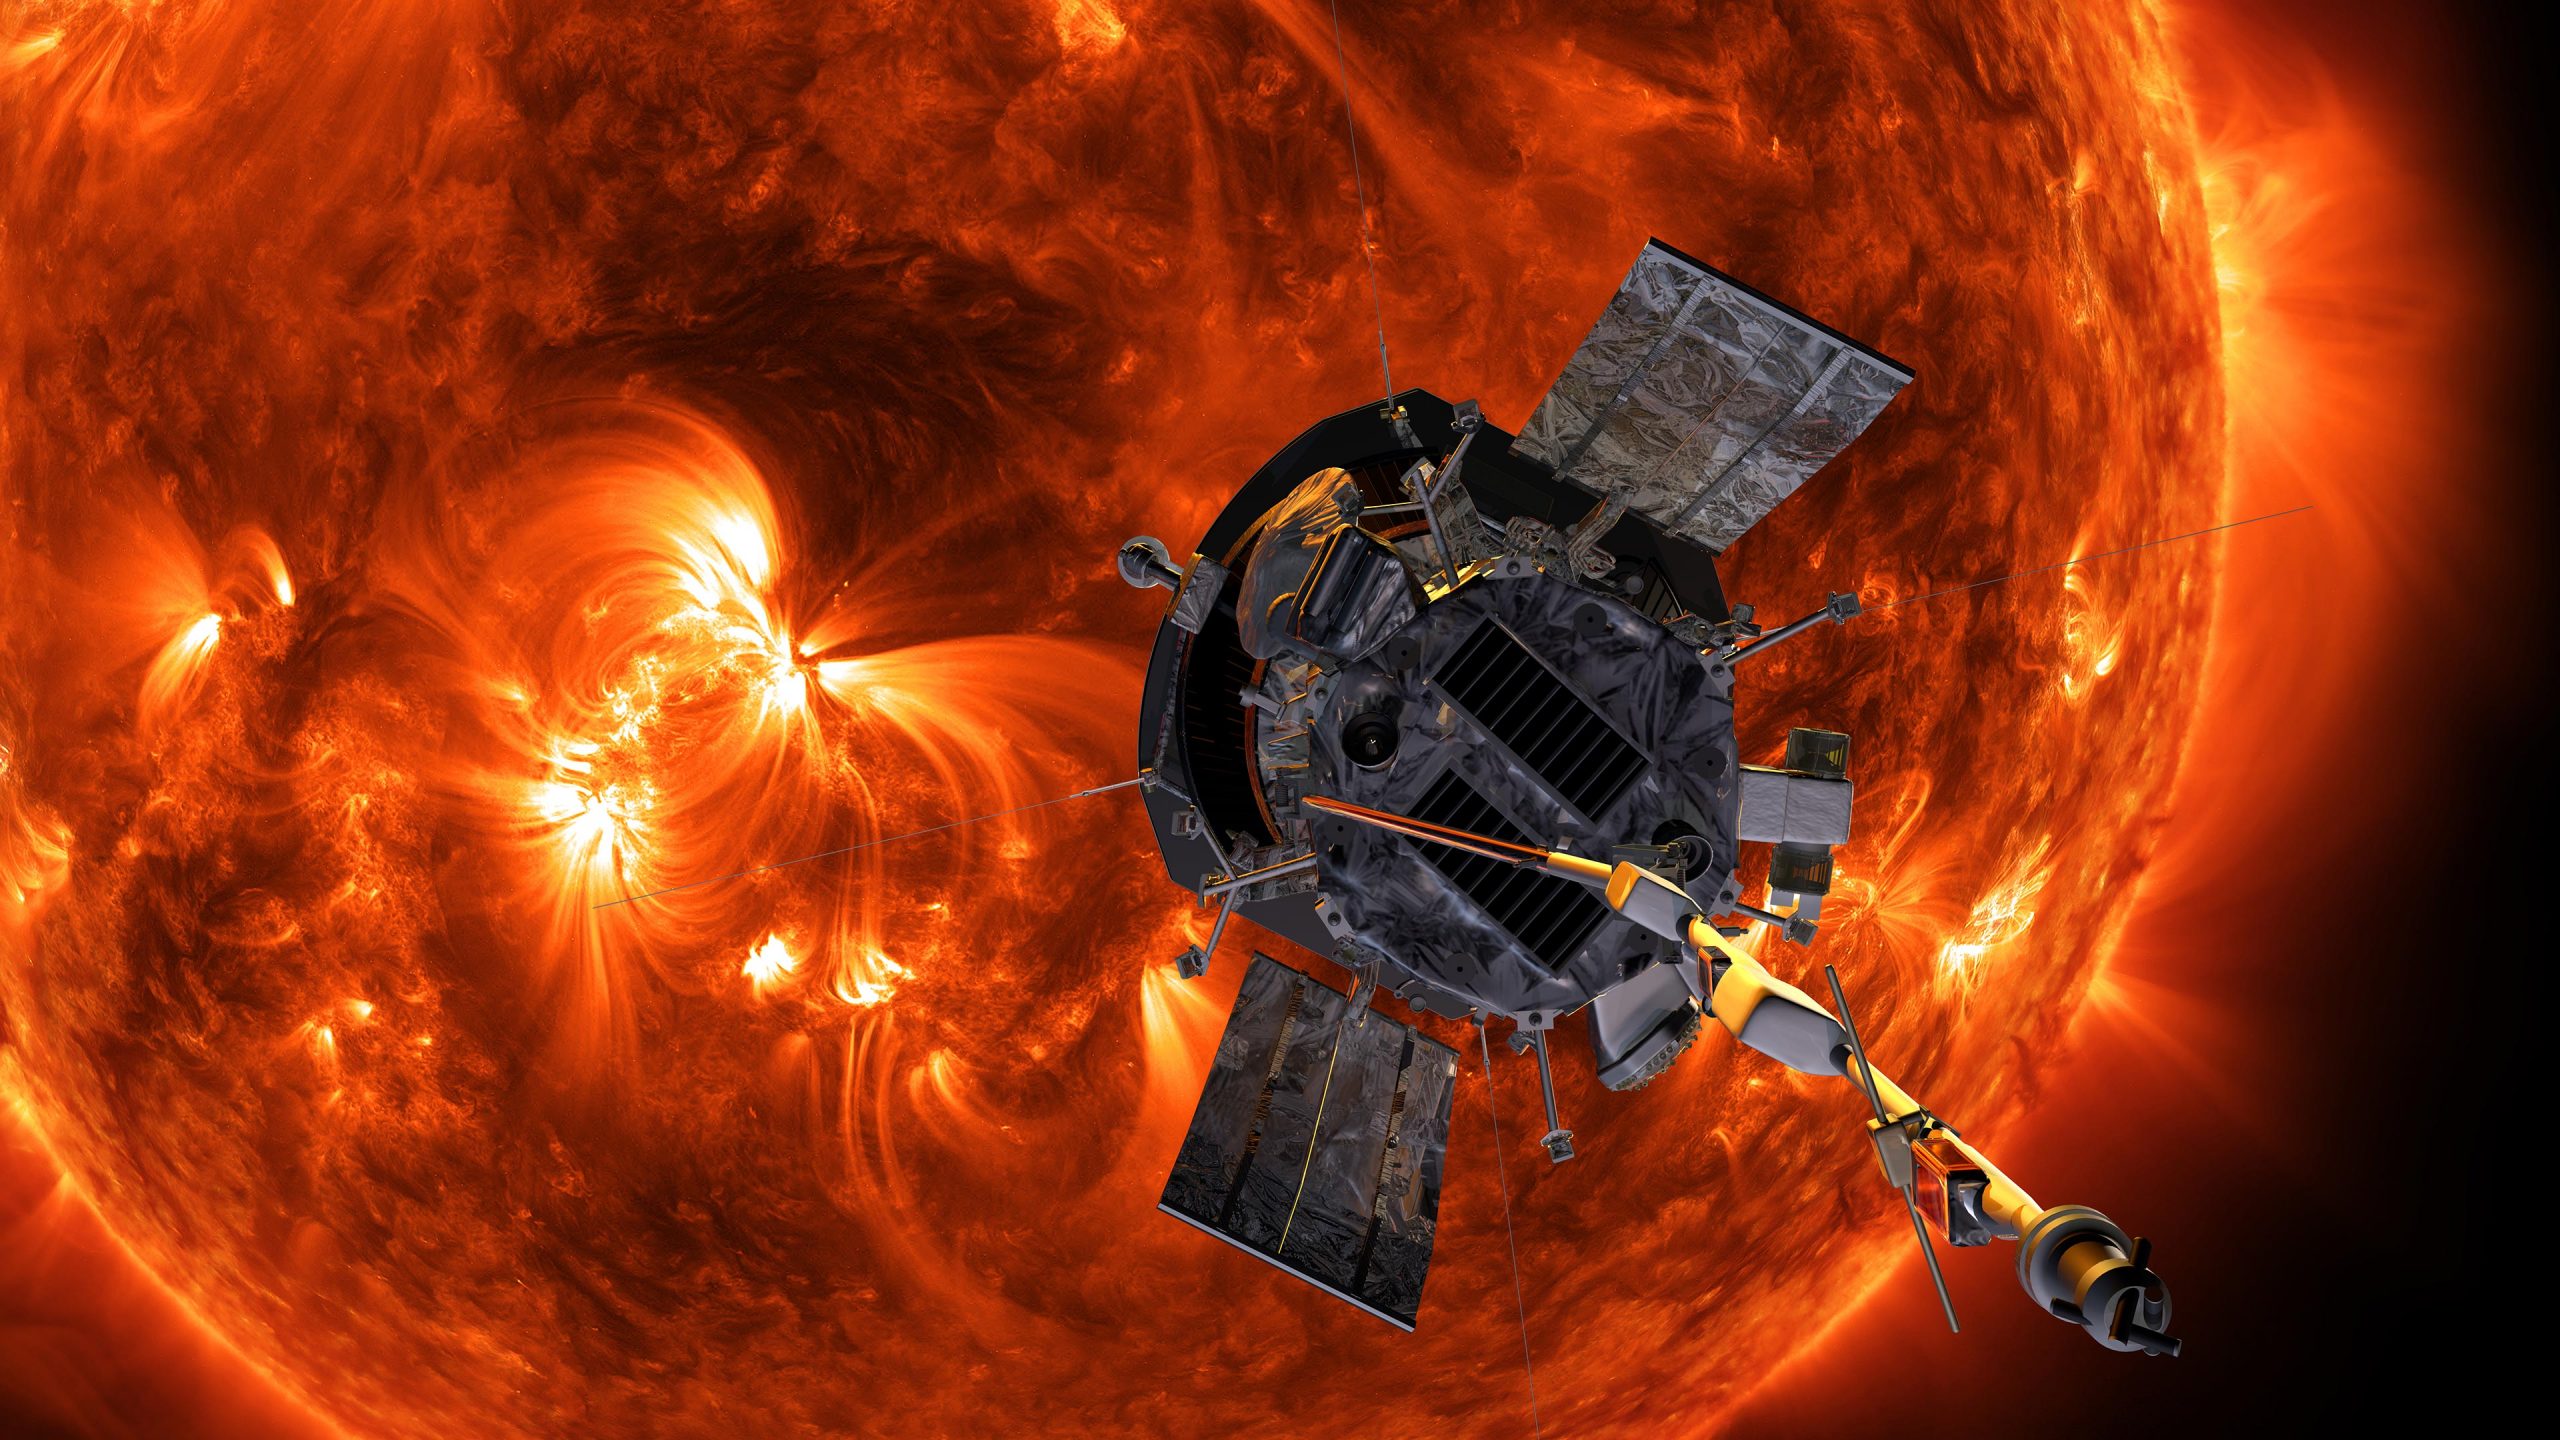
The Sun is an active star whose magnetic field is spread out through the solar system, carried within the Sun’s constant outflow of material called the solar wind, which affects spacecraft and shapes the environments of worlds throughout the solar system. We’ve observed the Sun, space near Earth and other planets, and even the most distant edges of the Sun’s sphere of influence for decades. And 2018 marked the launch of a new, game-changing observatory: Parker Solar Probe, with a plan to ultimately fly to about 3.83 million miles from the Sun’s visible surface.
Parker has now had four close encounters of the Sun. (The data from Parker’s first encounters with the Sun has already revealed a new picture of its atmosphere.) During its fourth solar encounter, spanning parts of January and February 2020, the spacecraft passed directly between the Sun and Earth. This gave scientists a unique opportunity: The solar wind that Parker Solar Probe measured when it was closest to the Sun would, days later, arrive at Earth, where the wind itself and its effects could be measured by both spacecraft and ground-based observatories. Furthermore, solar observatories on and near Earth would have a clear view of the locations on the Sun that produced the solar wind measured by Parker Solar Probe.
“We know from Parker data that there are certain structures originating at or near the solar surface. We need to look at the source regions of these structures to fully understand how they form, evolve, and contribute to the plasma dynamics in the solar wind,” said Nour Raouafi, project scientist for the Parker Solar Probe mission at the Johns Hopkins Applied Physics Laboratory in Laurel, Maryland. “Ground-based observatories and other space missions provide supporting observations that can help draw the full picture of what Parker is observing.”
This celestial alignment would be of interest to scientists under any circumstances, but it also coincided with another astronomical period of interest to scientists: solar minimum. This is the point during the Sun’s regular, approximately 11-year cycles of activity when solar activity is at its lowest level — so sudden eruptions on the Sun such as solar flares, coronal mass ejections, and energetic particle events are less likely. And that means that studying the Sun near solar minimum is a boon for scientists who can watch a simpler system and thus untangle which events cause which effects.
“This period provides perfect conditions to trace the solar wind from the Sun to Earth and the planets,” said Giuliana de Toma, a solar scientist at the High Altitude Observatory in Boulder, Colorado, who led coordination among observatories for this observation campaign. “It is a time when we can follow the solar wind more easily, since we don’t have disturbances from the Sun.”
For decades, scientists have pulled together observations during these periods of solar minimum, an effort co-led by Sarah Gibson, a solar scientist at the High Altitude Observatory, and other scientists. For each of the past three solar minimum periods, scientists pooled observations from an ever-expanding list of observatories in space and on the ground, hoping the wealth of data on the undisturbed solar wind would unveil new information about how it forms and evolves. For this solar minimum period, scientists began gathering coordinated observations starting in early 2019 under the umbrella Whole Heliosphere and Planetary Interactions, or WHPI for short.
This particular WHPI campaign comprised a broader-than-ever swath of observations: covering not only the Sun and effects on Earth, but also data gathered at Mars and the nature of space throughout the solar system — all in concert with Parker Solar Probe’s fourth and closest-yet flyby of the Sun.
The WHPI organizers brought together observers from all over the world — and beyond. Combining data from dozens of observatories on Earth and in space gives scientists a chance to paint what might be the most comprehensive picture ever of the solar wind: from images of its birth with solar telescopes, to samples shortly after it leaves the Sun with Parker Solar Probe, to multi-point observations of its changing state throughout space.
Read on to see samples of the kinds of data captured during this international collaboration of Sun and space observatories.
Parker Solar Probe
Early data from Parker Solar Probe’s close pass by the Sun during the WHPI campaign shows a solar wind system more dynamic than what’s visible in observations near Earth. In particular, scientists hope the full set of data — downlinked to Earth in May 2020 — will reveal dynamic structures, like tiny coronal mass ejections and magnetic flux ropes in their early stages of development, that can’t be seen with other observatories watching from farther away. Connecting structures like this, previously too small or too distant to see, with solar wind and near-Earth measurements may help scientists better understand how the solar wind changes throughout its lifetime and how its origins near the Sun affect its behavior throughout the solar system.
Mauna Loa Solar Observatory
Parker Solar Probe’s close-up views of solar wind structures are complemented by solar observatories on Earth and in space, which have a larger field of view to capture solar wind structures.
Data from the Mauna Loa Solar Observatory in Hawaii shows a jet of material being ejected near the Sun’s south pole on Jan. 21, 2020. Coronal jets like this are one solar wind feature that scientists hope to observe more closely with Parker Solar Probe, as the mechanisms that create them could shed more light on the solar wind’s birth and acceleration.
“It would be extremely fortunate if Parker Solar Probe observed this jet, since it would provide information on plasma and the field in and around the jet not long after its formation,” said Joan Burkepile, lead scientist for the Coronal Solar Magnetism Observatory K-coronagraph instrument at the Mauna Loa Solar Observatory, which captured these images.
NASA’s Solar and Terrestrial Relations Observatory, or STEREO, took extra images with longer exposure times to improve views of structure in the solar wind. These difference images, spanning Jan. 21-23, 2020, are created by subtracting the pixels of a previous image from the current image to highlight changes. Credit: NASA/STEREO
Solar and Terrestrial Relations Observatory
Along with observations of the solar wind from Parker Solar Probe and near Earth, scientists also have detailed images of the Sun and its atmosphere from spacecraft like NASA’s Solar Dynamics Observatory and the Solar and Terrestrial Relations Observatory. NASA’s Solar and Terrestrial Relations Observatory, or STEREO, has a distinct view of the Sun from its vantage point about 78 degrees away from Earth.
During this WHPI campaign, scientists took advantage of this unique viewing angle. From Jan. 21-23 — when Parker Solar Probe and STEREO were aligned — the STEREO mission team increased the exposure length and frequency of images taken by its coronagraph, revealing fine structures in the solar wind as they speed out from the Sun.
These difference images are created by subtracting the pixels of a previous image from the current image to highlight changes — here, revealing a small CME that would otherwise be difficult to see.
NASA’s Solar Dynamics Observatory keeps a constant eye on the Sun. These images, captured in a wavelength of extreme ultraviolet light, span January 15 – February 11, 2020. Credit: NASA/SDO
Solar Dynamics Observatory
The Solar Dynamics Observatory, or SDO, takes high-resolution views of the entire Sun, revealing fine details on the solar surface and the lower solar atmosphere. These images were captured in a wavelength of extreme ultraviolet light at 171 Angstroms, highlighting the quiet parts of the Sun’s outer atmosphere, the corona. This data — along with SDO’s images in other wavelengths — maps much of the Sun’s activity, allowing scientists to connect solar wind measurements from Parker Solar Probe and other spacecraft with their possible origins on the Sun.
Modeling the Data
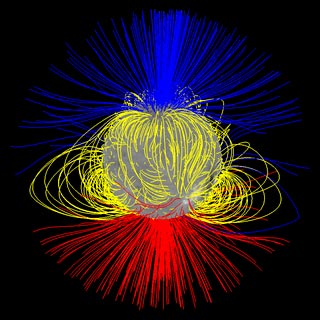
Ideally, scientists could use these images to readily pinpoint the region on the Sun that produced a particular stream of solar wind measured by Parker Solar Probe — but identifying the source of any given solar wind stream observed by a spacecraft is not simple. In general, the magnetic field lines that guide the solar wind’s movement flow out of the Northern half of the Sun point in the opposite direction than they do in the Southern half. In early 2020, Parker Solar Probe’s position was right at the boundary between the two – an area known as the heliospheric current sheet.
“For this perihelion, Parker Solar Probe was very close to the current sheet, so a little nudge one way or the other would make the magnetic footpoint shift to the south or north pole,” said Nick Arge, a solar scientist at NASA’s Goddard Space Flight Center in Greenbelt, Maryland. “We were on the tipping point where sometimes it went north, sometimes south.”
Predicting which side of the tipping point Parker Solar Probe was on was the responsibility of the modeling teams. Using what we know about the Sun’s magnetic field and the clues we can glean from distant images of the Sun, they made day-by-day predictions of where, precisely, on the Sun birthed the solar wind that Parker would fly through on a given day. Several modeling groups made daily attempts to answer just that question.
Using measurements of the magnetic field at the Sun’s surface, each group made a daily prediction for the source region producing the solar wind that Parker Solar Probe was flying through.
Arge worked with Shaela Jones, a solar scientist at NASA Goddard who did daily forecasting during the WHPI campaign, using a model originally developed by Arge and colleagues Yi-Ming Wang and Neil Sheeley, called the WSA model. According to their forecasts, the predicted source of the solar wind switched between hemispheres suddenly during the observation campaign, because Earth’s orbit at the time was also closely aligned with the heliospheric current sheet – that region where the direction of magnetic polarity and the source of the solar wind switches between north and south. They predicted that Parker Solar Probe, flying in a similar plane as Earth, would experience similar switches in solar wind source and magnetic polarity as it flew near the Sun.
Solar wind models rely on daily measurements of the Sun’s surface magnetic field — the black and white image underlaid. This particular model used measurements from the National Solar Observatory’s Global Oscillation Network Group and a model that focuses on predicting how the Sun’s surface magnetic field will change over several days. Creating these magnetic surface maps is a complicated and imperfect process unto itself, and some of the modeling groups participating in the WHPI campaign also used magnetic measurements from multiple observatories. This, along with differences in each group’s models, created a spread of predictions that sometimes placed the source of Parker Solar Probe’s solar wind stream in two different hemispheres of the Sun. But given the inherent uncertainty in modeling the solar wind’s source, these different predictions can actually make for more robust operations.
“If you can observe the Sun in two different places with two telescopes, you have a better chance to get the right spot,” said Jones.
Poker Flat Incoherent Scatter Radar
The solar wind carries with it both an enormous amount of energy and the embedded magnetic field of the Sun. When it reaches Earth, it can ring our planet’s natural magnetic field like a bell, making it bend and deform — which produces a measurable change in magnetic field strength at certain points on Earth’s surface. We track those changes because magnetic field oscillations can lead to a host of space weather effects that interfere with spacecraft or even, occasionally, utility grids on the ground.
A host of ground-based magnetometers have tracked these effects since the 1850s, and they’re one of the many sets of data scientists are gathering in connection with this campaign. Other ground-based instruments can reveal the invisible effects of space weather in our atmosphere. One such system is the Poker Flat Incoherent Scatter Radar, or PFISR — a radar system based at the Poker Flat Research Range near Fairbanks, Alaska.
This radar is specially tuned to detect one of the most reliable indicators of a disturbance in Earth’s magnetic field: electrons in Earth’s upper atmosphere. These electrons are created when particles trapped in the magnetosphere are sent zooming into Earth’s atmosphere by a complex series of events, a set of circumstances known as a magnetospheric substorm.
On Jan. 16, PFISR measured the changing electrons in Earth’s upper atmosphere during one such substorm. During a substorm, particles cascade into the upper atmosphere, not only creating the shower of electrons measured by the radar, but driving a more visible effect: the aurora. PFISR uses multiple beams of radar oriented in different directions, which allowed scientists to build up a three-dimensional picture of how electrons in the atmosphere changed throughout the substorm.
The Poker Flat Incoherent Scatter Radar in Poker Flat, Alaska, makes 3-D measurements of electrons in Earth’s upper atmosphere. These electrons are produced by the same process that produces aurora, seen here by the Poker Flat All-Sky Camera, which images aurora over Alaska, on Jan. 16, 2020. Credit: Poker Flat Incoherent Scatter Radar (NSF)/Poker Flat All-Sky Camera (University of Alaska Fairbanks)/Don Hampton
Because this substorm took place so early in the observation campaign — only one day after data collection began — it’s unlikely that it was caused by conditions on the Sun observed during the campaign. But even so, the connection between magnetospheric substorms and the broader, global-scale effects created by the solar wind — called geomagnetic storms — isn’t entirely understood.
“This substorm didn’t happen during a geomagnetic storm time,” said Roger Varney, principal investigator for PFISR at SRI International in Menlo Park, California. “The solar wind during this event is fluctuating, but not particularly strongly — it’s basically background noise. But solar wind is basically never steady; it’s constantly putting some energy into the magnetosphere.”
This deposit of energy into Earth’s magnetic system has far-reaching effects: for one, changes in the composition and density of Earth’s upper atmosphere can garble communications and navigation signals, an effect often characterized by total electron content. Changes in density can also affect the orbits of satellites to a great degree, introducing uncertainty about the precise position.
MAVEN
Earth isn’t the only planet where the solar wind has measurable effects — and studying other worlds in our solar system can help scientists understand some of the solar wind’s effects on Earth and how it influenced the evolution of Earth and other worlds throughout the solar system’s history.
At Mars, the solar wind coupled with Mars’ lack of a global magnetic field may be a major factor in the dry, barren world the Red Planet is today. Though Mars was once much like Earth — warm, with liquid water and a thick atmosphere — the planet has changed drastically over the course of its four-billion-year history, with most of its atmosphere being stripped away to space. With similar processes observed here on Earth, scientists leverage the understanding of solar-planetary interactions at Mars to determine how processes leading to atmospheric escape has the ability to change whether a planet is habitable or not. Today, the Mars Atmosphere and Volatile Evolution mission, or MAVEN, studies these processes at Mars. MAVEN observations at Mars are available for this latest WHPI campaign.
Over the coming months, heliophysicists around the world will begin to study data from these observatories in depth, hoping to draw connections that reveal new knowledge about the Sun and its changes that influence Earth and space across the solar system.
Parker Solar Probe is part of the NASA Heliophysics Living with a Star program to explore aspects of the Sun-Earth system that directly affect life and society. The Living with a Star program is managed by the agency’s Goddard Space Flight Center in Greenbelt, Maryland, for NASA’s Science Mission Directorate in Washington. The Johns Hopkins Applied Physics Laboratory in Laurel, Maryland, designed, built and operates the spacecraft and manages the mission for NASA.
The research discussed in this story includes work supported by the Poker Flat Incoherent Scatter Radar which is a major facility funded by the National Science Foundation through cooperative agreement AGS-1840962 to SRI International and work at the National Center for Atmospheric Research funded by the National Science Foundation through cooperative agreement AGS-1852977. Support for the WHPI Campaigns is provided through NASA’s Heliophysics System Observatory Connect (HSO Connect) program.
Never miss a breakthrough: Join the SciTechDaily newsletter.
Follow us on Google and Google News.