New research from University of Massachusetts Amherst gives clearer picture of mid-Miocene Antarctic ice sheet.
Last month saw the average concentration of atmospheric carbon dioxide (CO2) climb to almost 418 parts-per-million, a level not seen on Earth for millions of years. In order to get a sense of what our future may hold, scientists have been looking to the deep past. Now, new research from the University of Massachusetts Amherst, which combines climate, ice sheet, and vegetation model simulations with a suite of different climatic and geologic scenarios, opens the clearest window yet into the deep history of the Antarctic ice sheet and what our planetary future might hold.
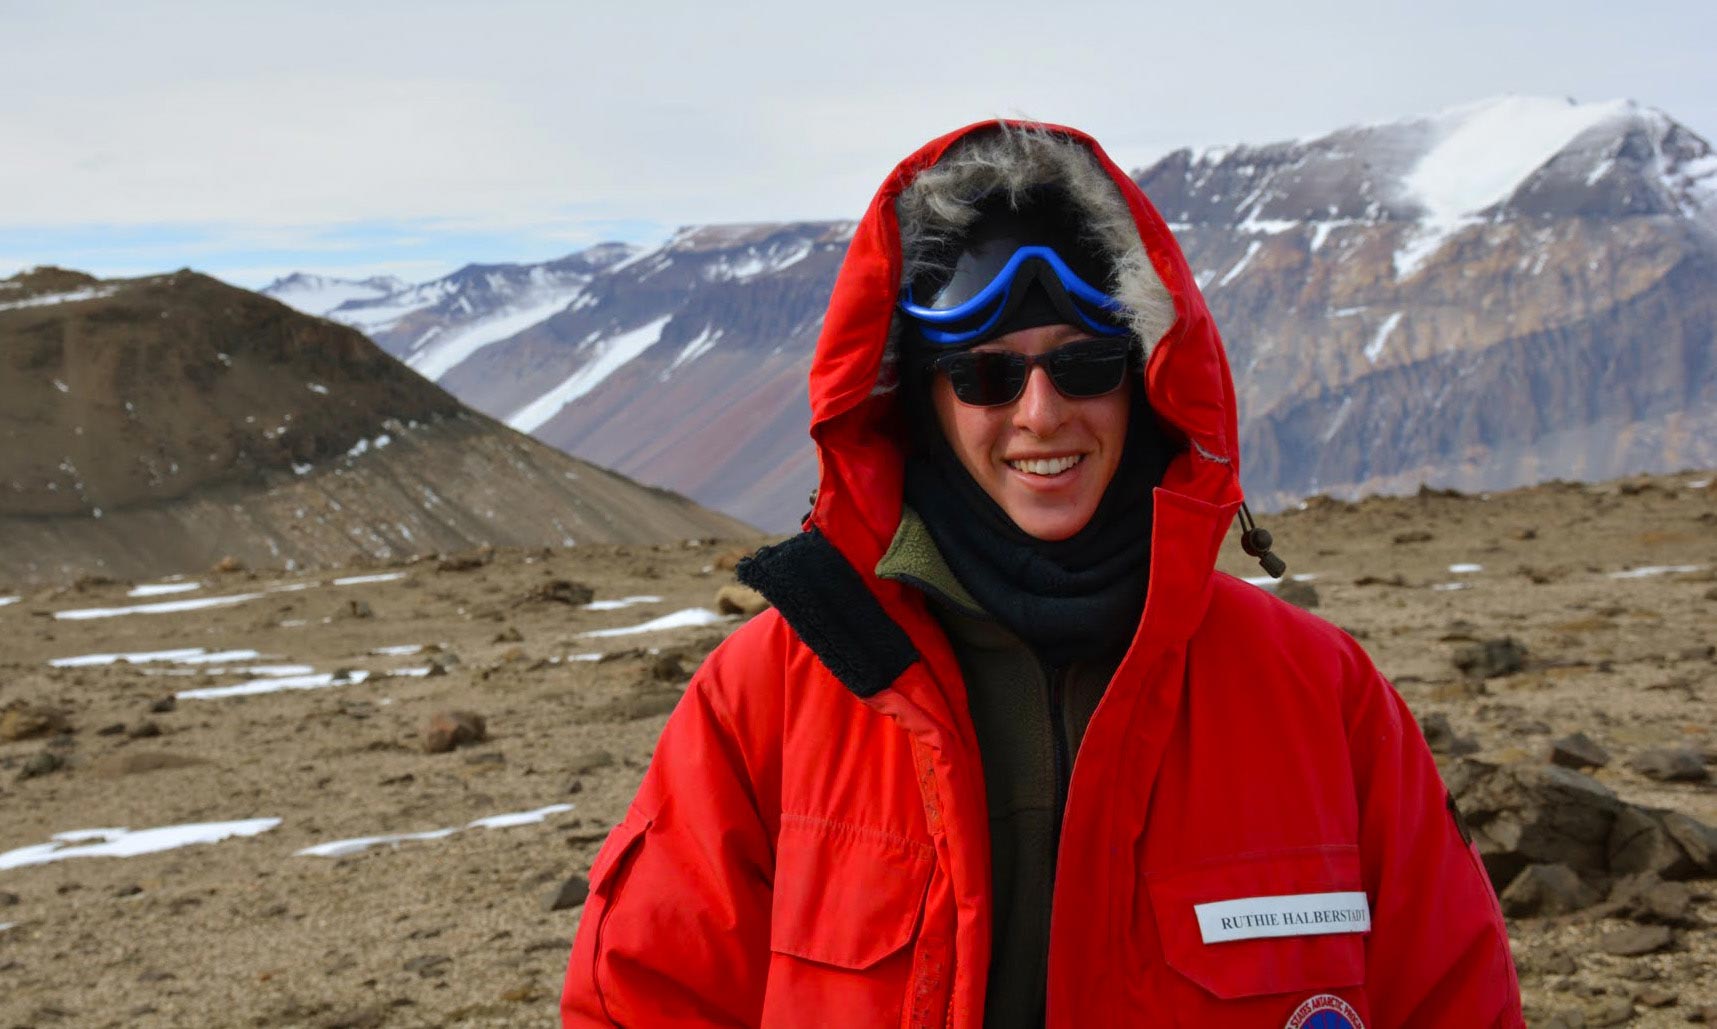
The Antarctic ice sheet has attracted the particular interest of the scientific community because it is “a lynchpin in the earth’s climate system, affecting everything from oceanic circulation to climate,” says Anna Ruth Halberstadt, a Ph.D. candidate in geosciences and the paper’s lead author, which appeared recently in the journal Earth and Planetary Science Letters. Additionally, the ice sheet contains enough frozen water to raise current sea levels by 57 meters (187 feet).
Yet, it has been difficult to accurately reconstruct the mid-Miocene Antarctic climate. Researchers can run models, but without geologic data to check the models against, it’s difficult to choose which simulation is correct. Conversely, researchers can extrapolate from geologic data, but such data points offer only local snapshots, not a wider climatic context. “We need both models and geologic data to know anything at all,” says Halberstadt. There’s one final complicating factor: geology. Antarctica is bisected by the Transantarctic Mountains, and any clear picture of Antarctica’s deep history must be able to account for the slow uplift of the continent’s mountain range. “Without knowing the elevation,” says Halberstadt, “it’s difficult to interpret the geologic record.”
A Novel Approach to Climate Modeling
Halberstadt and her colleagues, including researchers in both New Zealand and the UK, devised a unique approach in which they coupled an ice sheet model with a climate model, while also simulating the types of vegetation that would grow under each climatic model scenario. The team used historical geologic datasets that included such known paleoclimatic data points as past temperature, vegetation, and glacial proximity, to benchmark their modeled climates. Next, the team used their benchmarked model runs to make inferences about which CO2 and tectonic model scenarios satisfied the known geologic constraints. Finally, Halberstadt and her colleagues extrapolated continent-wide glacial conditions.
The research, which was supported by the NSF, reconstructed a thick but diminished ice sheet under the warmest mid-Miocene environmental conditions. In this model, although the margins of Antarctica’s ice sheet had retreated significantly, greater precipitation led to a thickening of the ice sheet’s interior regions. The team’s modeling further suggests ice over the Wilkes Basin region of Antarctica advanced during glacial periods and retreated during interglacials. The Wilkes Basin is the region thought to be particularly sensitive to future warming and may contribute to future sea level rise.
“Antarctica’s paleoclimate,” says Halberstadt, “is fundamental to understanding the future.”
Reference: “CO2 and tectonic controls on Antarctic climate and ice-sheet evolution in the mid-Miocene” by Anna Ruth W. Halberstadt, Hannah Chorley, Richard H. Levy, Timothy Naish, Robert M. De Conto, Edward Gasson and Douglas E. Kowalewski, 31 March 2021, Earth and Planetary Science Letters.
DOI: 10.1016/j.epsl.2021.116908
Never miss a breakthrough: Join the SciTechDaily newsletter.
Follow us on Google and Google News.
1 Comment
“… but without geologic data to check the models against, it’s difficult to choose which simulation is correct.”
This basically sounds like ‘cherry picking.’ Run enough different models and at least one will be correct, or at least come closest to the geologic data. That is, logically, there can only be one best model, which need not actually be correct.
Ideally, if the modelers understood the system they are modeling, all the models should be similar, varying by only a few percent at most. That is, First Principles should provide models that are similar and usable. If that isn’t the case, it is prima facie evidence that the system is poorly understood and ‘tuning’ or other ad hoc adjustments to agree with reality is little more than curve fitting with complex functions and doesn’t provide confidence that extrapolations will be any better than from a polynomial least-squares regression.
T. C. Chamberlain proposed his “Method of Multiple Working Hypotheses.” Therein, one ‘brainstorms,’ to come up with a list of plausible or reasonable hypotheses (formal explanations). Then, in the spirit of Sherlock Holmes, all the impossible hypotheses are whittled away, leaving what must be the truth — possibly! If the correct hypothesis wasn’t in the collection being considered, then there is nothing left to consider!
The way that the Scientific Method is supposed to work is to consider a single hypothesis, which hasn’t been shown to be impossible, initially. Then, the null-hypothesis (opposite) is tested in an effort to disprove it. If the null-hypthesis is disproved, then the original hypothesis is tentatively accepted. It is extremely difficult to impossible to actually prove a hypothesis. That is why, after more than 100 years, Einstein’s seminal relativity theories are still being tested to try to disprove them.
A computer model is a form of complex, quantitative model, based on the physics and chemistry of the system. Models can go wrong in many different ways. They might have a limited range where the output is trustworthy or skillful. Going beyond that range they can become unstable and useless. They can have ‘divide by zero’ discontinuities embedded in the useful range, which are not immediately obvious. More commonly, the models are missing important, unknown factors, and give poor results, even with ‘tuning.’ (That is why new aircraft designs are initially tested with fluid dynamics computer models, then tested in a wind tunnel, and then finally tested as a flying prototype.)
I have yet to read about any global circulation models, or even simpler glacier-dynamics models, subjected to the rigor of testing routinely applied in aircraft development.
I’m not anti-science, or even anti-modeling. I’m just cautioning against placing unwarranted trust in the claims resulting from simplistic models that are exploring the relationships between the known factors affecting the behavior of the system being studied.