Lockdowns imposed to halt the spread of the coronavirus have been recently linked with cleaner air quality over Europe and China. New images, from the Copernicus Sentinel-5P satellite, from the European Union Copernicus program, now show some cities across India seeing levels drop by around 40–50% owing to its nationwide quarantine.
On March 25, 2020, the Indian government placed its population of more than 1.3 billion citizens under lockdown in an effort to reduce the spread of the COVID-19 disease. All non-essential shops, markets, and places of worship were closed with only essential services including water, electricity, and health services remaining active.
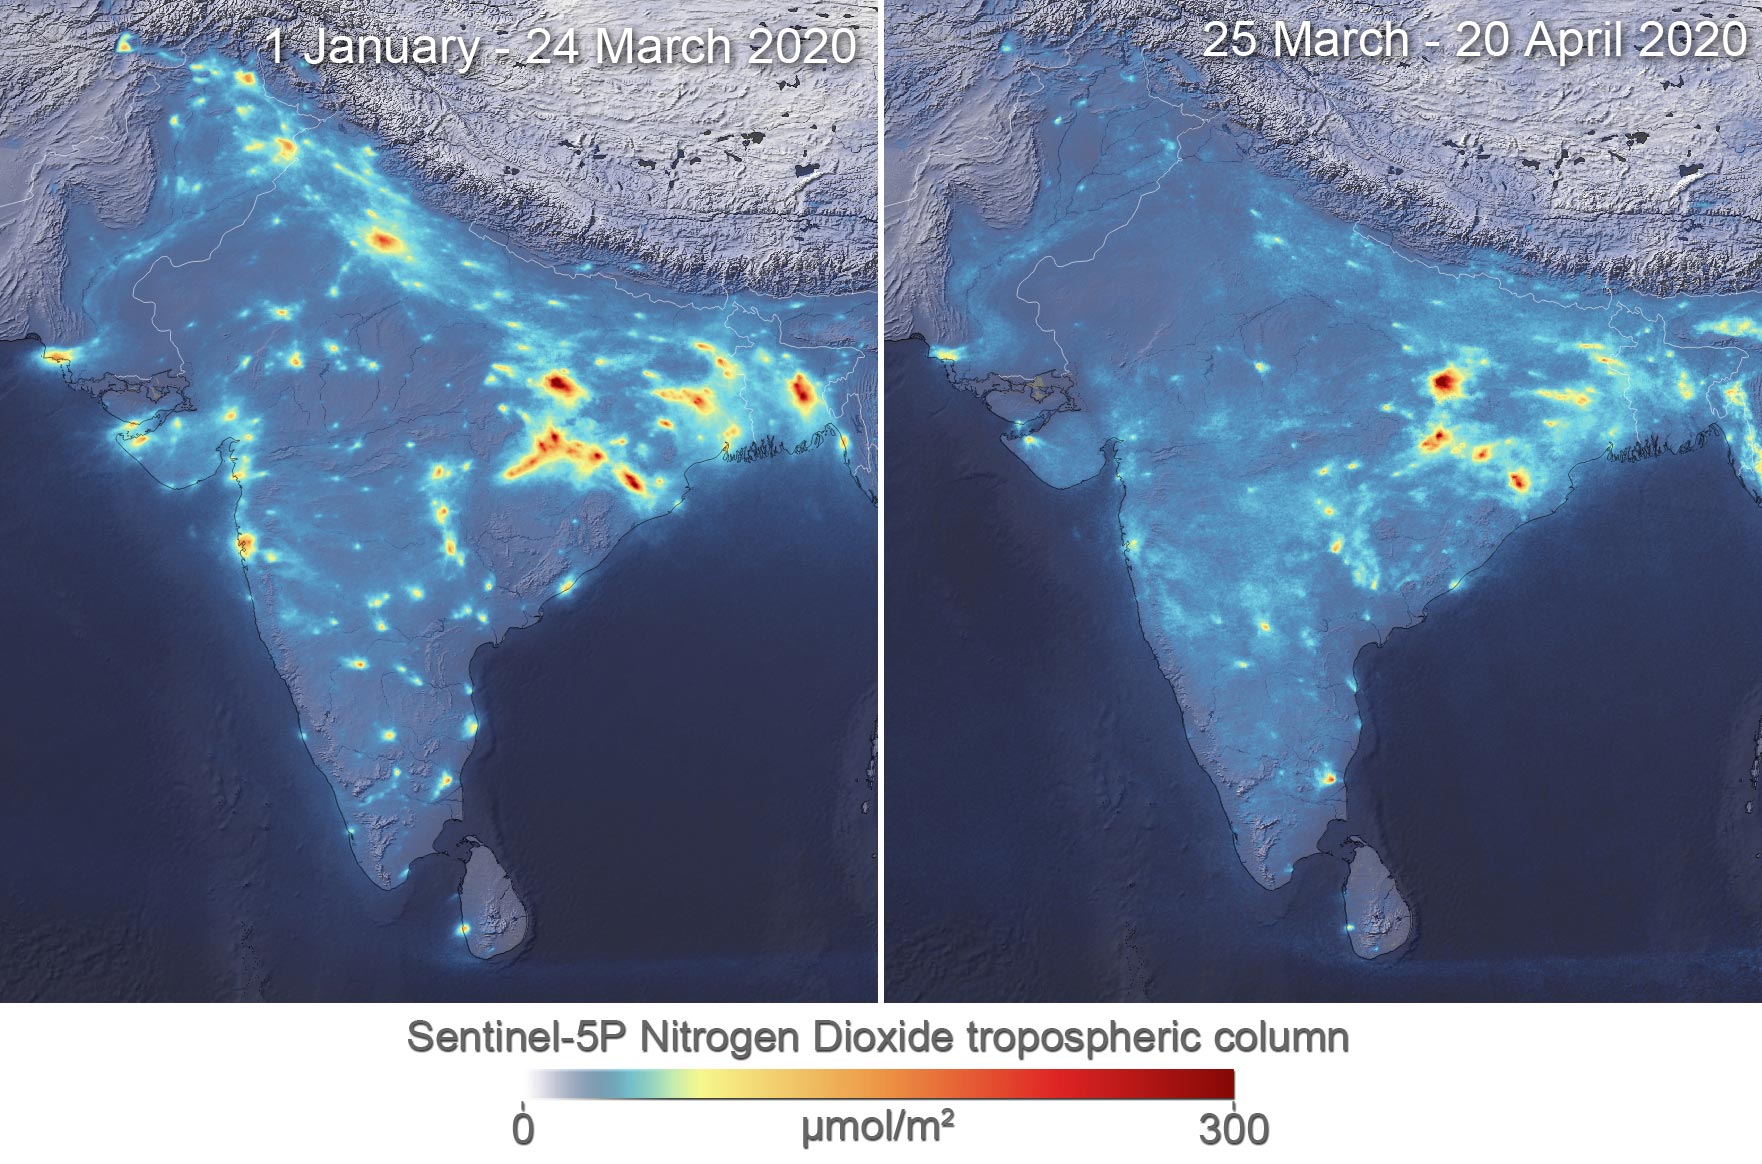
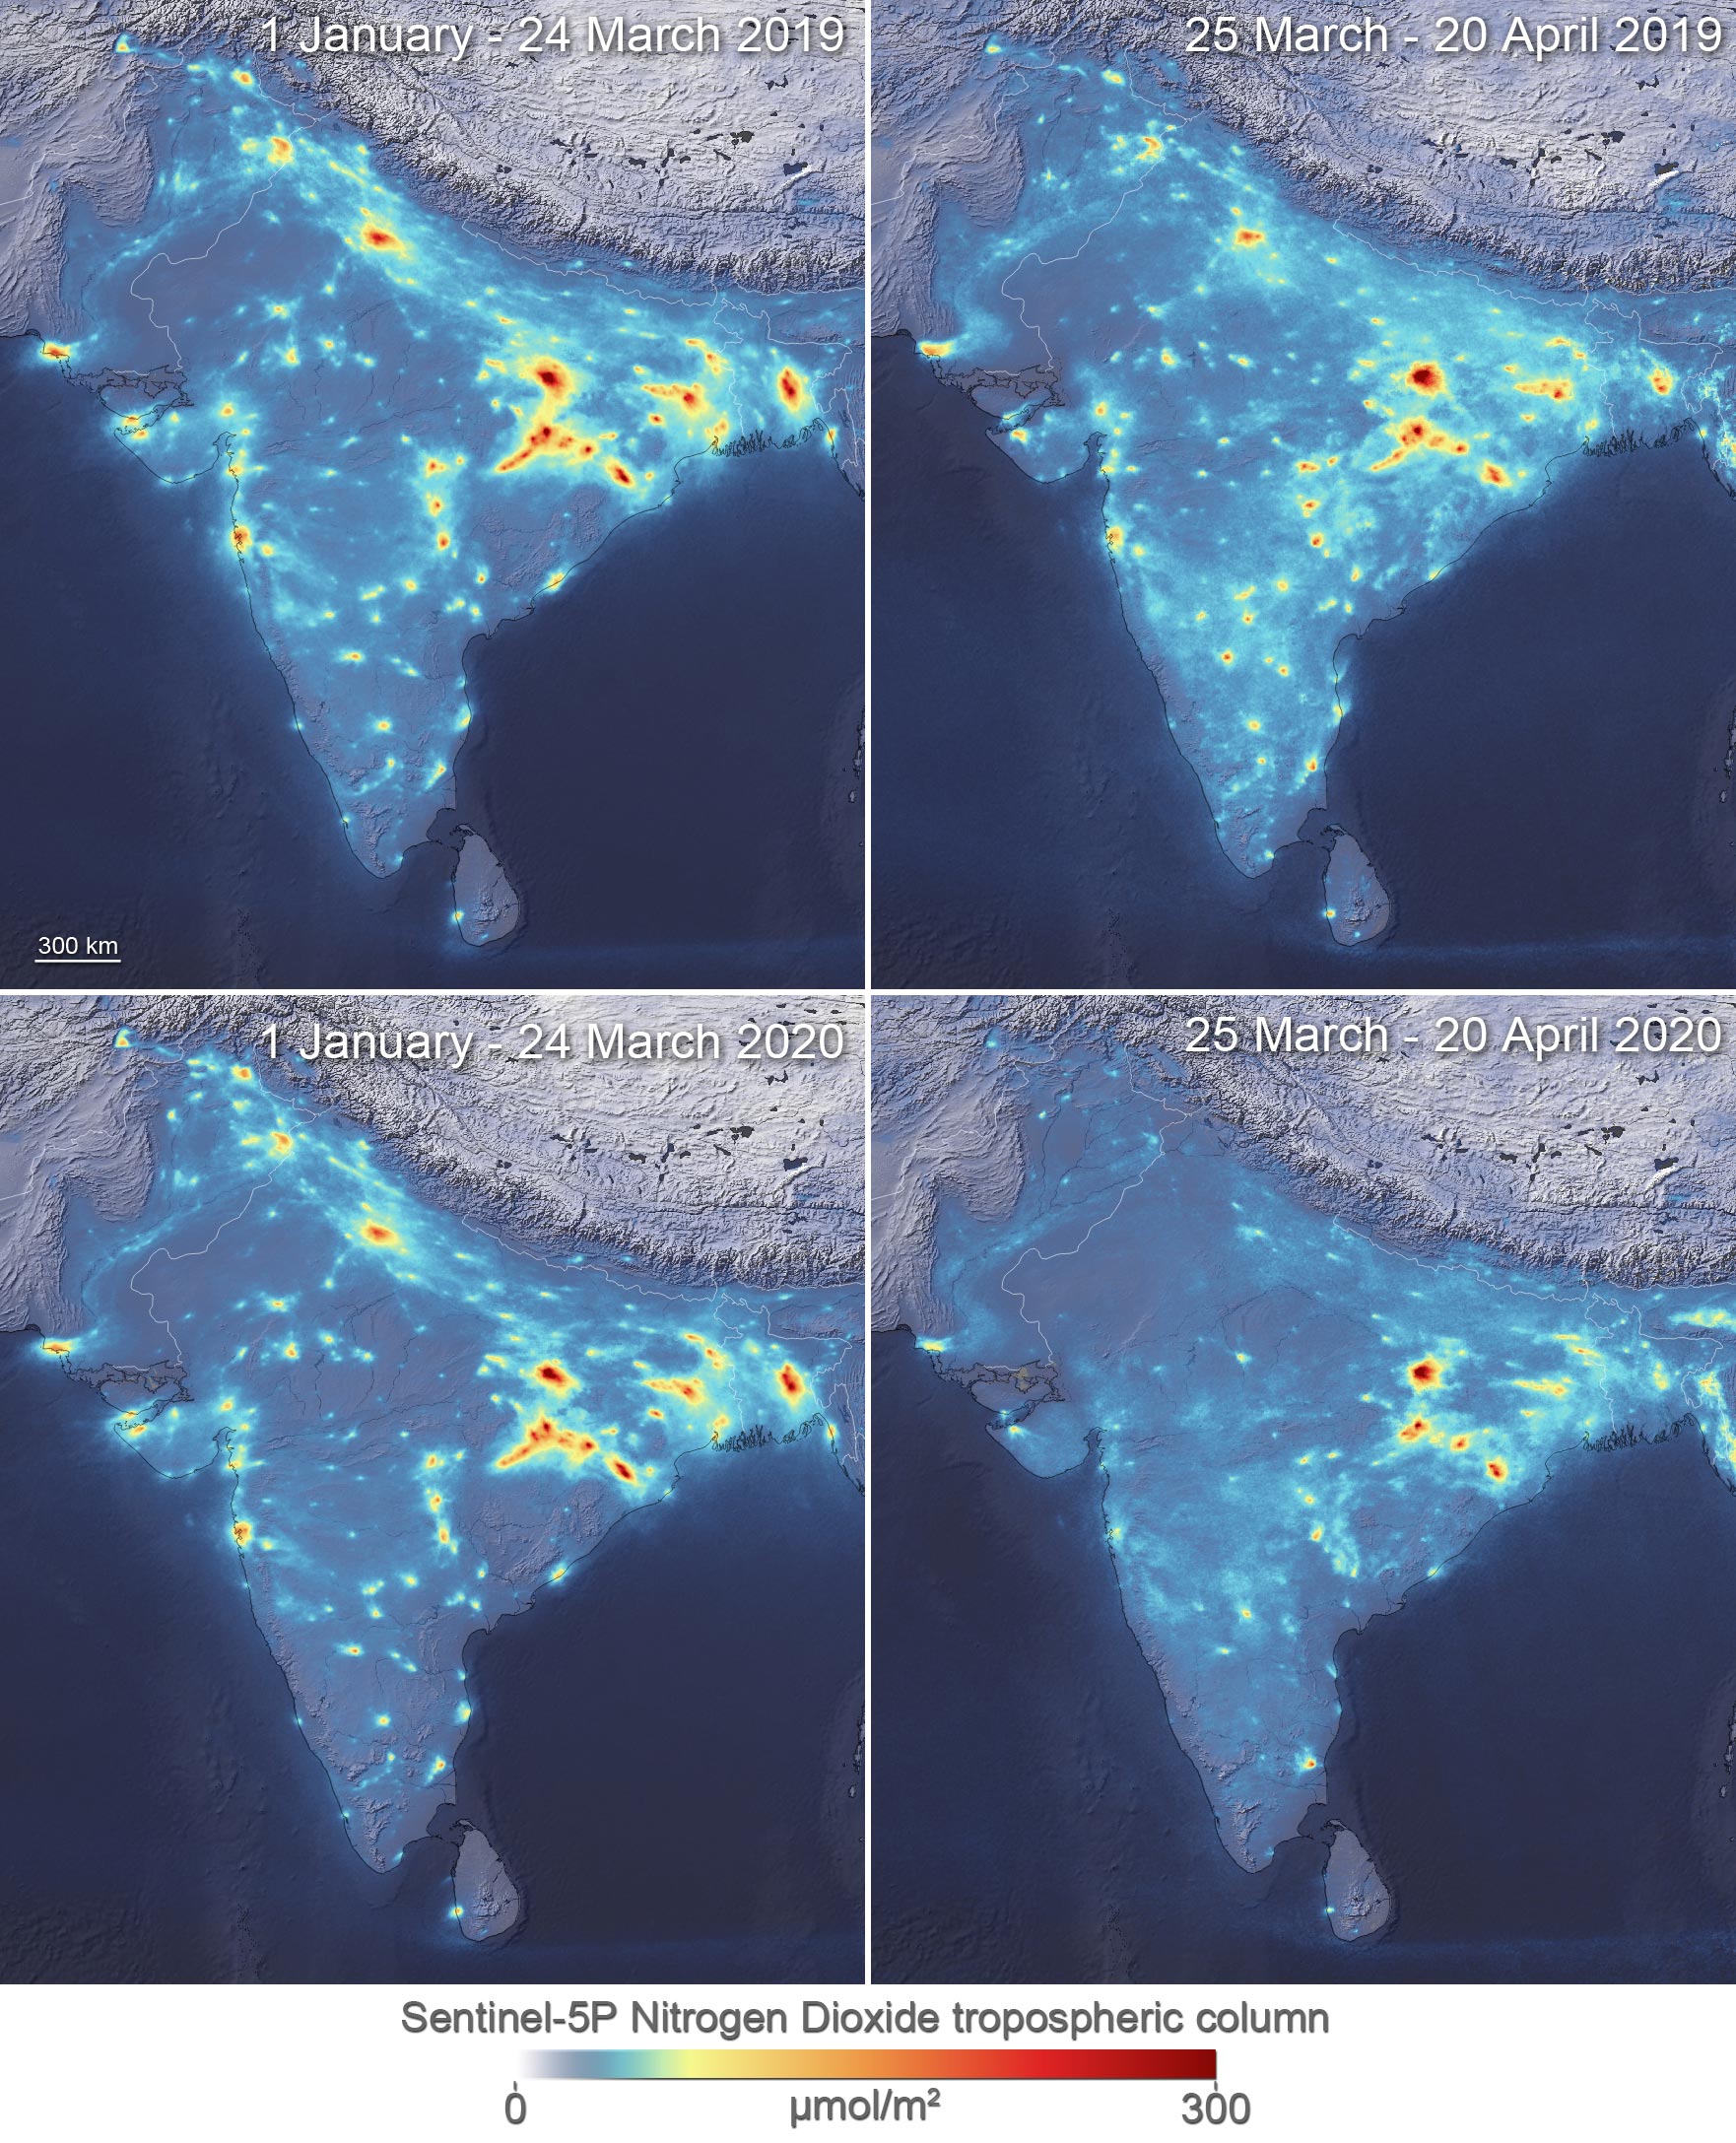
New satellite maps, produced using data from the Copernicus Sentinel-5P satellite, show averaged nitrogen dioxide concentrations over India from January 1 to March 24, 2020, and March 25 (the first day of the lockdown) to April 20, 2020 – compared to the same time-frame as last year.
The significant reduction in the concentrations can be seen over major cities across India. Mumbai and Delhi saw drops of around 40-50% compared to the same time last year.
Claus Zehner, ESA’s Copernicus Sentinel-5P mission manager, says, “Thanks to the Tropomi instrument on the Copernicus Sentinel-5P satellite, we are able to observe such high reductions in concentrations in Europe, China, and now India because of the national quarantine measures put in place.
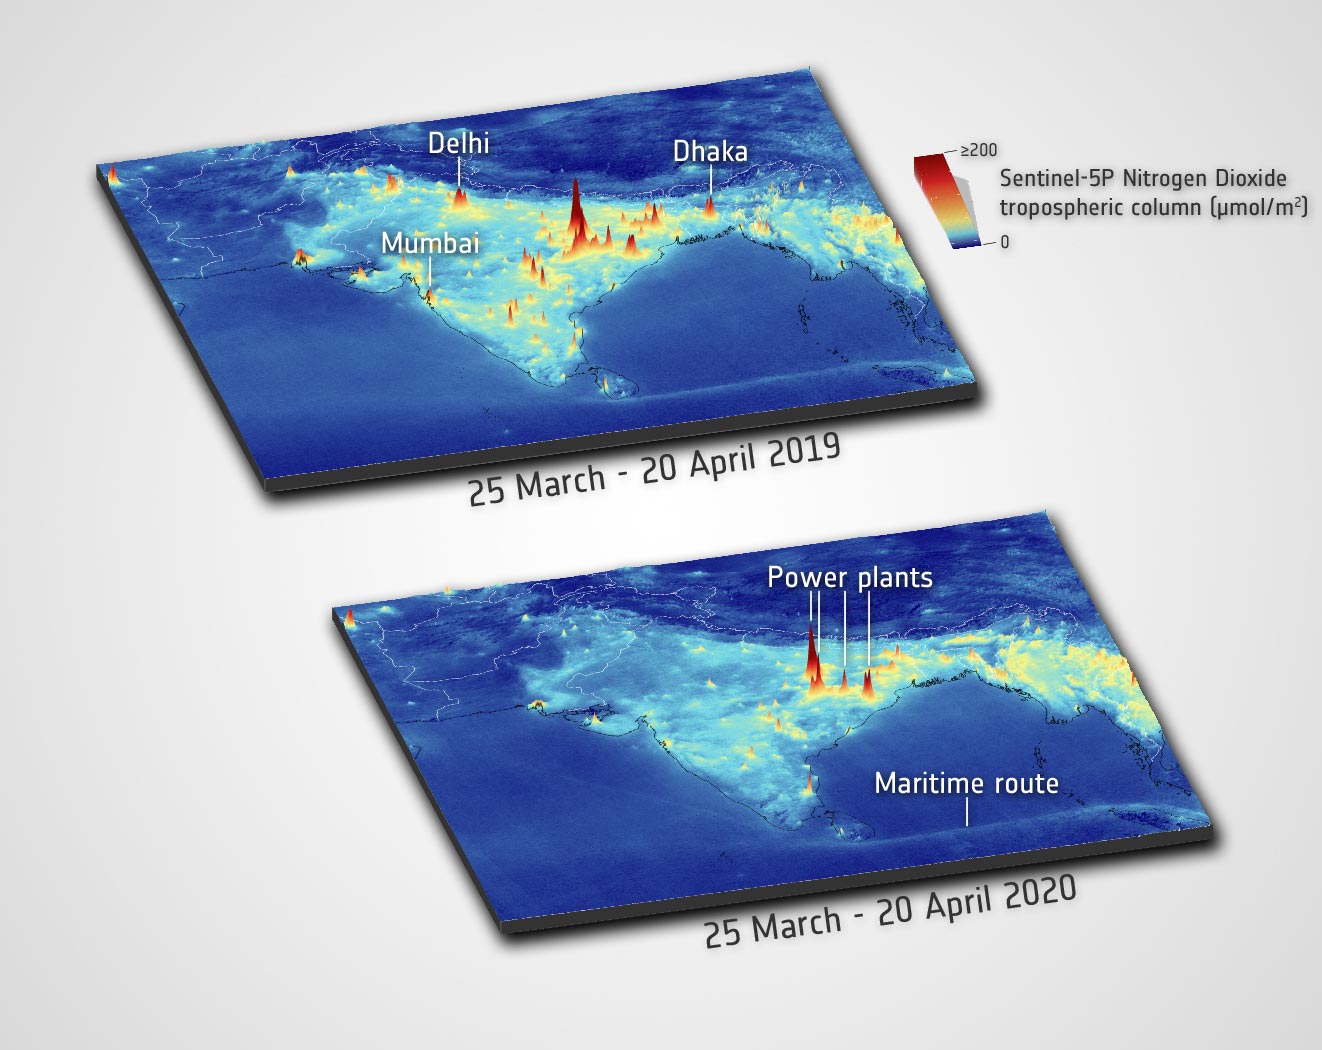
“What is interesting in these new maps are the high values of nitrogen dioxide concentrations over northeast India. Our analysis shows that these clusters are directly linked with the locations of the ongoing coal-based power plants. The largest power station in India, the Vindhyachal Super Thermal Power Station, shows a reduction of only around 15% compared to the same time last year.”
According to a recent report by Reuters, India’s electricity consumption fell by 9.2% in March 2020. Using data from the Power System Operation Corp Ltd (POSOCO), they found that consumers used 100.2 billion kilowatt hours (kWh) in March 2020, compared with 110.33 billion units from 2019.
ESA’s Director of Earth Observation Programmes, Josef Aschbacher, comments, “Another interesting feature we can see from these images is the maritime traffic across the Indian Ocean. We can clearly see a faint trail of nitrogen dioxide emissions left in the atmosphere as commercial ship traffic appears almost the same as last year. The shipping lanes appear as a straight line because the ships follow more or less the exact same route.”
Nitrogen dioxide is usually emitted into the atmosphere as a result from power plants, industrial facilities and vehicles – increasing the likelihood of developing respiratory problems. Because concentrations in our atmosphere vary widely on a daily basis, it is necessary to analyze data over substantial periods of time – allowing for more accurate assessments to be made.
Claus comments, “Weather variability is an important factor to consider when making assessments such as these, which is why our team has averaged the data over a longer period of time. In this case, we can clearly see the decreased concentrations are due to human activity.”
Air pollution is a major environmental health problem that affects people in developed and developing countries alike. According to the World Health Organization (WHO), air pollution kills an estimated seven million people worldwide each year.
According to a report using data from the World Air Quality Report from IQAir, Indian cities make up six of the world’s ten most-polluted urban areas. Air pollution in New Delhi, considered the world’s most polluted city, is caused by fumes from sclerotic traffic, the burning of fossil fuels, as well as industrial activity.
Josef Aschbacher, says, “It has never been more important to monitor the air we breathe. As we have seen over the previous months, the Copernicus Sentinel-5P satellite is the best satellite equipped to monitor nitrogen dioxide concentrations on a global scale”
With more than 23,000 reported cases of coronavirus across the country, India’s Prime Minister Narendra Modi has extended the nationwide lockdown until at least May 3.
The Copernicus Sentinels are a fleet of dedicated EU-owned satellites, designed to deliver the wealth of data and imagery that are central to the European Union’s Copernicus environmental program. The European Commission leads and coordinates this program, to improve the management of the environment, safeguarding lives every day. ESA is in charge of the space component, responsible for developing the family of Copernicus Sentinel satellites on behalf of the European Union and ensuring the flow of data for the Copernicus services, while the operations of the Copernicus Sentinels have been entrusted to ESA and EUMETSAT.
Images: Contain modified Copernicus Sentinel data (2019-20), processed by ESA, CC BY-SA 3.0 IGO
Never miss a breakthrough: Join the SciTechDaily newsletter.
Follow us on Google and Google News.
1 Comment
I love irony. The COVD pandemic may save more lives through reduced air pollution than it kills directly- including old people with chronic lung problems.