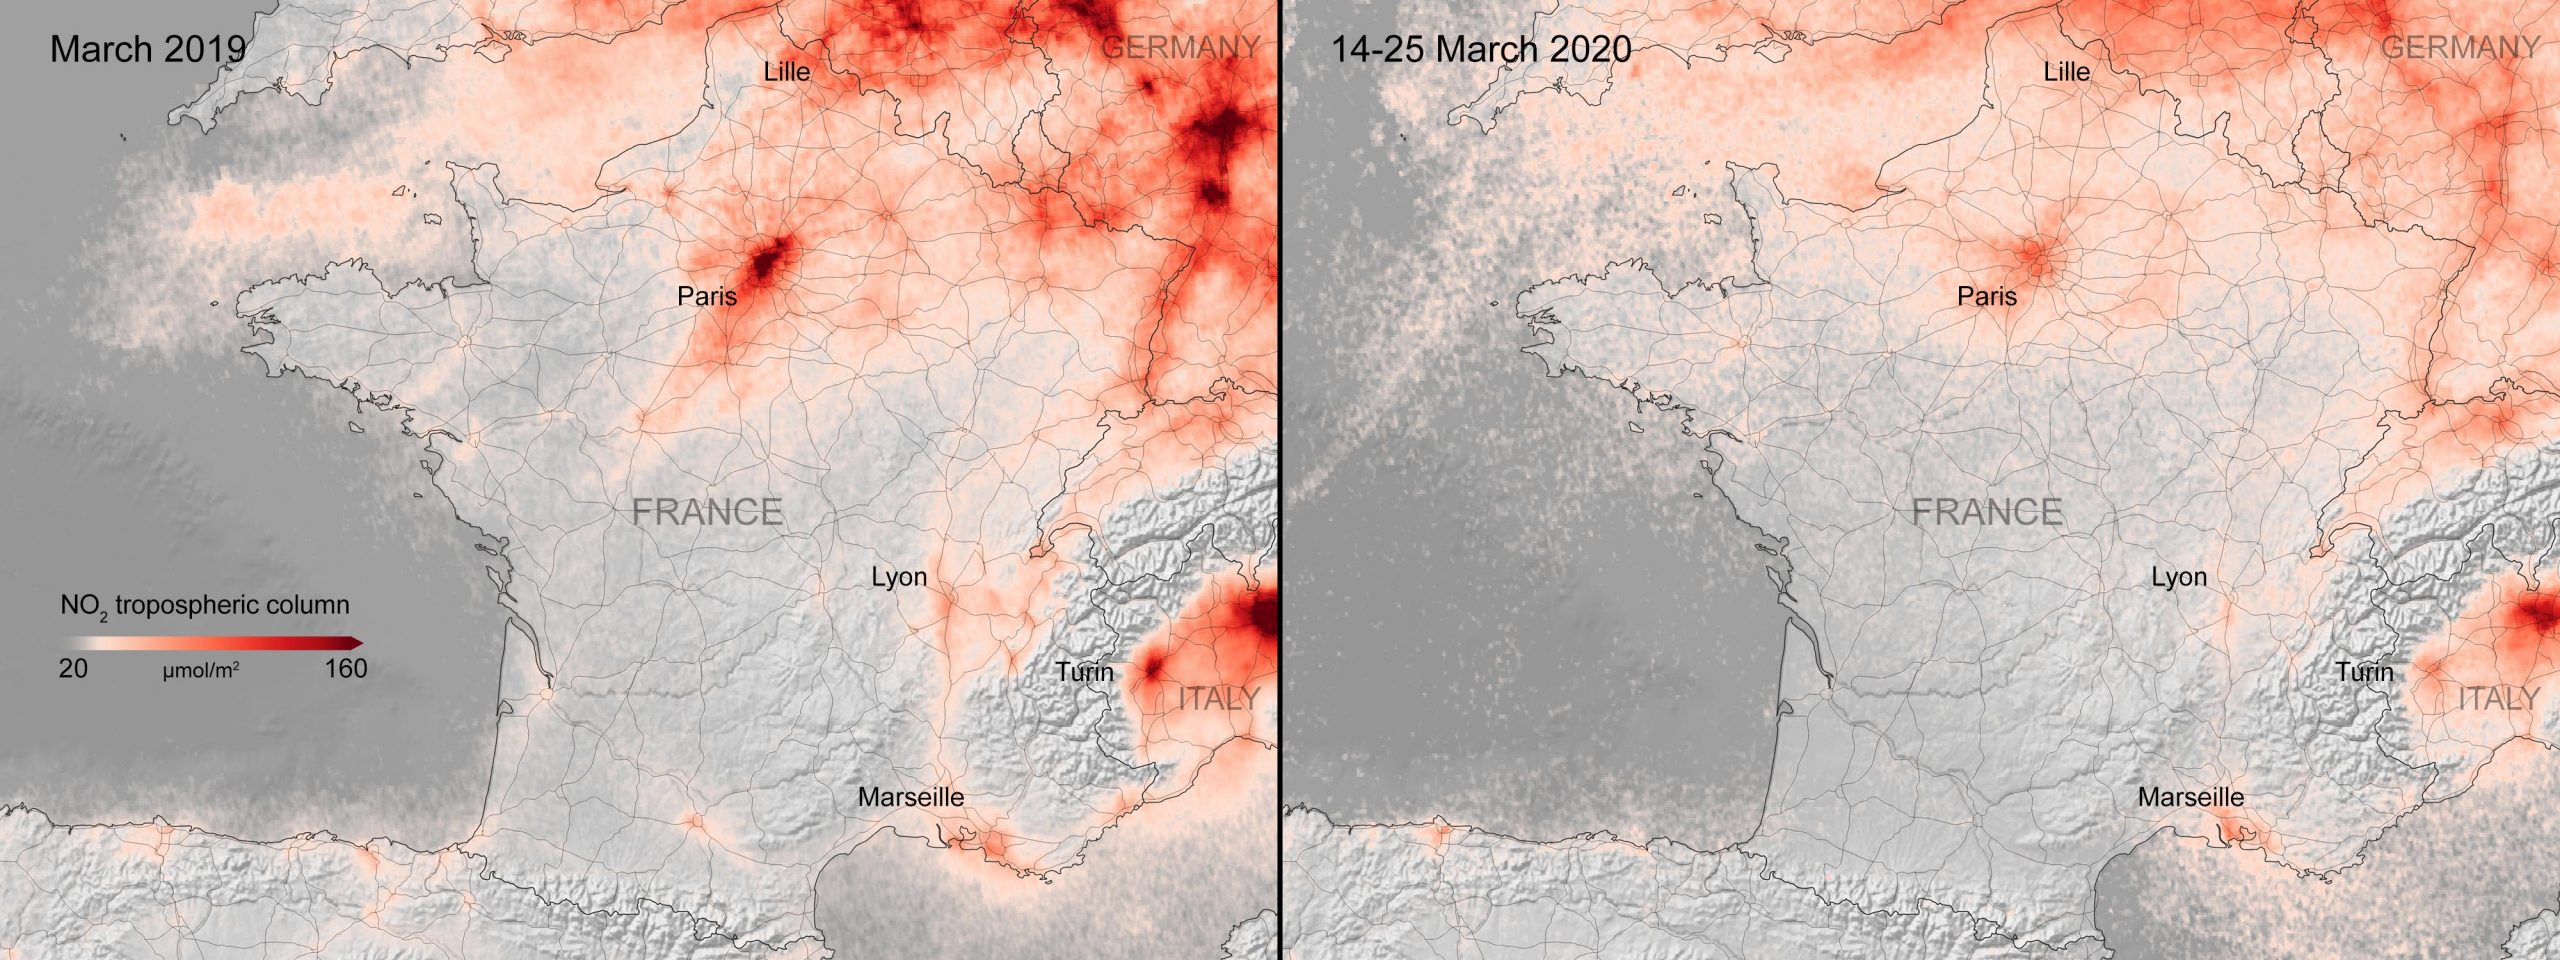
New data, based on observations from the Copernicus Sentinel-5P satellite, are showing strong reductions in nitrogen dioxide concentrations over several major cities across Europe – including Paris, Madrid and Rome.
The coronavirus disease (COVID-19) has been spreading rapidly across the world – affecting 170 countries with more than 530,000 confirmed cases worldwide. The coronavirus outbreak was declared a global pandemic by the World Health Organisation, and has since stated that the disease is ‘accelerating’.
In order to curb the spread of the COVID-19 outbreak, countries across the world are implementing strict measures – placing cities and even entire countries on lockdown.
The Copernicus Sentinel-5P satellite has recently mapped air pollution across Europe and China and has revealed a significant drop in nitrogen dioxide concentrations – coinciding with the strict quarantine measures.
Scientists from the Royal Netherlands Meteorological Institute (KNMI) have been using data from Copernicus Sentinel-5P satellite to monitor both weather and pollution over Europe.
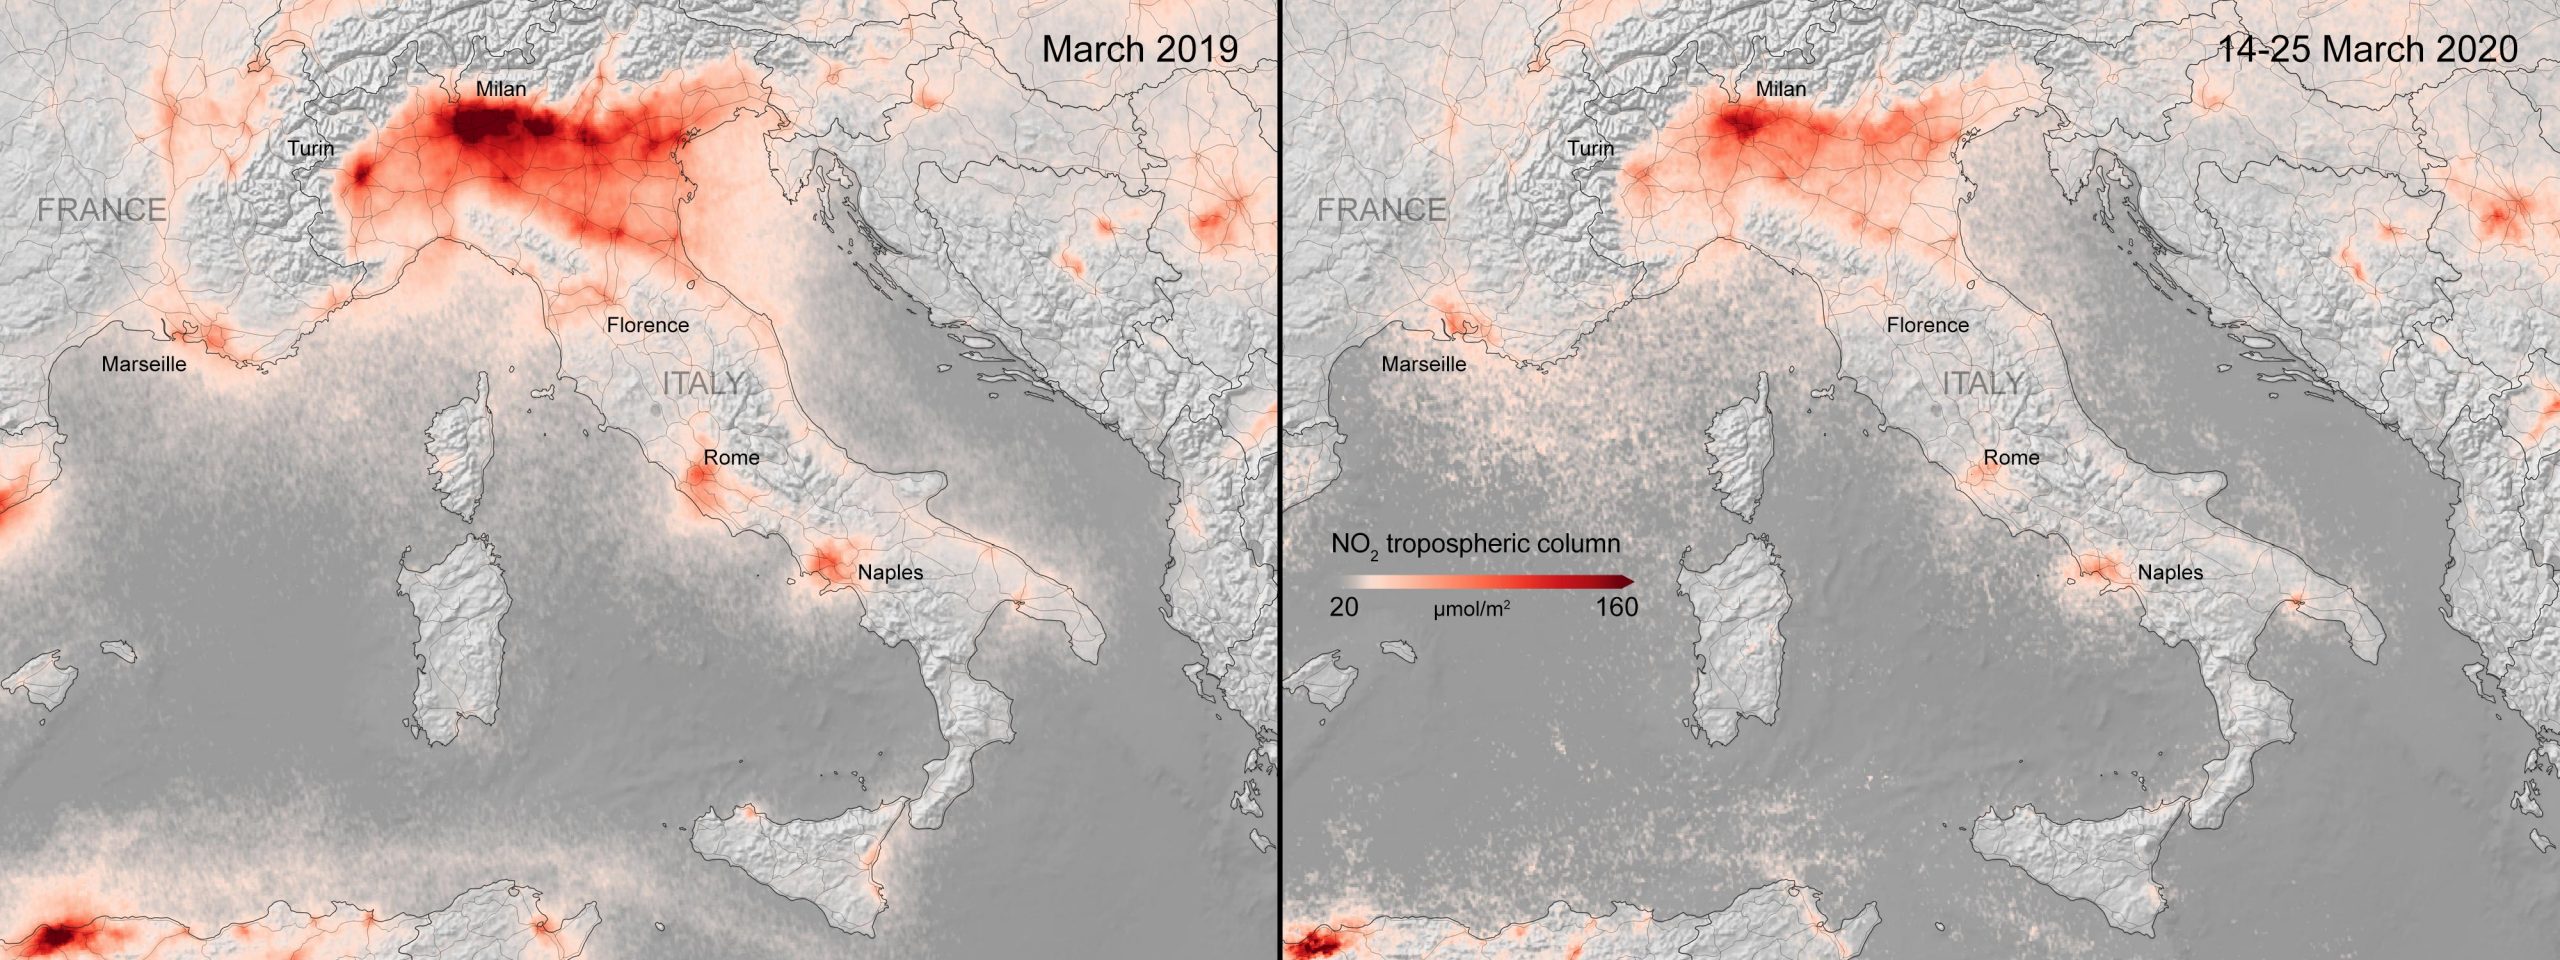
The new images clearly illustrate a strong reduction of nitrogen dioxide concentrations over major cities across Europe – specifically Milan, Paris, and Madrid.
The satellite images show nitrogen dioxide concentrations from March 14 to 25, 2020, compared to the monthly average of concentrations from 2019.
Henk Eskes, from KNMI, explains why these dates were chosen, “The nitrogen dioxide concentrations vary from day to day due to changes in the weather. Conclusions cannot be drawn based on just one day of data alone.
He continues, “By combining data for a specific period of time, 10 days in this case, the meteorological variability partly averages out and we begin to see the impact of changes due to human activity.”
“The chemistry in our atmosphere is non-linear. Therefore, the percentage drop in concentrations may differ somewhat from the drop in emissions. Atmospheric chemistry models, which account for daily changes in weather, in combination with inverse modeling techniques are needed to quantify the emission based on the satellite observations.”
The KNMI team, in collaboration with scientists worldwide, have started to work on a more detailed analysis using ground data, weather data and inverse modeling to interpret the concentrations observed, in order to estimate the influence of the shutdown measures.
Henk comments, “For quantitative estimates of the changes in the emissions due to transportation and industry, we need to combine the Tropomi data from the Copernicus Sentinel-5P satellite with models of atmospheric chemistry. These studies have started, but will take some time to complete.”
Other countries in northern Europe are being closely monitored, including the Netherlands and the United Kingdom – but scientists have observed a larger variability owing to changing weather conditions. New measurements from this week will help to assess the changes in nitrogen dioxide over northwest Europe.
Claus Zehner, ESA’s Copernicus Sentinel-5P mission manager, says, “The special features of the Copernicus Sentinel-5P satellite, with its high spatial resolution and accurate ability to observe trace gases compared to other atmospheric satellite missions, allows for the generation of these unique nitrogen dioxide concentration measurements from space.”
ESA’s Director of Earth Observation Programmes, Josef Aschbacher, says, “The long-term cooperation between ESA and KNMI proves very valuable and shows the importance of complementary analyses by different partner organizations. As we can see, the Copernicus Sentinel-5P satellite is the best satellite equipped to monitor nitrogen dioxide concentrations on a global scale.”
Never miss a breakthrough: Join the SciTechDaily newsletter.
Follow us on Google and Google News.
1 Comment
And the airline industry says …