Close Menu
    Facebook X (Twitter) Instagram
    SciTechDaily
    • Biology
    • Chemistry
    • Earth
    • Health
    • Physics
    • Science
    • Space
    • Technology
    Facebook X (Twitter) Pinterest YouTube RSS
    SciTechDaily
    Home»Earth»Dramatic Satellite Images Show Air Pollution Remains Low as Europeans Stay at Home
    Earth

    Dramatic Satellite Images Show Air Pollution Remains Low as Europeans Stay at Home

    By European Space AgencyApril 16, 20201 Comment4 Mins Read
    Facebook Twitter Pinterest Telegram LinkedIn WhatsApp Email Reddit
    Share
    Facebook Twitter LinkedIn Pinterest Telegram Email Reddit
    NO2 Concentrations Over Europe March April 2020
    These images, using data from the Copernicus Sentinel-5P satellite, show the average nitrogen dioxide concentrations from  March 13 to April 13, 2020, compared to the March-April averaged concentrations from 2019. The percentage decrease is derived over selected cities in Europe and has an uncertainty of around 15% owing to weather differences between 2019 and 2020. Credit: contains modified Copernicus Sentinel data (2019-20), processed by KNMI/ESA

    Further analyses are showing the continued low levels of nitrogen dioxide concentrations across Europe – coinciding with lockdown measures implemented to stop the spread of the coronavirus. New data from the Copernicus Sentinel-5P satellite, from the European Union Copernicus program, show some cities seeing levels fall by 45—50% compared to the same period last year.

    Scientists from the Royal Netherlands Meteorological Institute (KNMI) have been monitoring air pollution over Europe in the past months using data from the Tropomi instrument from the Copernicus Sentinel-5P satellite.

    NO2 Concentrations Over Europe March April 2019
    This image, using data from the Copernicus Sentinel-5P satellite, shows the average nitrogen dioxide concentrations from March 13 to April 13, 2019. Compare it with the image below and the March-April averaged concentrations from 2020. Credit: Contains modified Copernicus Sentinel data (2019-20), processed by KNMI/ESA

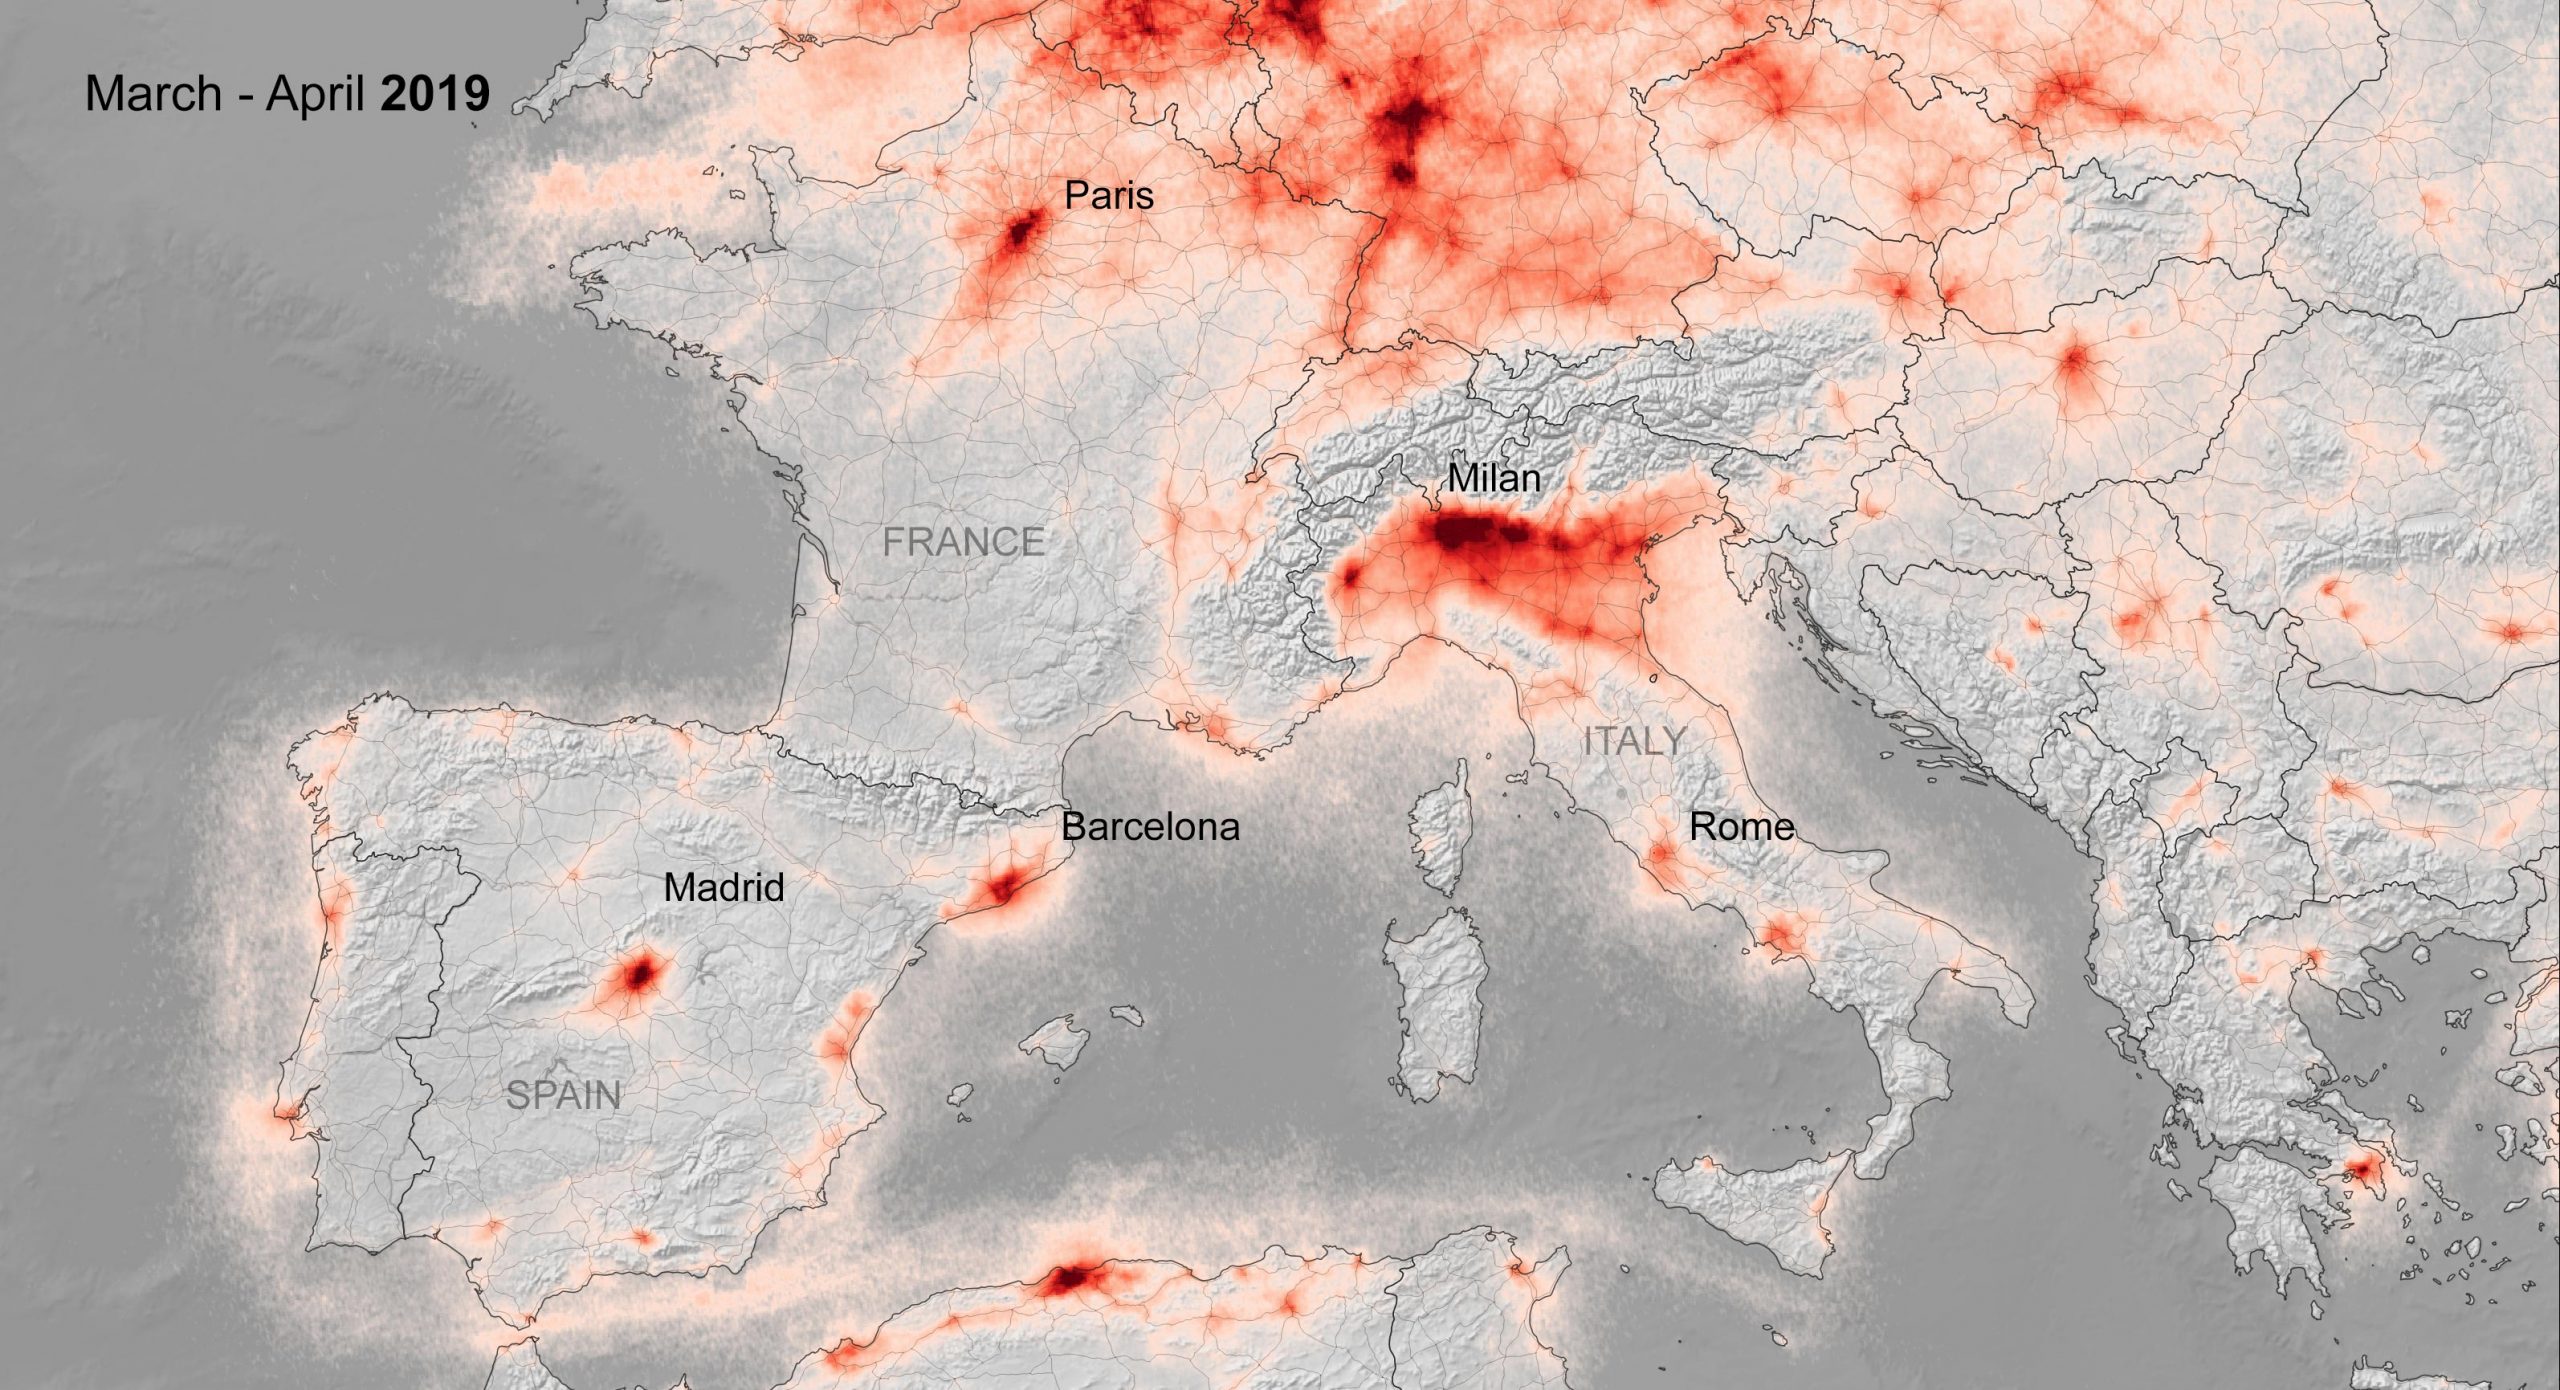
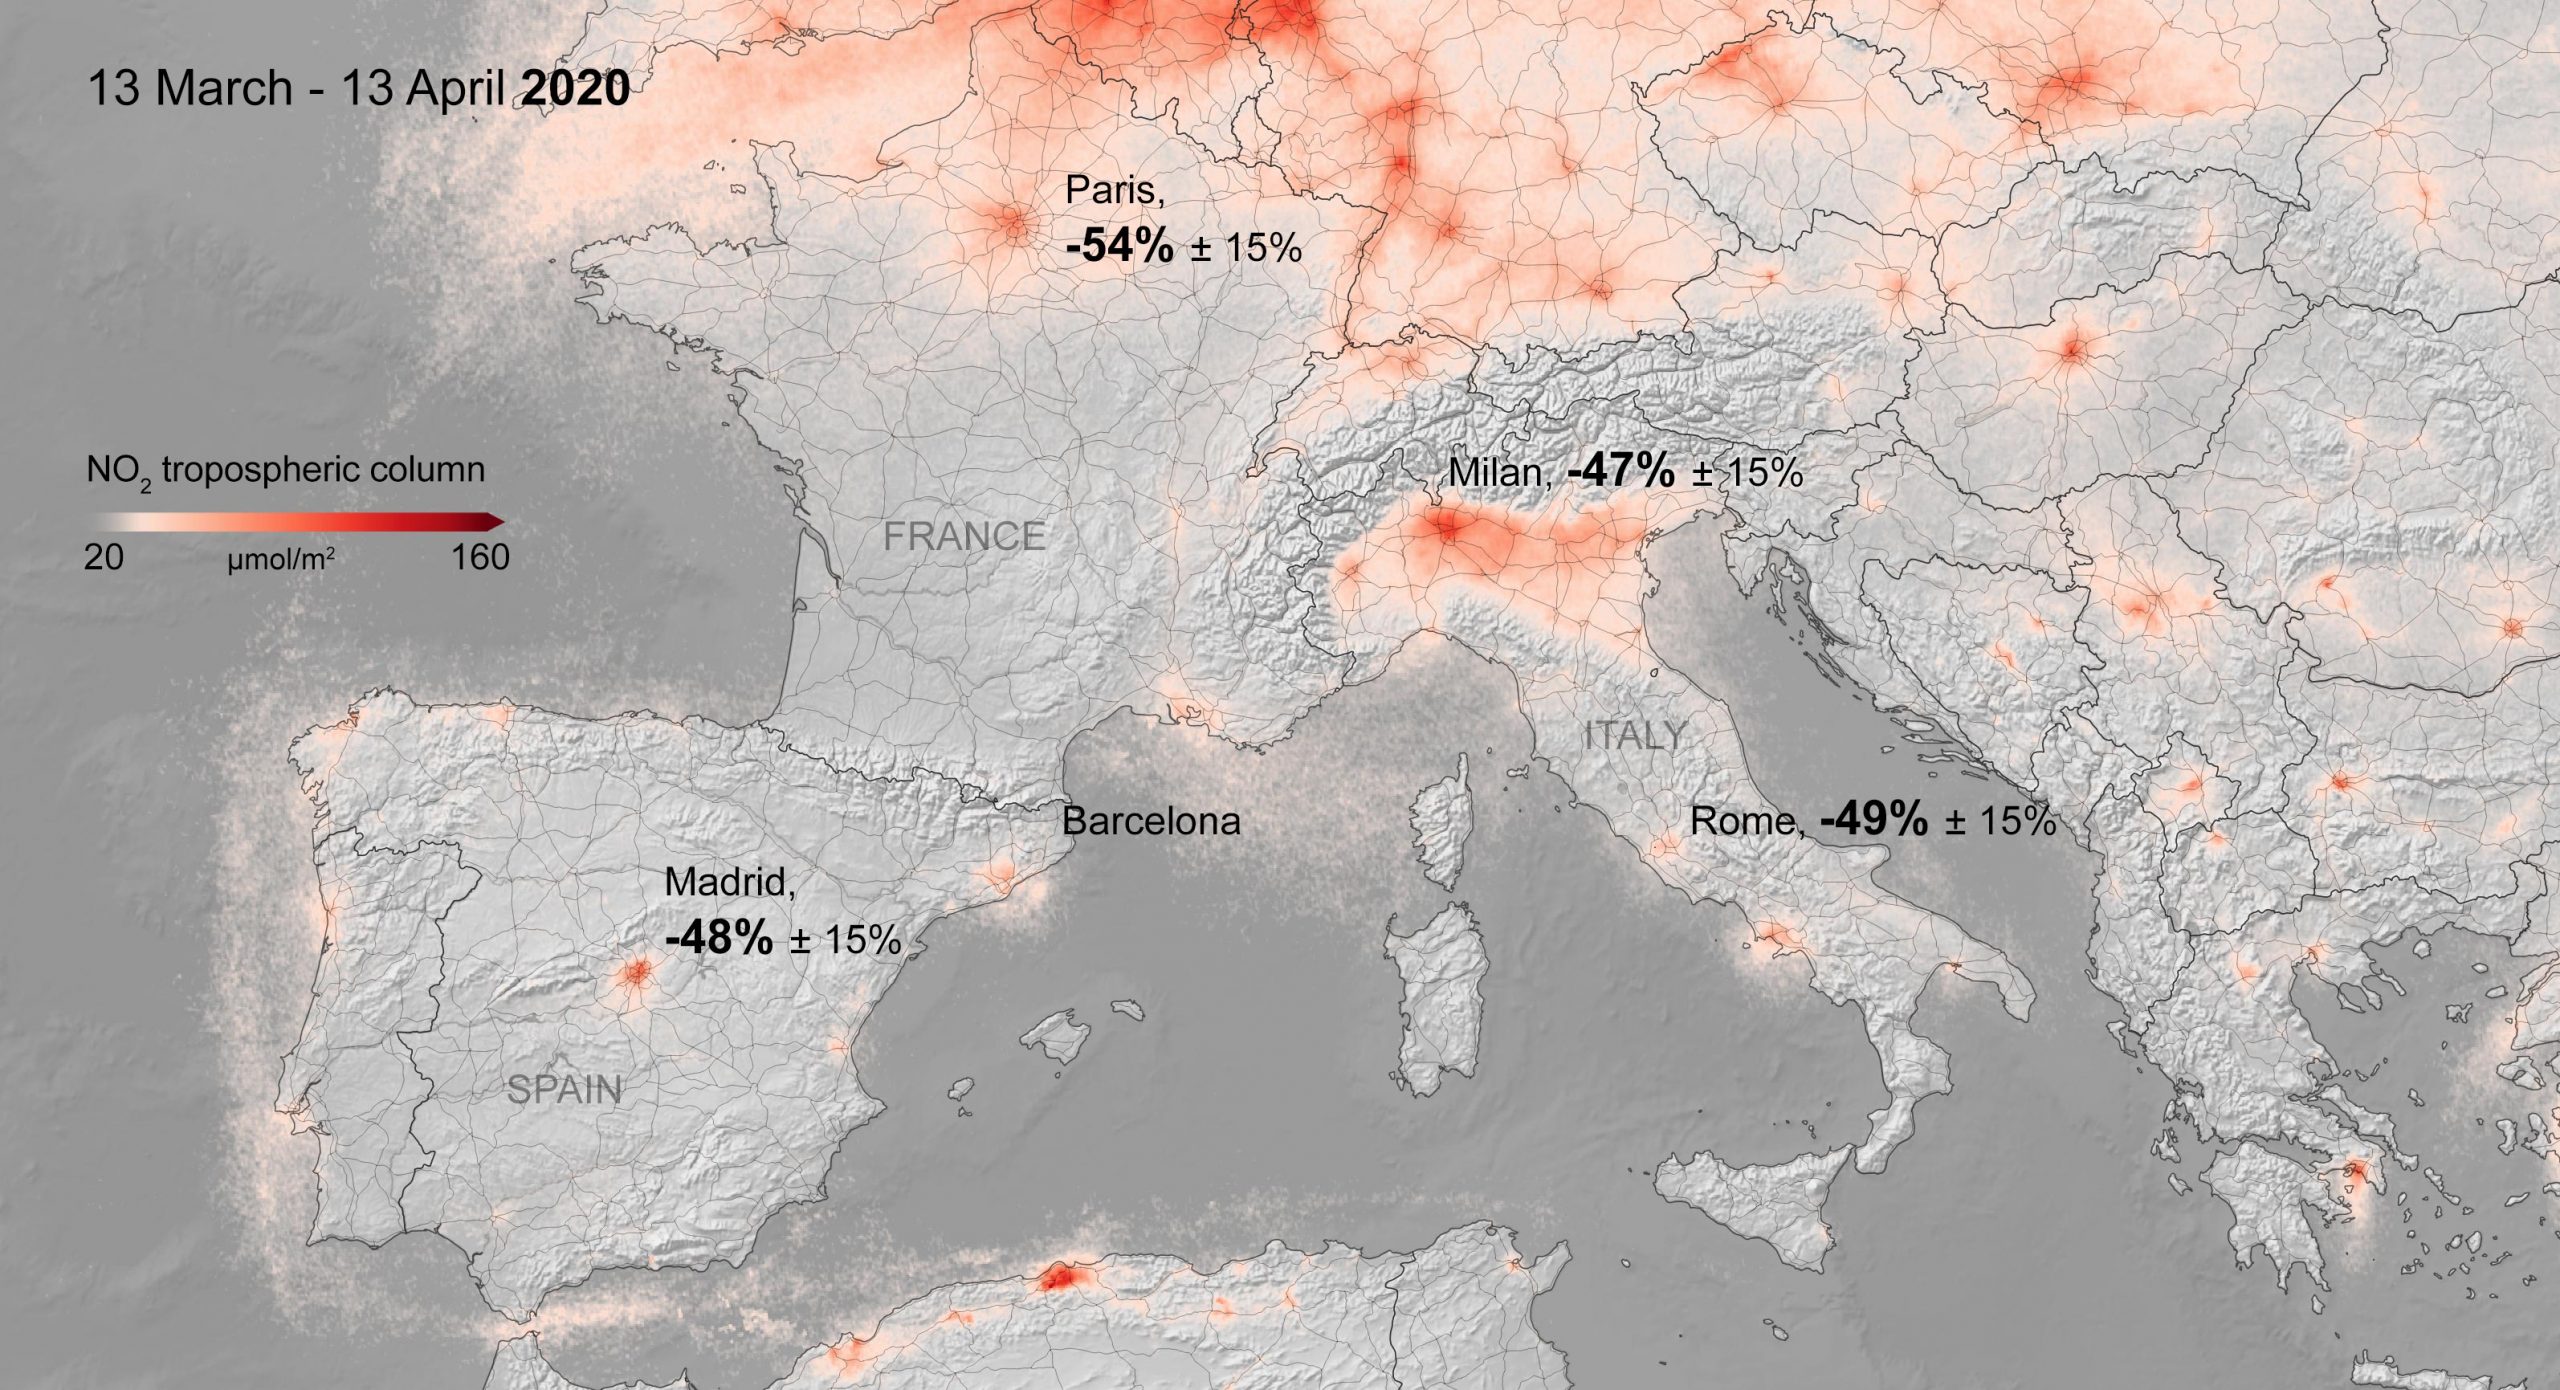
    The new images show the nitrogen dioxide concentrations from March 13 until April 13, 2020, compared to the March-April averaged concentrations from 2019. Madrid, Milan, and Rome saw decreases of around 45%, while Paris saw a dramatic drop of 54% – coinciding with the strict quarantine measures implemented across Europe.

    Nitrogen dioxide is produced from power plants, vehicles and other industrial facilities and can have significant impacts on human health – increasing the likelihood of developing respiratory problems. Nitrogen dioxide concentrations in our atmosphere vary widely day to day owing to the fluctuations of emissions, as well as variations in weather conditions.

    NO2 Concentrations Over Europe March April 2020
    This image, using data from the Copernicus Sentinel-5P satellite, shows the average nitrogen dioxide concentrations from March 13 to April 13, 2019. Compare it with the image above and the March-April averaged concentrations from 2019. The percentage decrease is derived over selected cities in Europe and has an uncertainty of around 15% owing to weather differences between 2019 and 2020. Credit: Contains modified Copernicus Sentinel data (2019-20), processed by KNMI/ESA

    This weather-induced variability proves difficult to draw conclusions based only on daily or weekly measurements, making it necessary to analyze data over a substantial period of time to iron out any anomalies.

    Henk Eskes, from the Royal Netherlands Meteorological Institute (KNMI), comments, “There are considerable variations of weather in every country from one day to the next, creating a large impact on the dispersion of nitrogen dioxide.

    “Averaging data over longer periods of time allows us to see clearer changes in concentrations owing to human activity. For this reason, the maps show concentrations over a monthly period and are provided with an uncertainty of 15% which reflects weather variability not accounted for in the monthly averages used.”

    As lockdown measures will continue in the following weeks, the KNMI team will continue to work on a more detailed analysis of other countries in northern Europe, where a larger variability in data owing to changing weather conditions is observed.

    Making use of air-quality models, such as the Copernicus Atmosphere Monitoring Service, as well as combining results from in situ data, will narrow down the impact of changes in weather on air pollution estimates.

    About the Copernicus Sentinels

    The Copernicus Sentinels are a fleet of dedicated EU-owned satellites, designed to deliver the wealth of data and imagery that are central to the European Union’s Copernicus environmental program. The European Commission leads and coordinates this program, to improve the management of the environment, safeguarding lives every day. ESA is in charge of the space component, responsible for developing the family of Copernicus Sentinel satellites on behalf of the European Union and ensuring the flow of data for the Copernicus services, while the operations of the Copernicus Sentinels have been entrusted to ESA and EUMETSAT.

    Never miss a breakthrough: Join the SciTechDaily newsletter.
    Follow us on Google and Google News.

    COVID-19 European Space Agency Pollution
    Share. Facebook Twitter Pinterest LinkedIn Email Reddit

    Related Articles

    Air Pollution Over China Returning to Pre-COVID Levels

    Sulfur Dioxide Concentrations Drop 40% Over India During COVID-19

    COVID-19’s Remarkable Changes to the Environment Seen From Space [Video]

    Stunning Satellite Images Show Air Pollution Drop in India Following Coronavirus Lockdown

    Satellites Map the Global Flow of Oil – Demand Has Collapsed Due to the Coronavirus Pandemic

    Satellite Captures Stunning Drop in Pollution Across Europe From COVID-19 Lockdown

    Shocking Video Shows Dramatic Nitrogen Dioxide Drop Over China Due to COVID-19 Lockdown

    Jaw-Dropping Video Shows Nitrogen Dioxide Emissions Drop Over Italy Due to Coronavirus

    Aerosol Spread From Ferocious Australian Fires [Video]

    1 Comment

    1. Blaine Snow on April 16, 2020 11:17 am

      Duh… slow down human energy consumption and cumulative human waste follows. It’s simple physics. Not enough to slow climate change however. Any idiot can see that.

      Reply
    Leave A Reply Cancel Reply

    • Facebook
    • Twitter
    • Pinterest
    • YouTube

    Don't Miss a Discovery

    Subscribe for the Latest in Science & Tech!

    Trending News

    Your Blood Pressure Reading Could Be Wrong Because of One Simple Mistake

    Astronomers Stunned by Ancient Galaxy With No Spin

    Physicists May Be on the Verge of Discovering “New Physics” at CERN

    Scientists Solve 320-Million-Year Mystery of Reptile Skin Armor

    Scientists Say This Daily Walking Habit May Be the Secret to Keeping Weight Off After Dieting

    New Therapy Rewires the Brain To Restore Joy in Depression Patients

    Giant Squid Detected off Western Australia in Stunning Deep-Sea Discovery

    Popular Sugar-Free Sweetener Linked to Liver Disease, Study Warns

    Follow SciTechDaily
    • Facebook
    • Twitter
    • YouTube
    • Pinterest
    • Newsletter
    • RSS
    SciTech News
    • Biology News
    • Chemistry News
    • Earth News
    • Health News
    • Physics News
    • Science News
    • Space News
    • Technology News
    Recent Posts
    • A Crucial Atlantic Current Is Weakening and Weather Could Change Worldwide
    • Scientists Stunned As Volcano Removes Methane From the Air
    • Scientists Discover Signs Africa May Be Splitting Apart Beneath Zambia
    • New Stroke Study Challenges Decades-Old Medical Beliefs
    • These Simple Plant Foods Are Linked to Lower Blood Pressure
    Copyright © 1998 - 2026 SciTechDaily. All Rights Reserved.
    • Science News
    • About
    • Contact
    • Editorial Board
    • Privacy Policy
    • Terms of Use

    Type above and press Enter to search. Press Esc to cancel.