
U.S. Atlantic coast cities are sinking faster than the global sea level is rising, posing risks to infrastructure in densely populated areas like New York City and Baltimore. Virginia Tech and USGS studies highlight the urgency of addressing this issue.
Major cities on the U.S. Atlantic coast are sinking, in some cases as much as 5 millimeters per year – a decline at the ocean’s edge that well outpaces global sea level rise, confirms new research from Virginia Tech and the U.S. Geological Survey.
High-Risk Urban Areas
Particularly hard-hit population centers such as New York City and Long Island, Baltimore, and Virginia Beach and Norfolk are seeing areas of rapid “subsidence,” or sinking land, alongside more slowly sinking or relatively stable ground, increasing the risk to roadways, runways, building foundations, rail lines, and pipelines, according to a study published on January 2 in the Proceedings of the National Academies of Sciences.
Expert Insights on Infrastructure Impact
“Continuous unmitigated subsidence on the U.S. East Coast should cause concern,” said lead author Leonard Ohenhen, a graduate student working with Associate Professor Manoochehr Shirzaei at Virginia Tech’s Earth Observation and Innovation Lab. “This is particularly in areas with a high population and property density and a historical complacency toward infrastructure maintenance.”
Innovative Mapping Techniques and Findings
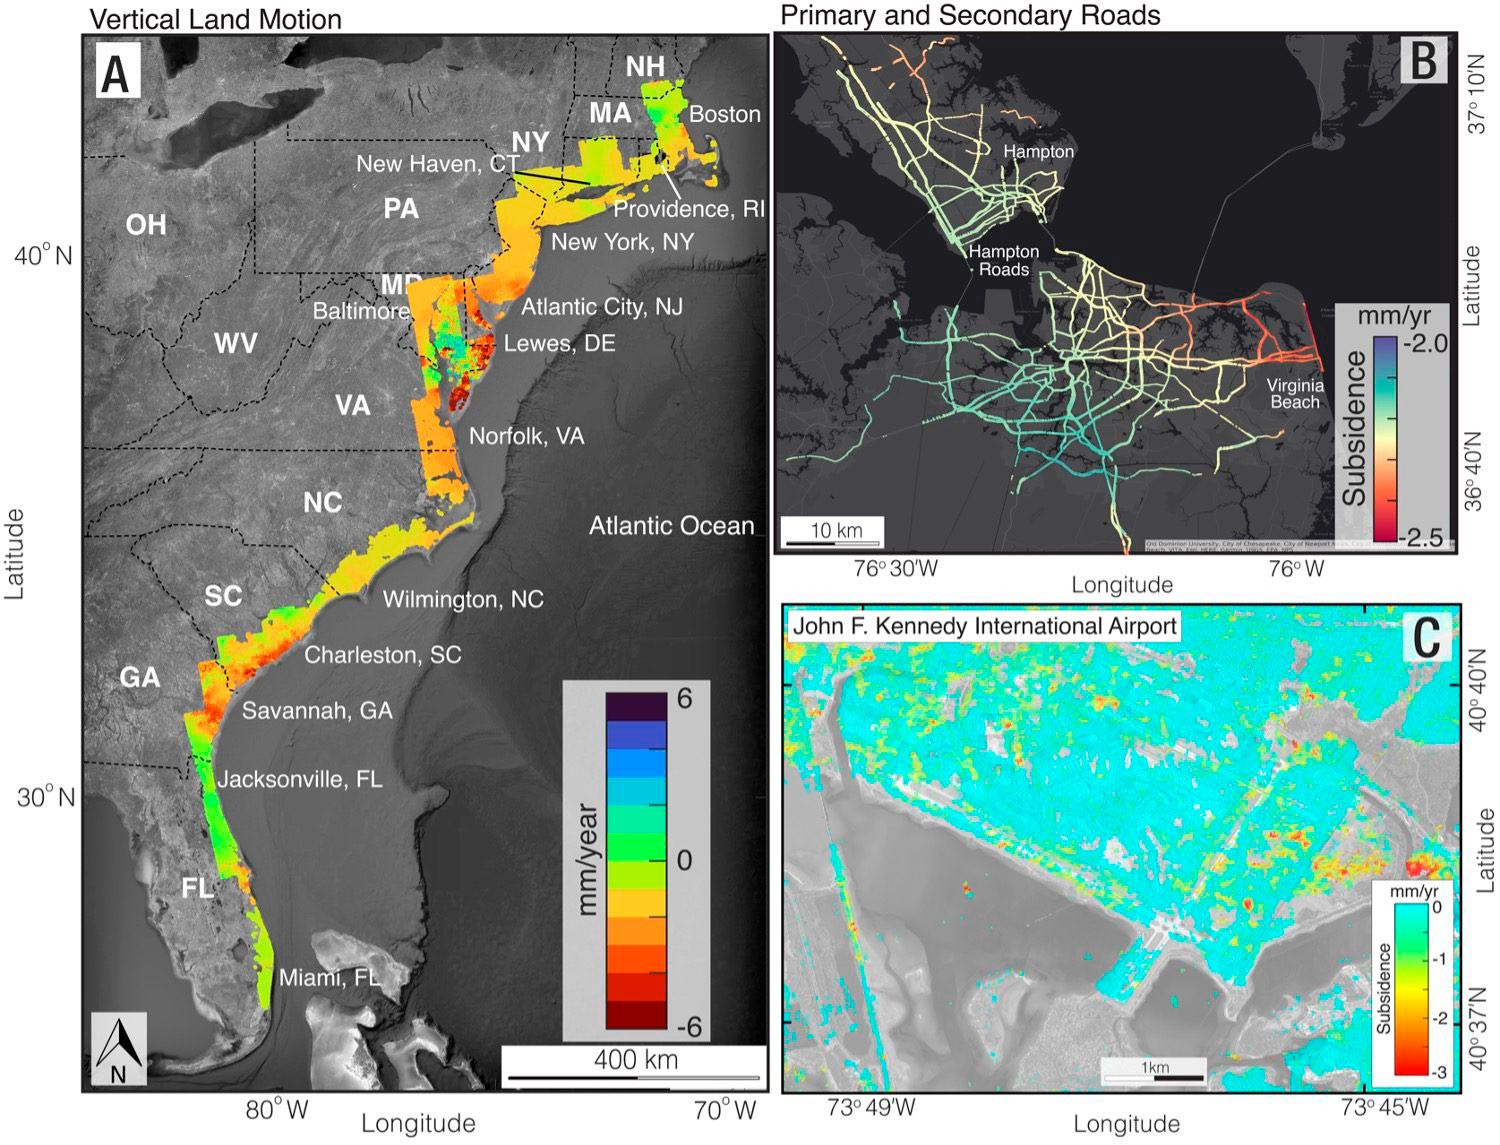
Shirzaei and his research team pulled together a vast collection of data points measured by space-based radar satellites and used this highly accurate information to build digital terrain maps that show exactly where sinking landscapes present risks to the health of vital infrastructure. Using the publicly available satellite imagery, Shirzaei and Ohenhen measured millions of occurrences of land subsidence spanning multiple years. They then created some of the world’s first high-resolution depictions of the land subsidence.
These groundbreaking new maps show that a large area of the East Coast is sinking at least 2 mm per year, with several areas along the mid-Atlantic coast of up to 3,700 square kilometers, or more than 1,400 square miles, sinking more than 5 mm per year, more than the current 4 mm per year global rate of sea level rise.
Widespread Implications of Subsidence
“We measured subsidence rates of 2 mm per year affecting more than 2 million people and 800,000 properties on the East Coast,” Shirzaei said. “We know to some extent that the land is sinking. Through this study, we highlight that sinking of the land is not an intangible threat. It affects you and I and everyone, it may be gradual, but the impacts are real.”
In several cities along the East Coast, multiple critical infrastructures such as roads, railways, airports, and levees are affected by differing subsidence rates.

“Here, the problem is not just that the land is sinking. The problem is that the hotspots of sinking land intersect directly with population and infrastructure hubs,” said Ohenhen. “For example, significant areas of critical infrastructure in New York, including JFK and LaGuardia airports and its runways, along with the railway systems, are affected by subsidence rates exceeding 2 mm per year. The effects of these right now and into the future are potential damage to infrastructure and increased flood risks.”
The Intersection of Subsidence and Infrastructure
The new findings appear in the open access journal PNAS Nexus. In the work “Slowly but surely: Exposure of communities and infrastructure to subsidence on the US east coast,” Virginia Tech and U.S. Geological Survey (USGS) scientists measured how much the land along the East Coast has sunk and which areas, populations, and critical infrastructure within 100 km of the coast are at risk of land subsidence. Subsidence can undermine building foundations; damage roads, gas, and water lines; cause building collapse; and exacerbate coastal flooding – especially when paired with sea level rise caused by climate change.
“This information is needed. No one else is providing it,” said Patrick Barnard, a research geologist with the USGS and co-author of the study. “Shirzaei and his Virginia Tech team stepped into that niche with his technical expertise and is providing something extremely valuable.”
Reference: “Slowly but surely: Exposure of communities and infrastructure to subsidence on the US east coast” by Leonard O Ohenhen, Manoochehr Shirzaei and Patrick L Barnard, 2 January 2024, PNAS Nexus.
DOI: 10.1093/pnasnexus/pgad426
Never miss a breakthrough: Join the SciTechDaily newsletter.
Follow us on Google and Google News.
10 Comments
5 mm = two tenths of an inch, for those panicking about “submerging skylines.” If we build a seawall at the rate of 1/2 inch per year, we will be able to contain the flood. LOL.
seawalls are horrible for the environment- figure out how to keep fresh water out of the ocean globally- not too hard & solves 2 problems
That’s easy, stop all rivers and rain.
When everyone gets excited about changing sea levels this is a lesson that local subsidence or elevation is occuring everywhere. There’s no stable sea level
Oh. No. We’re. All. Going. To. Die.
Part 6,478.
Let’s build a wall a few miles inland and don’t answer when the coastal elites start banging on the gates.
this is something that is going to become a study to me
The Army Corps of Engineers needs to start work NOW to protect the homes of the Uber wealthy on Fire Island, in the Hamptons, the Outer Banks, FL, HI & all of the beach homes on the west coast.
Taxpayers will have to poney up the ca$h to protect those properties.
Well for edification sake we need to irrigate the water in order that there will not be a overflowing plus limit the amount of skyscrapers which further put extra weight on the land crust causing the water to not receeds that must be quickly abrupt in order to reverse this trend here!!!
“…, more than the current 4 mm per year global rate of sea level rise.”
The NOAA website (Laboratory for Satellite Altimetry) has a graph showing the radar altimetry for the various satellites that have been launched. The most recent, Jason 3, shows what appears to be less than 2mm/yr for the most recent measurements. The long-term trend for all the satellites since 1992 has a calculated trend of 3.3 +/-0.4 mm/yr. The stated “4 mm per year” is 100% larger than the apparent change from Jason 3.