What Is the Electromagnetic Spectrum?
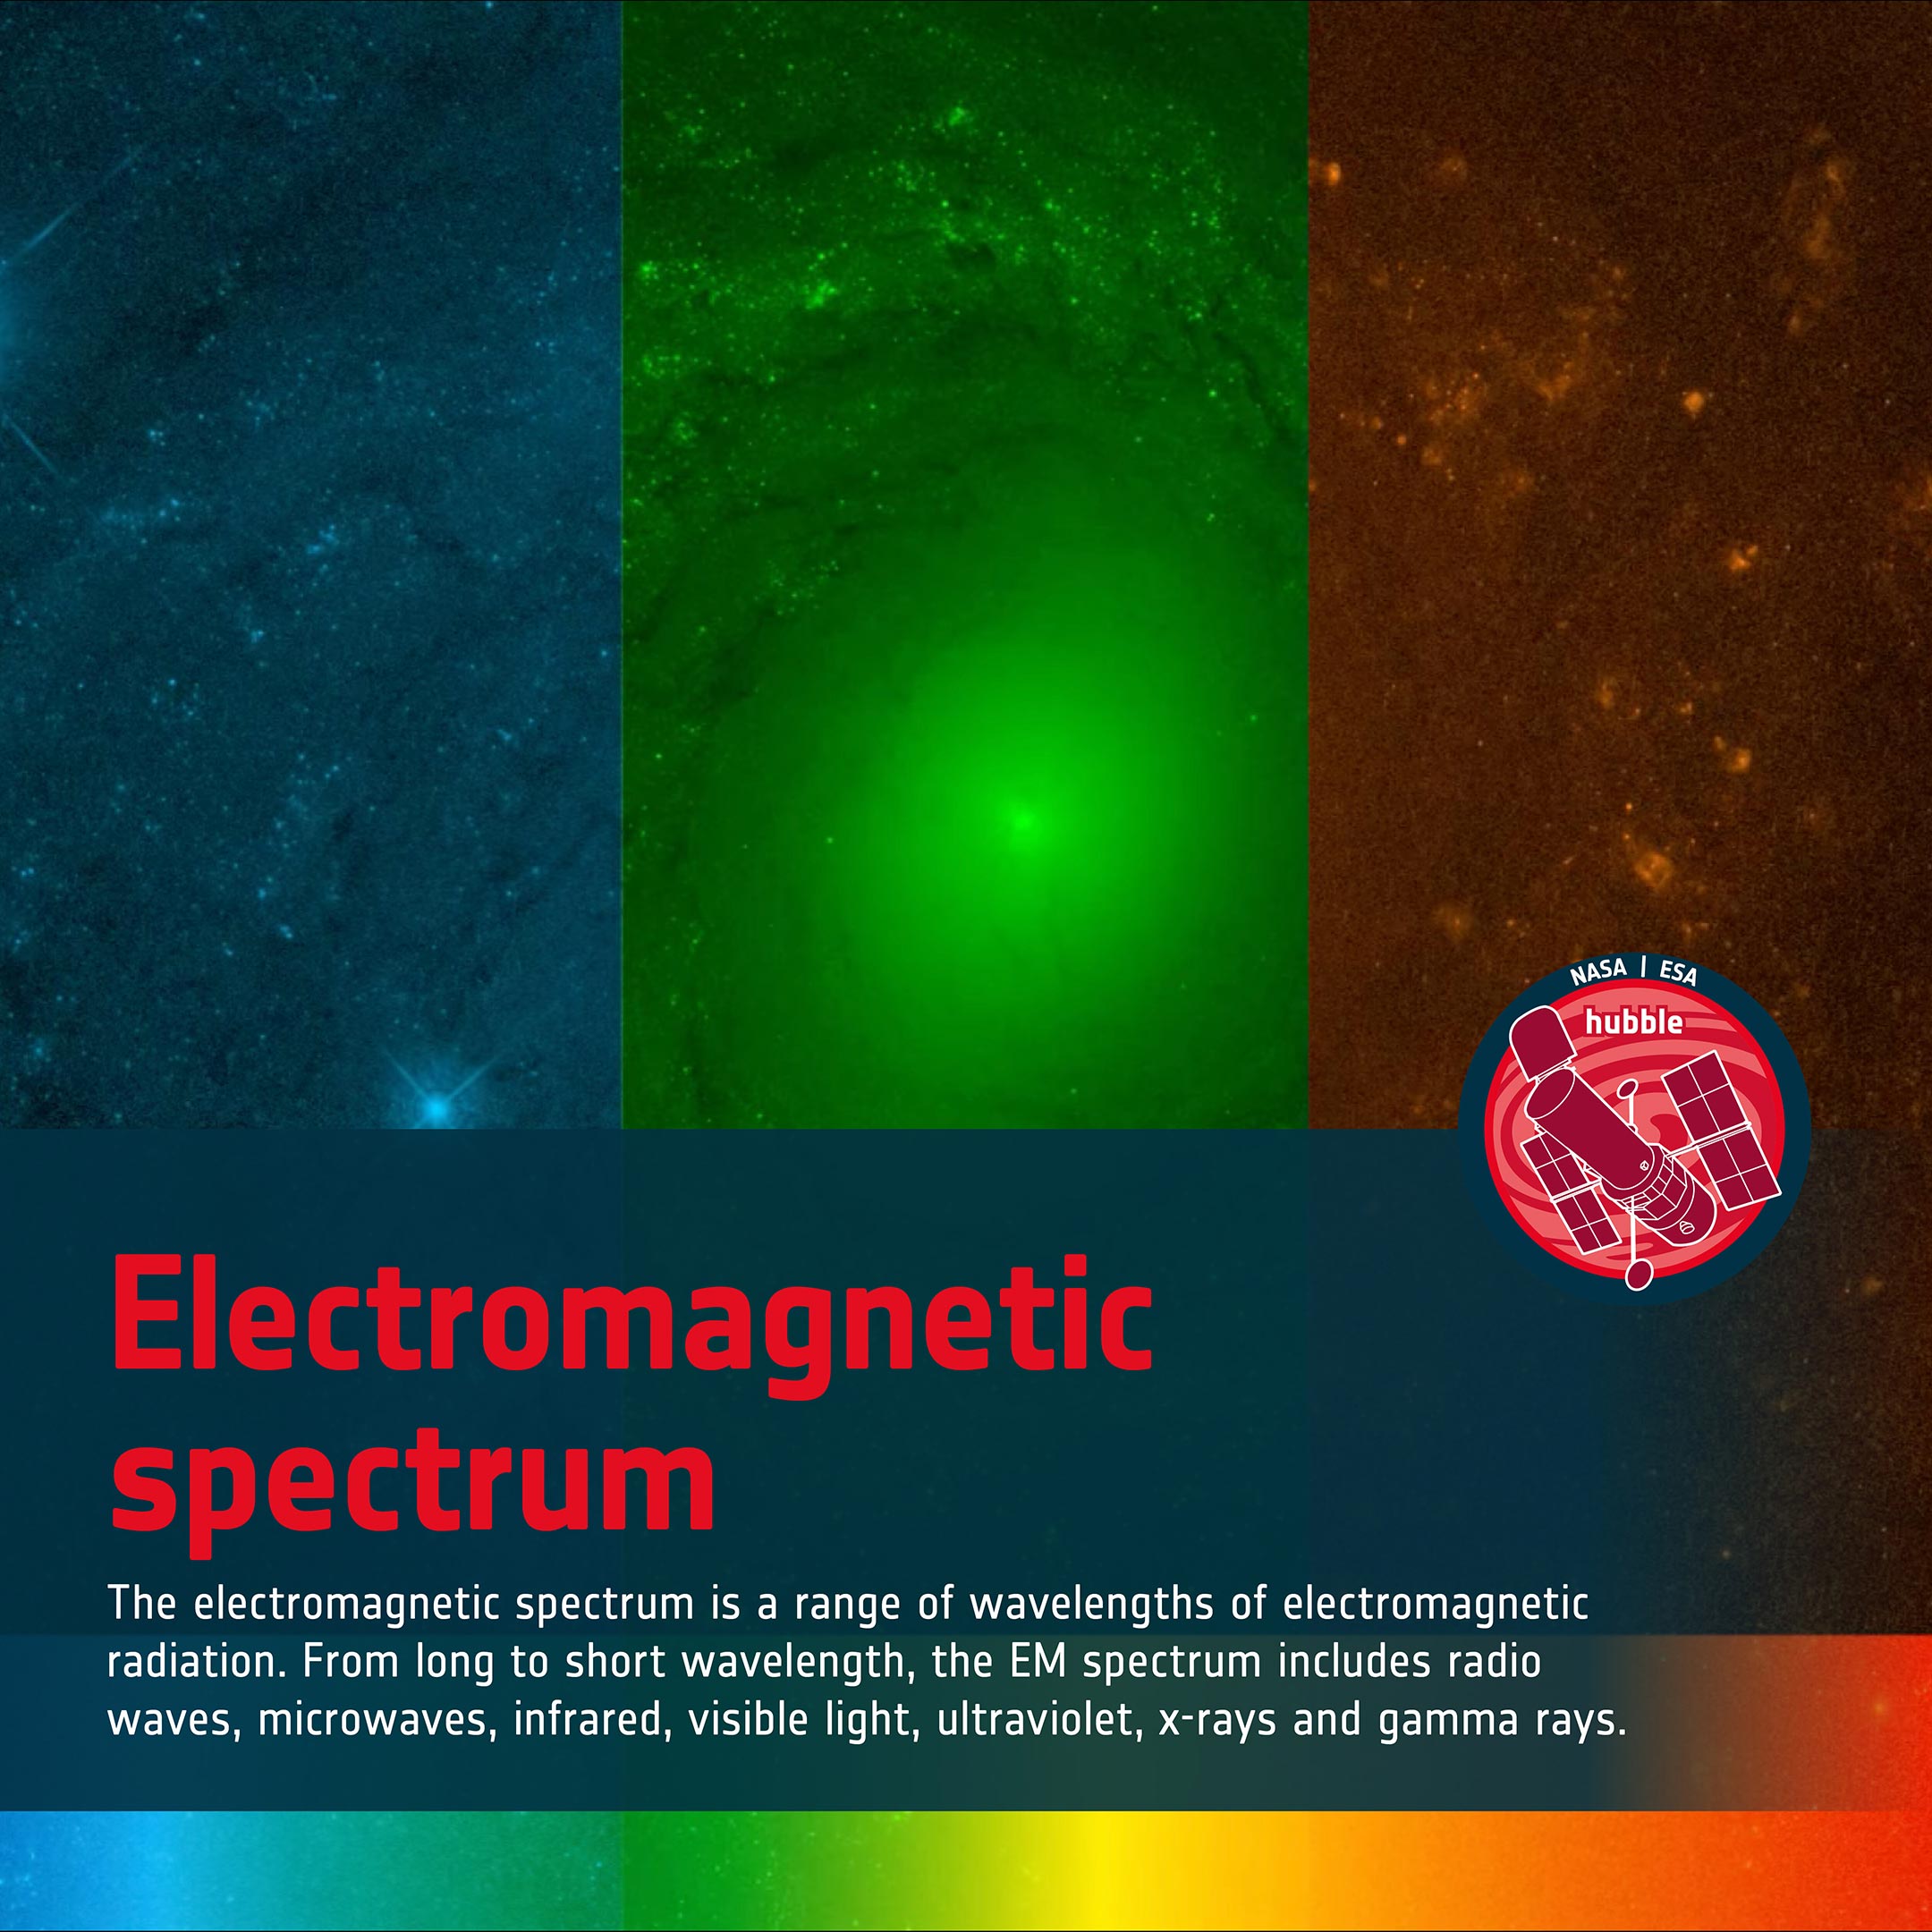
The electromagnetic spectrum is a range of frequencies of electromagnetic radiation. From long to short wavelength, the EM spectrum includes radio waves, microwaves, infrared, visible light, ultraviolet, x-rays, and gamma rays.
Energy travels through space as electromagnetic (EM) waves, which are made up of oscillating electric and magnetic fields. EM waves do not require a material (such as air or water) to move through, hence they can, unlike sound, travel through empty space. All electromagnetic waves travel at the same speed in a vacuum: the speed of light (which is itself an EM wave).
An EM wave, like other waves, is defined by its wavelength, and the range of wavelengths we observe, from extremely long to very short, is referred to as the EM spectrum. The electromagnetic spectrum is loosely divided into divisions based on how the waves behave when they interact with matter, and each division is given a name. Radio waves have the longest wavelengths, followed by microwaves, infrared, visible light, ultraviolet, X-rays, and finally gamma rays, which have the shortest wavelengths.
Celestial objects such as stars, planets, and galaxies all emit electromagnetic waves at various wavelengths, therefore telescopes are built to be sensitive to different sections of the electromagnetic spectrum. Shorter wavelengths are referred to as ‘bluer,’ while longer wavelengths are referred to as’redder.’ EM radiation in and near the visible region of the spectrum is generally referred to broadly as ‘light.’
We can construct a more complete image of an object’s structure, composition, and behavior by combining observations at different wavelengths than visible wavelengths alone can convey.
The electromagnetic spectrum is a range of wavelengths of electromagnetic radiation. From long to short wavelength, the EM spectrum includes radio waves, microwaves, infrared, visible light, ultraviolet, x-rays and gamma rays. Credit: ESA/Hubble
For more than three decades, Hubble has studied the Universe using its 2.4-meter (7.9-foot) primary mirror and its five science instruments. They observe primarily in the ultraviolet and visible parts of the spectrum, but also have some near-infrared capabilities. Hubble observes in different wavelength bands, one band at a time, each providing different information on the object under study. Each of these wavelengths is reproduced in a different color and these are combined to form a composite image that well resembles the true emission from that celestial object.
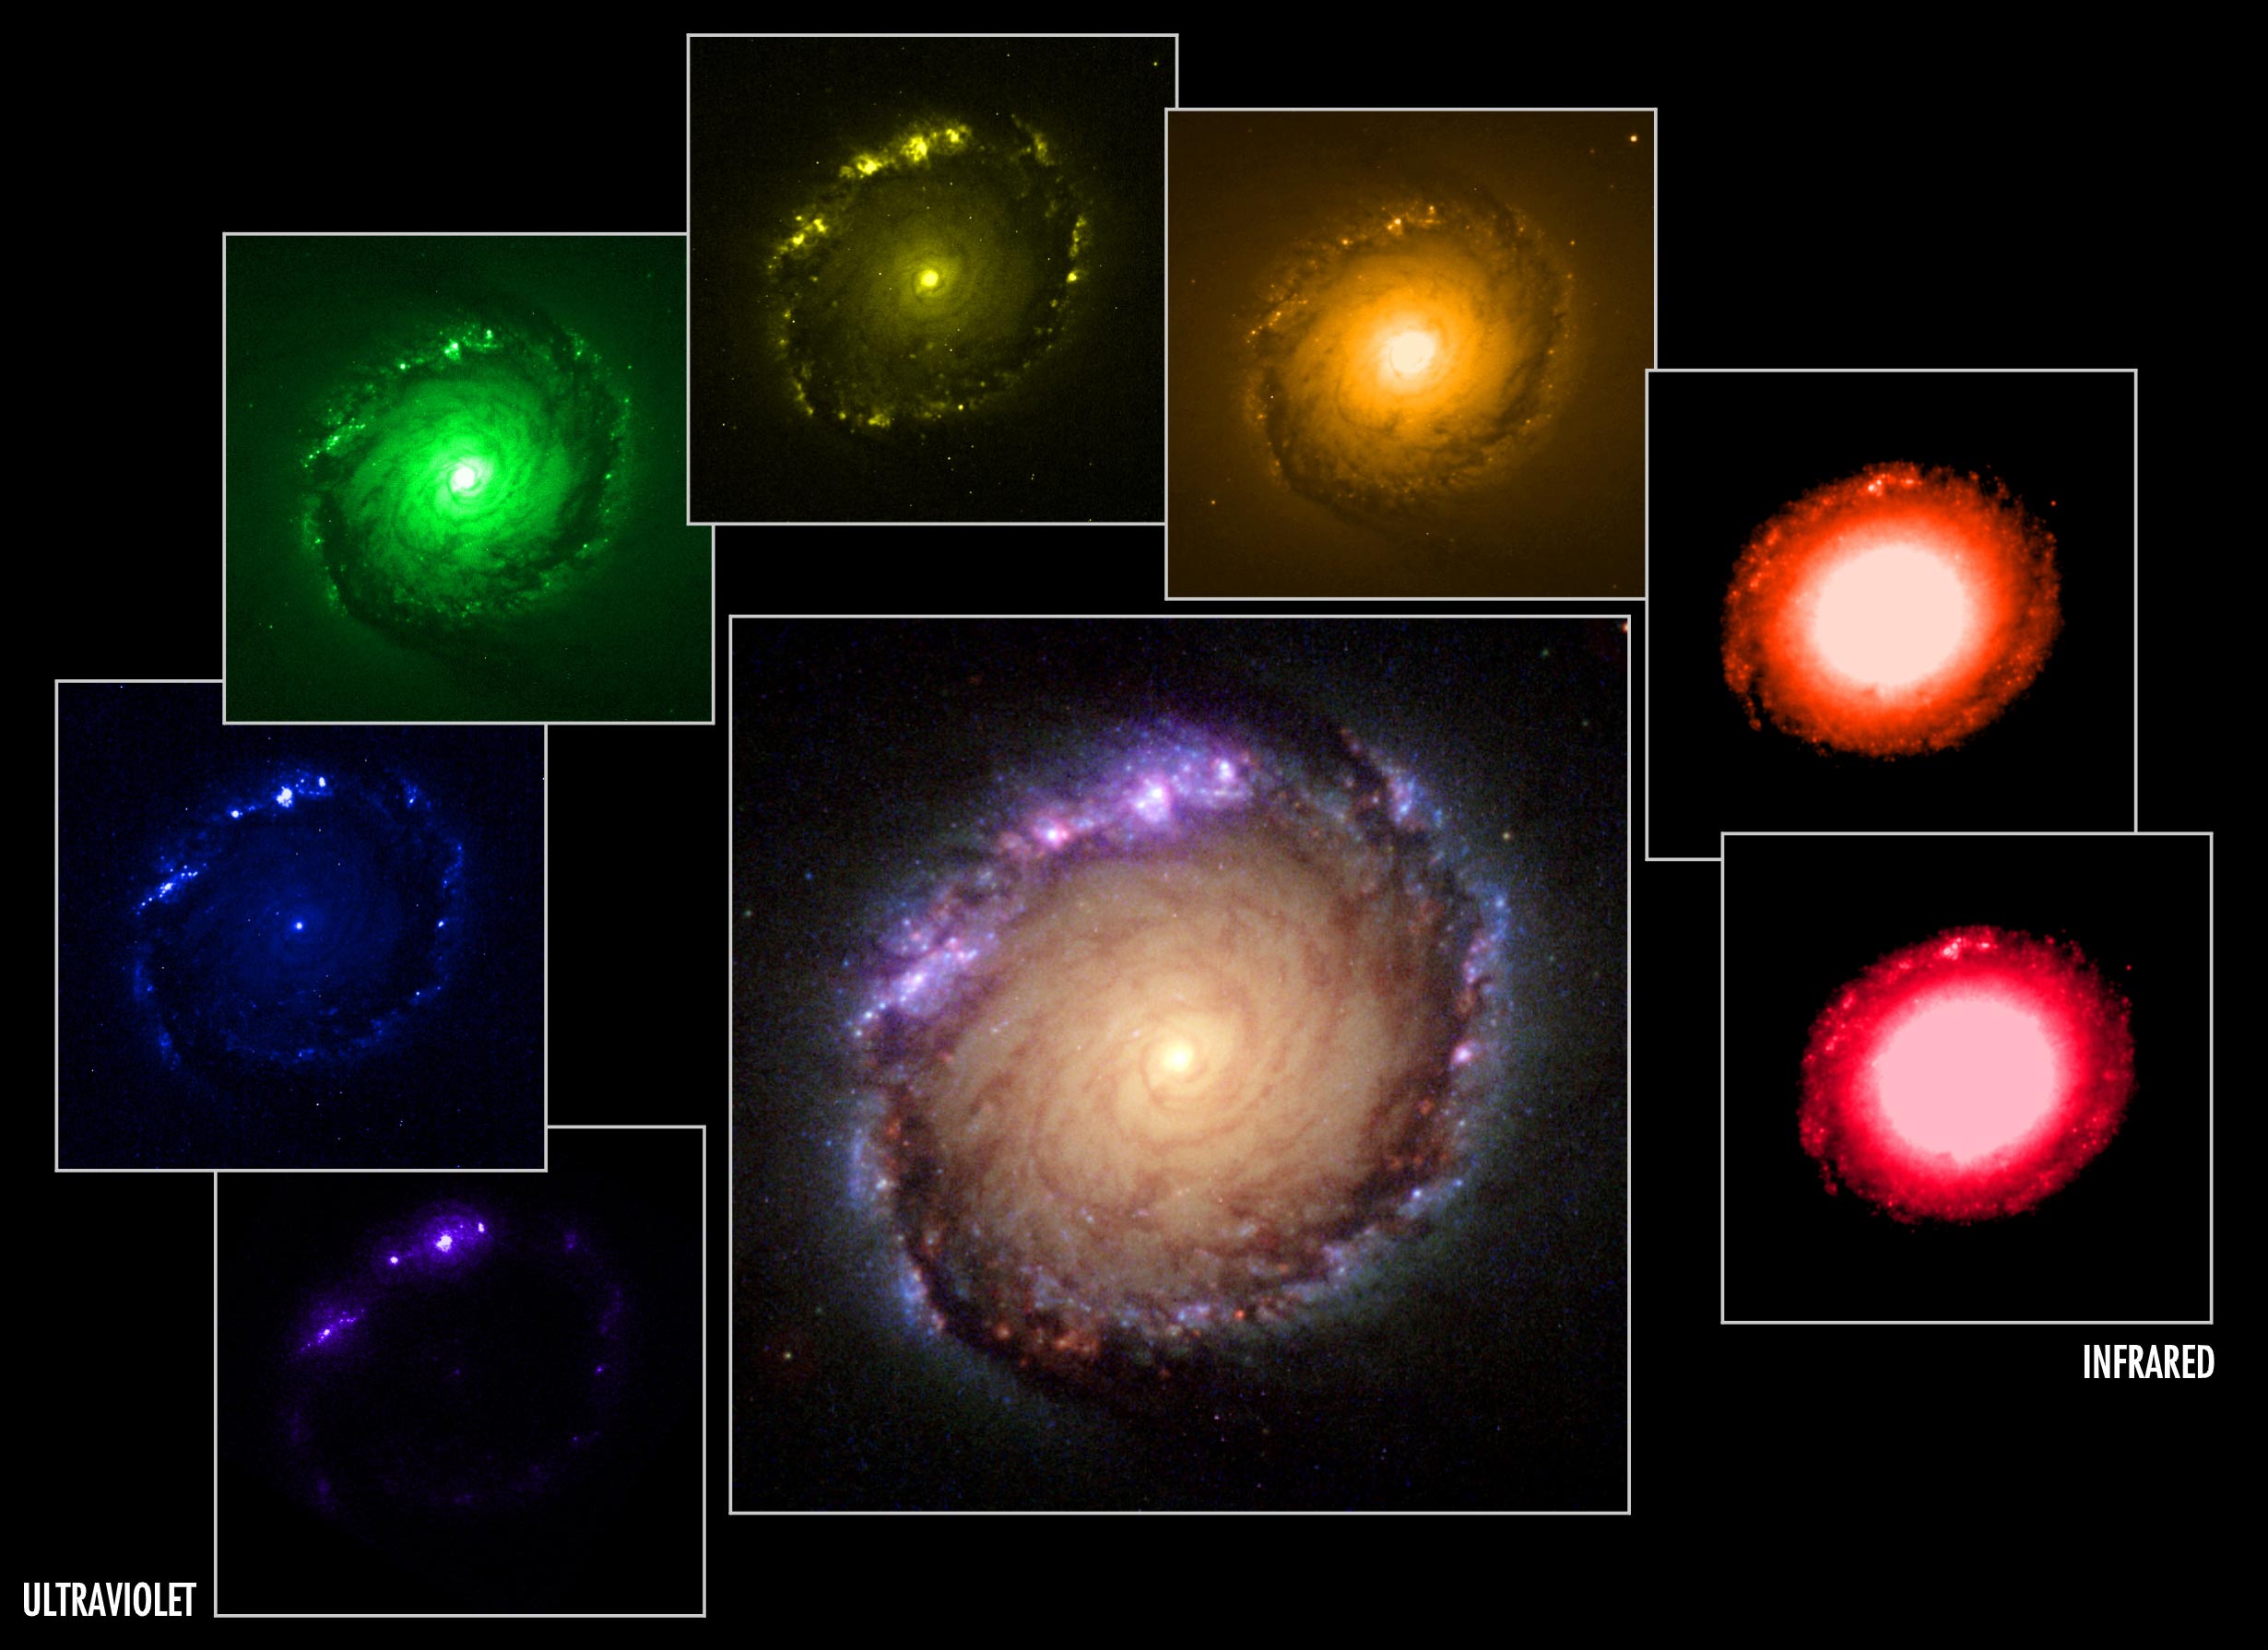
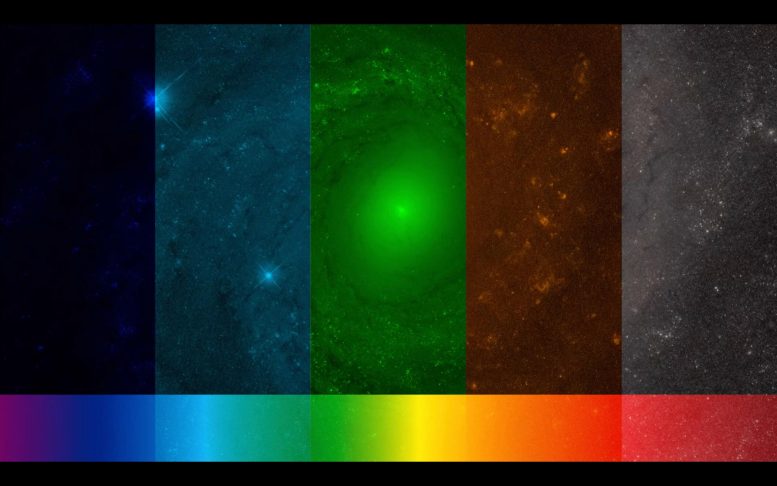
Each image represents a specific color or wavelength region of the spectrum, from ultraviolet to near infrared, and shows the wide wavelength region covered by Hubble. Celestial bodies emit light at a variety of wavelengths, anywhere from gamma rays to radio waves. Astronomers chose to study NGC 1512 in these colors to emphasize important details in the ring of young star clusters surrounding the core.
Credit: NASA, ESA, Dan Maoz (Tel-Aviv University, Israel, and Columbia University, USA)
By exploring the image above, you can see how astronomers have used a set of single-color images to construct the color picture of a ring of star clusters surrounding the core of the galaxy NGC 1512. Each image represents a specific color or wavelength region of the spectrum, from ultraviolet to near-infrared, and shows the wide wavelength range covered by Hubble. Astronomers chose to study NGC 1512 in these colors to emphasize important details in the ring of young star clusters surrounding the core.
Astronomers use multi-wavelength imagery to study details that might not otherwise be present in visible images. For example, a new multiwavelength observation of Jupiter released in 2020 by Hubble in ultraviolet/visible/near-infrared light of Jupiter gave researchers an entirely new view of the giant planet. These observations provided insights into the altitude and distribution of the planet’s haze and particles and showed Jupiter’s ever-changing cloud patterns. The planet’s aurorae are only visible in the ultraviolet; however, the structure of the red spot is well studied at visible wavelengths.
To celebrate the telescope’s 25th anniversary in 2015, Hubble unveiled two new beautiful portraits of the popular Pillars of Creation, revealing how different details can be studied in visible and near-infrared observations. While the visible light captures the multi-colored glow of gas clouds, the infrared image penetrates much of the obscuring dust and gas to uncover countless newborn stars.
We invite you to watch this Hubblecast that explores how Hubble’s observations differ across different wavelengths of the electromagnetic spectrum, and how these observations will be complemented by those of the James Webb Space Telescope.
Never miss a breakthrough: Join the SciTechDaily newsletter.
Follow us on Google and Google News.
1 Comment
“Astronomers have used this set of single-color images, shown around the edge, to construct the color picture (center) of a ring of star clusters surrounding the core of the galaxy NGC 1512.”
Because a computer display device works with just three primary colors (RGB), I would be interested in knowing just how they compressed 7 different images into three colors. Did they use band ratios or weighted averages, or some other technique?