In 2023, Mauna Loa Observatory recorded an unprecedented 86% increase in atmospheric carbon, a spike not due to fossil fuel emissions but exacerbated by weakened natural carbon sinks like forests and oceans.
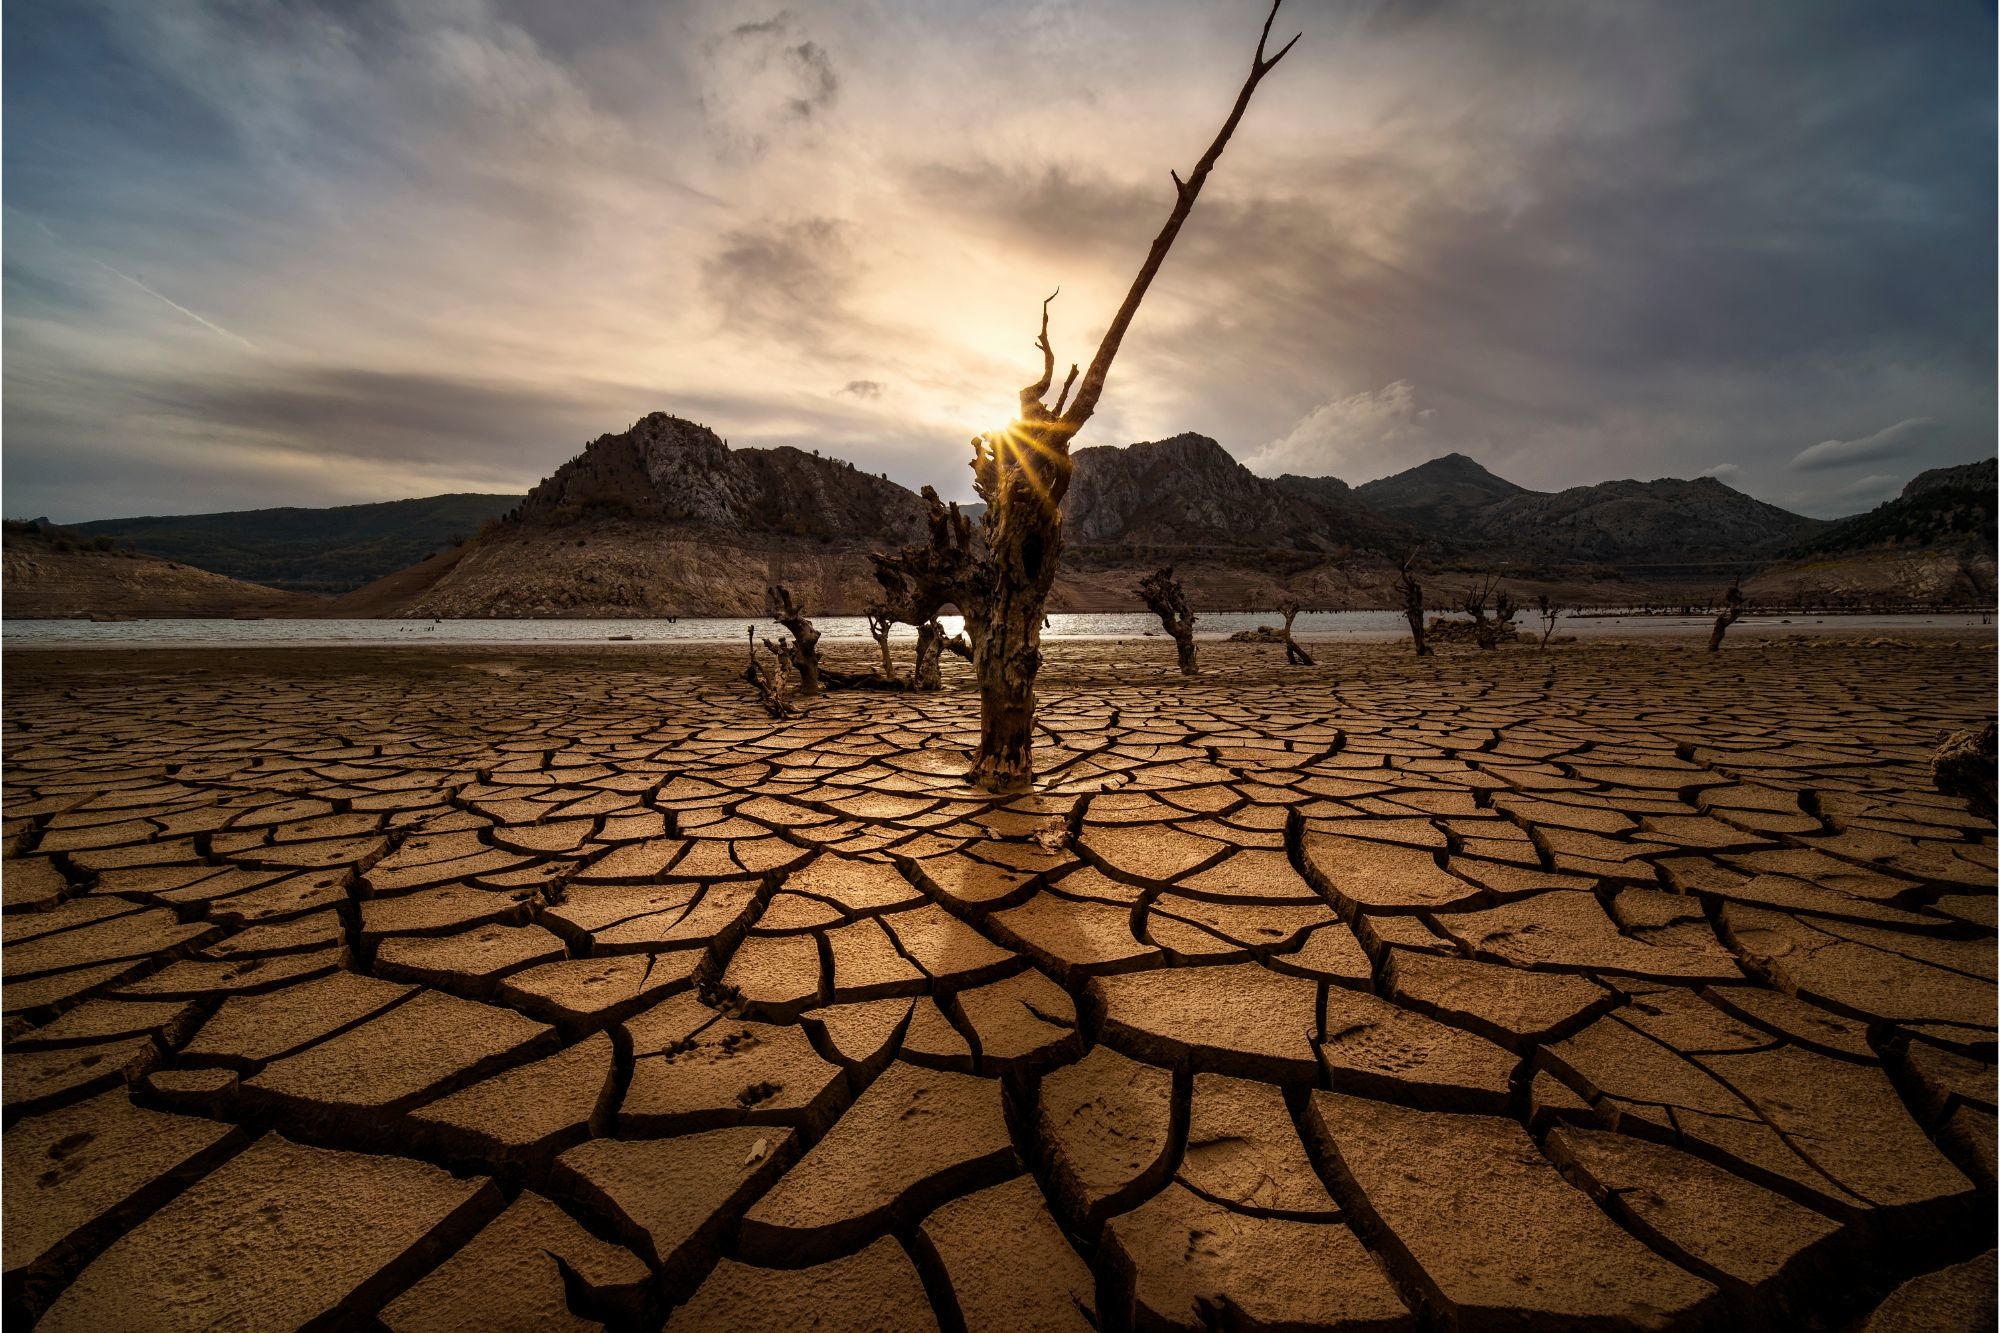
Research indicates extreme weather events, including wildfires and droughts, significantly reduced these ecosystems’ carbon absorption abilities, signaling a critical shift that could impact global climate policy.
Surge in Atmospheric Carbon
Atmospheric carbon concentrations measured at Hawaii’s Mauna Loa Observatory surged by an unprecedented 86% in 2023 compared to the previous year, the highest increase recorded since observations began in 1958.
Interestingly, fossil fuel emissions only rose by about 0.6% during the same period. This suggests that the spike was likely driven by other factors, such as a decline in the ability of natural ecosystems to absorb carbon.
To investigate the causes behind this alarming trend, an international team of scientists, supported by the European Space Agency’s (ESA) Science for Society Near-Realtime Carbon Extremes project and the Climate Change Initiative RECCAP-2 project, analyzed satellite data and global vegetation models. Their goal was to quickly produce an updated carbon budget for 2023.

Deteriorating Carbon Sinks
Typically, land ecosystems absorb around one-third of human-generated carbon dioxide emissions. However, the team’s findings, published in National Science Review, revealed that in 2023, this capacity dropped to just one-fifth of its usual level, marking the weakest performance of land-based carbon sinks in two decades.
The graph above shows changes in the declining northern land carbon sink (blue) and the variations of tropical land flux (green) for 2015–2023. The solid lines reflect analyses using dynamic global vegetation models while the dotted lines are based on data from NASA–JPL’s Orbiting Carbon Observatory-2 mission.
Climate Events Intensify Carbon Release
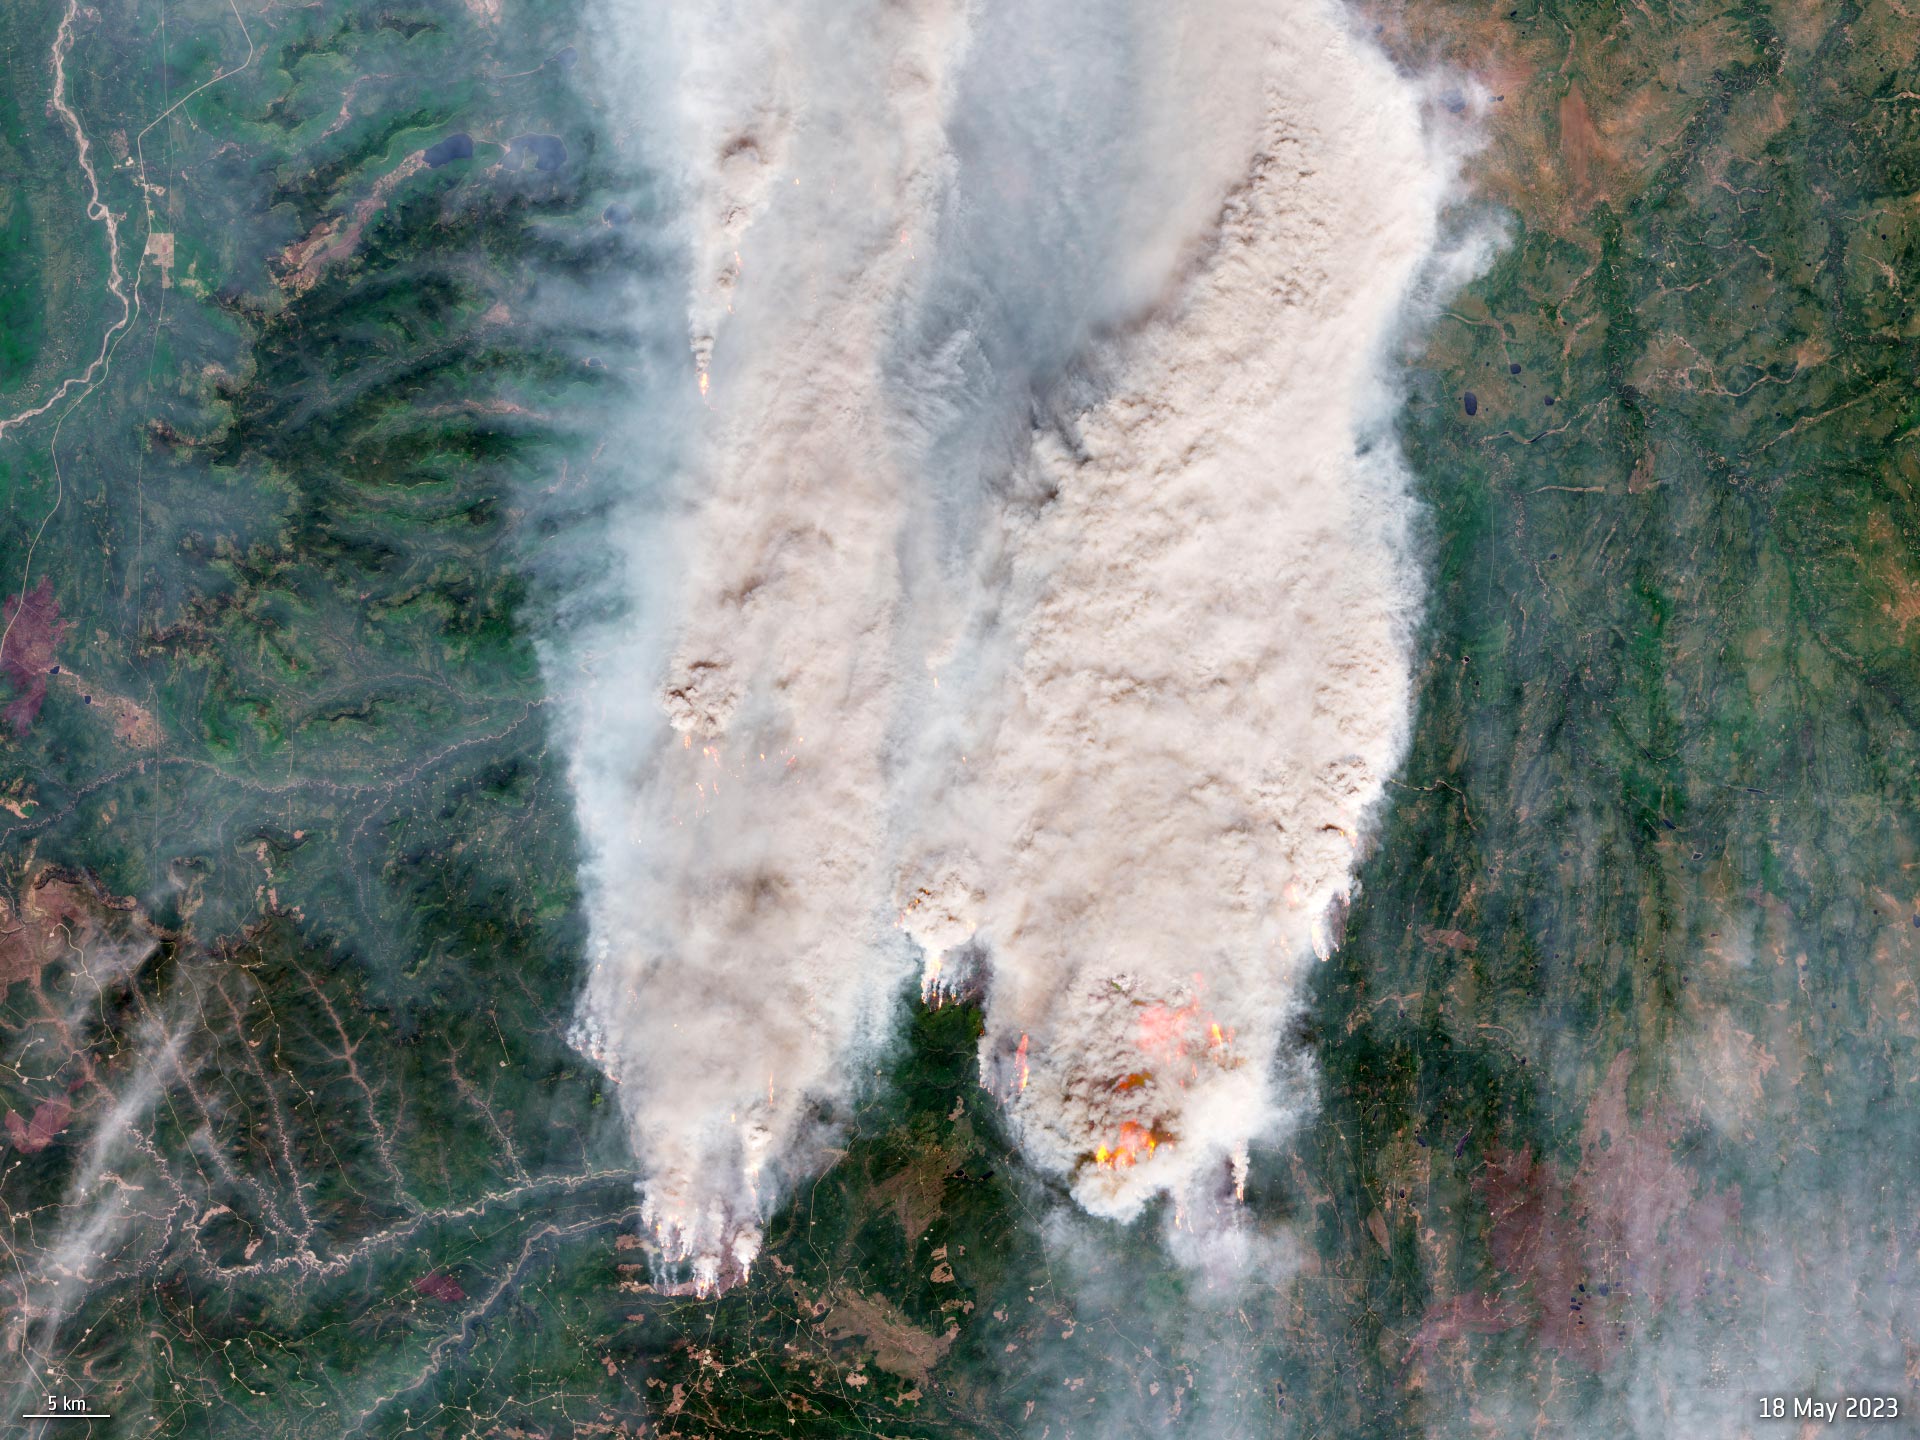
Philippe Ciais, from France’s Laboratory for Climate and Environmental Sciences, explained, “Our research shows that 30% of this decline was driven by the extreme heat of 2023, which fuelled massive wildfires that ravaged vast areas of Canadian forest and triggered severe drought across parts of the Amazon rainforest.
“These fires and droughts led to substantial vegetation loss, weakening the land ecosystem’s ability to absorb carbon dioxide. This was further compounded by a particularly strong El Niño, which historically reduces the carbon absorption capacity in the Tropics.”
Long-term Consequences and Policy Implications
Widespread wildfires across Canada and droughts in the Amazon in 2023 released about the same amount of carbon to the atmosphere as North America’s total fossil fuel emissions, underscoring the severe impact of climate change on natural ecosystems.
The Amazon – one of the world’s most crucial carbon sinks – is showing signs of long-term strain, with some regions shifting from absorbing carbon to becoming net sources of carbon emissions.
The researchers suggest that the declining capacity of Earth’s land ecosystems to absorb carbon dioxide may indicate that these natural carbon sinks are nearing their limits and no longer able to provide the mitigation service they have historically offered by absorbing half of human-induced carbon dioxide emissions.
“Consequently, achieving safe global warming limits will require even more ambitious emission reductions than previously anticipated,” stated Philippe Ciais.
The study also highlights that current climate models might be underestimating the rapid pace and impact of extreme events, such as droughts and fires, on the degradation of these crucial carbon reservoirs.
Stephen Plummer, ESA Earth Observation Applications Scientist, noted, “Understanding the knock-on effects of climate change on the carbon cycle is imperative and the two ESA study projects demonstrate the importance of Earth observation in the development of methodologies to provide rapid assessment of these impacts globally.”
ESA’s Acting Head of the Actionable Climate Information Section, Clement Albergel, added, “These results are particularly alarming, especially considering the difficulty the world is having limiting warming to 1.5°C, as laid out in the Paris Agreement.”
Reference: “Low latency carbon budget analysis reveals a large decline of the land carbon sink in 2023” by Piyu Ke, Philippe Ciais, Stephen Sitch, Wei Li, Ana Bastos, Zhu Liu, Yidi Xu, Xiaofan Gui, Jiang Bian, Daniel S Goll, Yi Xi, Wanjing Li, Michael O’Sullivan, Jeffeson Goncalves de Souza, Pierre Friedlingstein and Frédéric Chevallier, 22 October 2024, National Science Review.
DOI: 10.1093/nsr/nwae367
Never miss a breakthrough: Join the SciTechDaily newsletter.
Follow us on Google and Google News.
8 Comments
This is dramatically, and incomprehensibly wrong. The Mauna Loa Observatory’s average 2022 readings for atmospheric CO2 concentrations was 418.5ppm, and this rose to 421.1ppm for the average in 2023. This is a rise of just 0.61% yoy.
Readers can check the data for themselves here: https://gml.noaa.gov/ccgg/trends/data.html
SciTech Daily should withdraw the article now, apologize to their readers, and enquire how on earth it came to be publishing such obvious rubbish!
Thanks for the link. 2022 had an annual CO2 increase that was anomalously low (1.81 PPM versus about 2.3 to 2.9 for the previous 4 years) and 2023 was anomalously high at 3.4. Doing the math, I get a percentage increase of about 46%, NOT the 86% claimed in the article. I suspect that they are playing some kind of shell game by using the weight of carbon rather than the molar-fraction of carbon dioxide.
I have checked your numbers, and they are correct.
One of the lines of evidence used to support the claim of anthropogenic global warming is the coincidence that the annual increase in atmospheric CO2 is about half of the calculated anthro’ emissions. However, the article states, “Widespread wildfires across Canada and droughts in the Amazon in 2023 released about the same amount of carbon to the atmosphere as North America’s total fossil fuel emissions, …” So, how are anthro’ emissions considered evidence for the source of warming when there is another, equivalent source that isn’t usually acknowledged?
By limiting the analyses to the annual averages or net differences, important seasonal differences are hidden. There are two important seasonal phases, the Fall-Winter-Spring (F-W-S) ramp-up, and the Summer draw-down. The F-W-S ramp-up is dominated by tree respiration and biological decomposition of organic materials, while the Summer draw-down is dominated by the activity of photosynthetic terrestrial plants, and plankton. To untangle the confounding effects of multiple sources and sinks, it is necessary to at least look at the seasonal phases, which wasn’t done.
Is the claimed 86% increase in atmospheric carbon at the annual peak (the end of the ramp-up phase), at the end-of the annual draw-down phase, or some arbitrary mid-range value? This is a poorly written article. The question, once again, is it incompetence or malfeasance?
“The Amazon – one of the world’s most crucial carbon sinks – is showing signs of long-term strain, …”
The first CO2 map produced from OCO-2, and released to the public at the annual AGU meeting in December 2014, also shows that despite being in the tropics, and not having strong seasonality such as what the Earth experiences north of the Tropic of Cancer, the Amazon is a MAJOR source of CO2.
https://www.eoportal.org/ftp/satellite-missions/o/OCO2_040422/OCO2_Auto10.jpeg
“The solid lines reflect analyses using dynamic global vegetation models while the dotted lines are based on data from NASA–JPL’s Orbiting Carbon Observatory-2 mission.”
It should be noted that the empirical data from OCO-2 measures about twice the net CO2 flux for northern land compared to the model predictions; the OCO-2 measurements for the tropics sinks are similarly about twice the (absolute) model predictions, except for the last two years. That is a large difference and the uncertainty bars (unspecified sigma) don’t even overlap.
I’m reminded of the quote by Dr. Feynman: “It doesn’t matter how beautiful your theory is, it doesn’t matter how smart you are. If it doesn’t agree with experiment, it’s wrong.”
From the actual journal abstract, “Here we show a global net land CO2 sink of 0.44 [sic]± 0.21 [sic] GtC yr−1, the weakest since 2003.”
Restated properly, they are claiming a global net land CO2 sink of 0.4 ± 0.2 GtC yr−1. Stated a little differently, that becomes 0.4 ± 50% GtC yr−1. The sigma assumed is not explicitly stated; If it is one- sigma (68%), which is common in climatology, then the more usual 2-sigma used in other disciplines would give an uncertainty of ± 100%, which means that there is approximately a 95% probability of the value being between 0.0 and 0.8. That is not very useful other than being able to say that the net flux is probably small but not negative.
I just checked with NOAA and they acknowleded that the uncertainty for the MLO data is the standard deviation for a monthly average and it is the 68% probability. There is no indication that this research has properly propagated the error through their calculations.
From the NOAA website for MLO data:
“The Mauna Loa data are being obtained at an altitude of 3400 m in the northern subtropics, and may not be the same as the globally averaged CO2 concentration at the surface.
NOTE: Due to the eruption of the Mauna Loa Volcano, measurements from Mauna Loa Observatory were suspended as of Nov. 29, 2022. Observations from December 2022 to July 4, 2023 are from a site at the Maunakea Observatories, approximately 21 miles north of the Mauna Loa Observatory. Mauna Loa observations resumed in July 2023.”
The authors don’t seem to take note that the data for 2023 have two sources and are of questionable continuity. They may be comparing apples and pineapples.